0276
Imaging hypoxia in head and neck cancer xenografts with oxygen-enhanced MRI1Radiotherapy & Imaging, Institute of Cancer Research, Sutton, United Kingdom, 2Centre for Imaging Sciences, University of Manchester, Manchester, United Kingdom, 3Nottingham University Hospital, Nottingham, United Kingdom
Synopsis
Oxygen-enhanced (OE)-MRI was used to map and quantify hypoxia in head and neck squamous cell carcinoma xenografts, a tumour type in which hypoxia adversely affects patient prognosis. Application of a refined OE-MRI protocol revealed a markedly high proportion of voxels refractory to hyperoxia-induced changes in R1, shown to be hypoxic in imaging-aligned tissue sections stained for the hypoxia marker pimonidazole.
Introduction
Tumour hypoxia, which results from an imbalance between oxygen delivery and oxygen consumption, is an established hallmark of cancer1. Tumour hypoxia is associated with resistance to radiotherapy2 and chemotherapy3, and mediates metastasis. Hypoxia represents a major challenge in the treatment of head and neck squamous cell carcinoma (HNSCC), and its adverse effects on patient prognosis are well-established4.Non-invasive imaging methods to repeatedly and rapidly quantify the degree and spatial distribution of hypoxia within an individual tumour would offer clear clinical benefit5. One such approach, oxygen-enhanced (OE)-MRI, relies on quantifying changes in the longitudinal MRI relaxation rate R1 induced by excess paramagnetic oxygen molecules dissolved in blood plasma and interstitial fluid with inhalation of oxygen. When combined with a DCE-MRI derived biomarker of perfusion, we have shown in renal and colorectal cancer xenografts that perfused tumour sub-volumes refractory to hyperoxia-induced changes in R1, termed “perfused Oxy-R” (pOxyR), were hypoxic, through comparison with image-aligned tissue sections stained for the hypoxia marker pimonidazole6.
OE-MRI is an emerging technique, and studies are now required to evaluate pOxyR in tumour types in which hypoxia is known to adversely affect patient prognosis. To address this, we investigated the use of OE-MRI to map and quantify hypoxia in HNSCC xenografts.
Methods
All experiments were performed in accordance with the UK Animals (Scientific Procedures) Act 1986. HNSCC xenografts were propagated subcutaneously in the flanks of female NCr nude mice using EGFR TKI-sensitive (CalS) or TKI-resistant (CalR) CAL-27 cells, or LICR-LON-HN5 cells. For comparison, 786-O-R renal cell adenocarcinoma (RCA) xenografts were grown in scid mice. Pimonidazole (60mg/kg i.p.) was administered 45 minutes prior to imaging on a Bruker 7T horizontal bore MRI system.Multi-slice T2-weighted MRI was used to plan OE-MRI imaging using a 128x128 matrix over a 3cm FOV. T1 (IR-TrueFISP, TE=1.7ms; TR=3.4ms, 50 TIs: 72.1-2738ms) and R2* (MGE, 8 echoes; TE=3-24ms; TR=200ms) were quantified from a central 1mm transverse tumour slice under air and subsequently 100% oxygen-breathing. This was followed by intravenous administration of USPIO particles (150 µmolFe/kg, P904, Guerbet) and acquisition of a final set of MGE images for determination of fractional blood volume (fBV), used to provide a perfusion mask. Parametric R1 (1/T1), R2* and fBV maps were calculated voxelwise for tumour ROIs using in-house software. ΔR1 maps were binarised to identify voxels that enhanced (OxyE) with or were refractory (OxyR) to hyperoxia and these maps were combined with fBV to identify perfused voxels refractory to hyperoxia (pOxyR).
Following MRI, the perfusion marker Hoechst 33342 (15mg/kg i.v.) was administered for 1 minute and tumours rapidly excised and bisected at the imaging plane for snap freezing or formalin fixation. Whole tumour sections cut in the imaging plane were processed for pimonidazole adduct formation and Hoechst 33342 uptake, and tinctorially stained with haematoxylin & eosin. Significant differences were identified using Student’s t-test, assuming a significance level of 5%.
Results
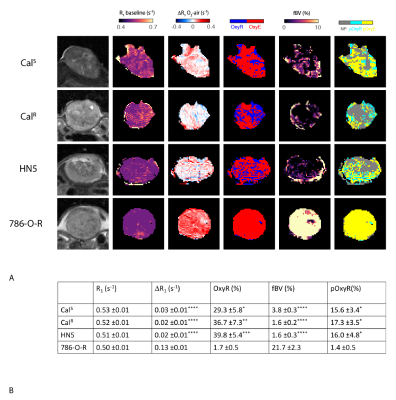
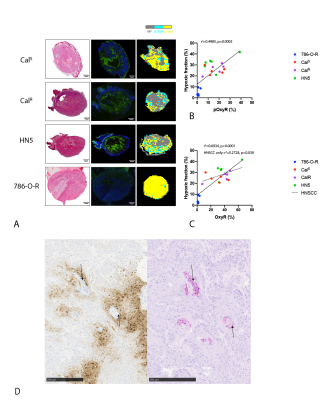
The OE-MRI protocol revealed a highly heterogeneous distribution in baseline R1, hyperoxia-induced ΔR1 and fBV across the HNSCC xenografts (Figure 1A). Although there was no significant difference in baseline R1, the hyperoxia-induced ΔR1 in each of the HNSCC xenografts was significantly lower (p<0.0001) compared to the RCA tumours (Figure 1B). OxyR (p<0.01) and pOxyR fractions (p<0.01) were significantly higher in all three HNSCC models. Tumour fBV was significantly (p<0.0001) lower in the HNSCC models than in the well-perfused RCA models. There were no significant differences in any parameters between the HNSCC models.For all tumour types, pOxyR voxels were macroscopically associated with areas of pimonidazole adduct formation (Figure 2A). In the HNSCC xenografts, pimonidazole staining appeared more extensive than the distribution of pOxyR voxels. In these tumours, a weak correlation was found between OxyR and hypoxia (r2=0.2728, p=0.038), but not with pOxyR (Figure 2B&C). Assessment of formalin-fixed HNSCC sections revealed that in areas identified as non-perfused on the fBV maps, pimonidazole staining was peripheral to keratinised regions identified by H&E staining (Figure 2D).
Discussion
We have developed a refined OE-MRI protocol that incorporates susceptibility-contrast with USPIO particles for quantitation of fBV, thereby providing a more specific perfusion mask to binarise with the hyperoxia-induced ΔR1 data to derive pOxyR maps. This protocol enables evaluation of oxygen-induced ΔR2* and fBV as additional putative biomarkers of tumour hypoxia in the same imaging session. Application of this protocol to three HNSCC xenograft models revealed a markedly high proportion of pOxyR voxels, consistent with the high degree of hypoxia expected in this tumour type.Surprisingly, in the HNSCC models we found that the proportion of OxyR, but not pOxyR voxels correlated with pimonidazole-derived hypoxic fraction. We have previously assumed that poorly vascularized regions are necrotic. However, our OE-MRI method identified non-perfused regions associated with keratinization and hypoxia but containing viable cells, questioning this assumption. Interestingly, hypoxia-independent pimonidazole staining can occur in more differentiated head and neck tumours, highlighting the need for caution in hypoxia quantification7. This may explain the apparent macroscopic mismatch between pOxyR and histologically-derived hypoxic fraction seen herein.
Conclusion
OE-MRI can identify and map the heterogeneity and extent of hypoxia in head and neck cancer xenografts, but the biological processes underpinning the measurement of pOxyR in HNSCC requires further investigation.Acknowledgements
We acknowledge the support received from the Oracle Cancer Trust, for The Institute of Cancer Research Cancer Research UK Cancer Imaging Centre (C1060/A16464) in association with the MRC and Department of Health (England), and the CRUK & EPSRC Cancer Imaging Centre in Cambridge and Manchester funding to The University of Manchester (grant C8742/A18097), and the Cancer Research UK grant C16412/A27725.References
- Hammond, E. M. et al. The Meaning, Measurement and Modification of Hypoxia in the Laboratory and the Clinic. Clin. Oncol. 26, 277–288 (2014).
- Nordsmark, M. et al. Prognostic value of tumor oxygenation in 397 head and neck tumors after primary radiation therapy. An international multi-center study. Radiother. Oncol. 77, 18–24 (2005).
- Shannon, A. M., Bouchier-Hayes, D. J., Condron, C. M. & Toomey, D. Tumour hypoxia, chemotherapeutic resistance and hypoxia-related therapies. Cancer Treat. Rev. 29, 297–307 (2003).
- Brizel, D. M., Sibley, G. S., Prosnitz, L. R., Scher, R. L. & Dewhirst, M. W. Tumor hypoxia adversely affects the prognosis of carcinoma of the head and neck. Int. J. Radiat. Oncol. 38, 285–289 (1997).
- Horsman, M. R., Mortensen, L. S., Petersen, J. B., Busk, M. & Overgaard, J. Imaging hypoxia to improve radiotherapy outcome. Nat Rev Clin Oncol 9, 674–87 (2012).
- O’Connor, J. P. et al. Oxygen-Enhanced MRI Accurately Identifies, Quantifies, and Maps Tumor Hypoxia in Preclinical Cancer Models. Cancer Res. 76, 787–95 (2016).
- Janssen, H. L. K. et al. Differentiation-associated staining with anti-pimonidazole antibodies in head and neck tumors. Radiother. Oncol. 70, 91–97 (2004).
Figures

Figure 1. A. T2-weighted images of CalS, CalR, HN5 (HNSCC) and 786-O-R (RCA) xenografts, and the associated parametric maps of baseline R1 on air; hyperoxia-induced ΔR1; oxygen-refractory (OxyR, blue) and -enhanced (OxyE, red) voxels; fractional blood volume (fBV); perfused oxygen-refractory (pOxyR, cyan) and -enhanced (pOxyE, yellow) voxels.
B. Summary of the quantitative parameters derived from the OE-MRI protocol. Values are mean ±1 s.e.m.
* p<0.05; ** p<0.01; *** p<0.001; ****p<0.0001 compared to 786-O-R xenografts.
