0274
Quantitative Sodium MRI at 7T for the Early Efficacy Evaluation of Stereotactic Radiotherapy for Intracranial Tumors1State Key Laboratory of Brain and Cognitive Science, Institute of Biophysics, Chinese Academy of Sciences, Beijing, China, 2University of Chinese Academy of Sciences, Beijing, China, 3CAS Center for Excellence in Brain Science and Intelligence Technology, Beijing, China, 4Department of Neurosurgery, PLA General Hospital, Beijing, China, 5Siemens Shenzhen Magnetic Resonance Ltd., Shenzhen, China
Synopsis
Follow-up efficacy evaluation of stereotactic radiotherapy (SRT) helps to provide individualized treatment for intracranial tumors. However, biological changes at cytological level happen earlier than structural MRI can detect. Tissue sodium concentration (TSC) is sensitive to changes of tissue metabolic state and cell membrane integrity. In this study, we used sodium MRI at 7T to noninvasively quantify TSC and monitor the evolution of intracranial tumors after SRT. The results demonstrated that quantitative sodium MRI at 7T can reflect the efficacy of SRT, predict the volume change of tumor, and has the potential of finding the relapse of tumors in early stage.
INTRODUCTION
Stereotactic radiotherapy (SRT) is an established and effective treatment for intracranial tumors. Traditionally, structural MRI was used to evaluate the tumor size in 3 months after SRT, which was impossible to find the microenvironmental change of tumor in early stages. Tissue sodium concentration (TSC) is sensitive to tissue metabolic state and cell membrane integrity1,2, which can be obtained by sodium MRI at high field3. However, previous studies of sodium MRI on tumors are mostly conducted before treatment4. In this study, we acquired sodium MRI at multiple time-points before and after radiotherapy in a group of intracranial tumors. The corrected TSC maps were reconstructed to analyze the response of tumors to radiotherapy.METHODS
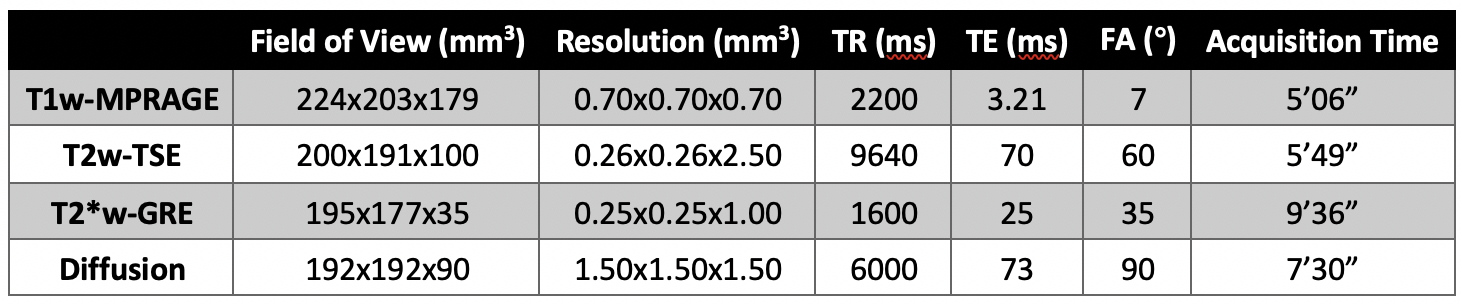
The study enrolled 16 patients (a total of 21 tumors) who were diagnosed as intracranial tumor and scheduled to undergo SRT in the hospital. A total of 10 patients with 13 tumors were scanned at 48 hours, 1 week, and 1 month after treatment. Informed consents approved by the local IRB were obtained. Sodium and proton imaging were accomplished on a 7T MRI system (Siemens, Erlangen, Germany). Proton imaging was firstly conducted with a Nova 32-channel head coil. B0 shimming parameters were recorded and input later into the sodium imaging. Structural and diffusion images were acquired with the protocols in Table 1. The sodium imaging was scanned with a home-made birdcage coil. Sodium images with TE of 0.30ms and 2.32ms were acquired with twisted projection imaging sequence5 with the following parameters: field of view = 224x224x224mm3, resolution = 3.5x3.5x3.5mm3, TR = 174ms, FA = 90°, acquisition time = 12’53”.The sodium images of different TEs were post-processed to correct for the B0 bias6. The TSC maps were linearly corrected referencing the tube phantoms with known sodium concentrations of 30, 60, 90, 120mM 7. The regions of interest (ROI) in analysis were manually defined on the sodium images by a neurosurgeon. The ratios of TSC signal between different tissues and cerebrospinal fluid (CSF) were calculated and compared.
RESULTS
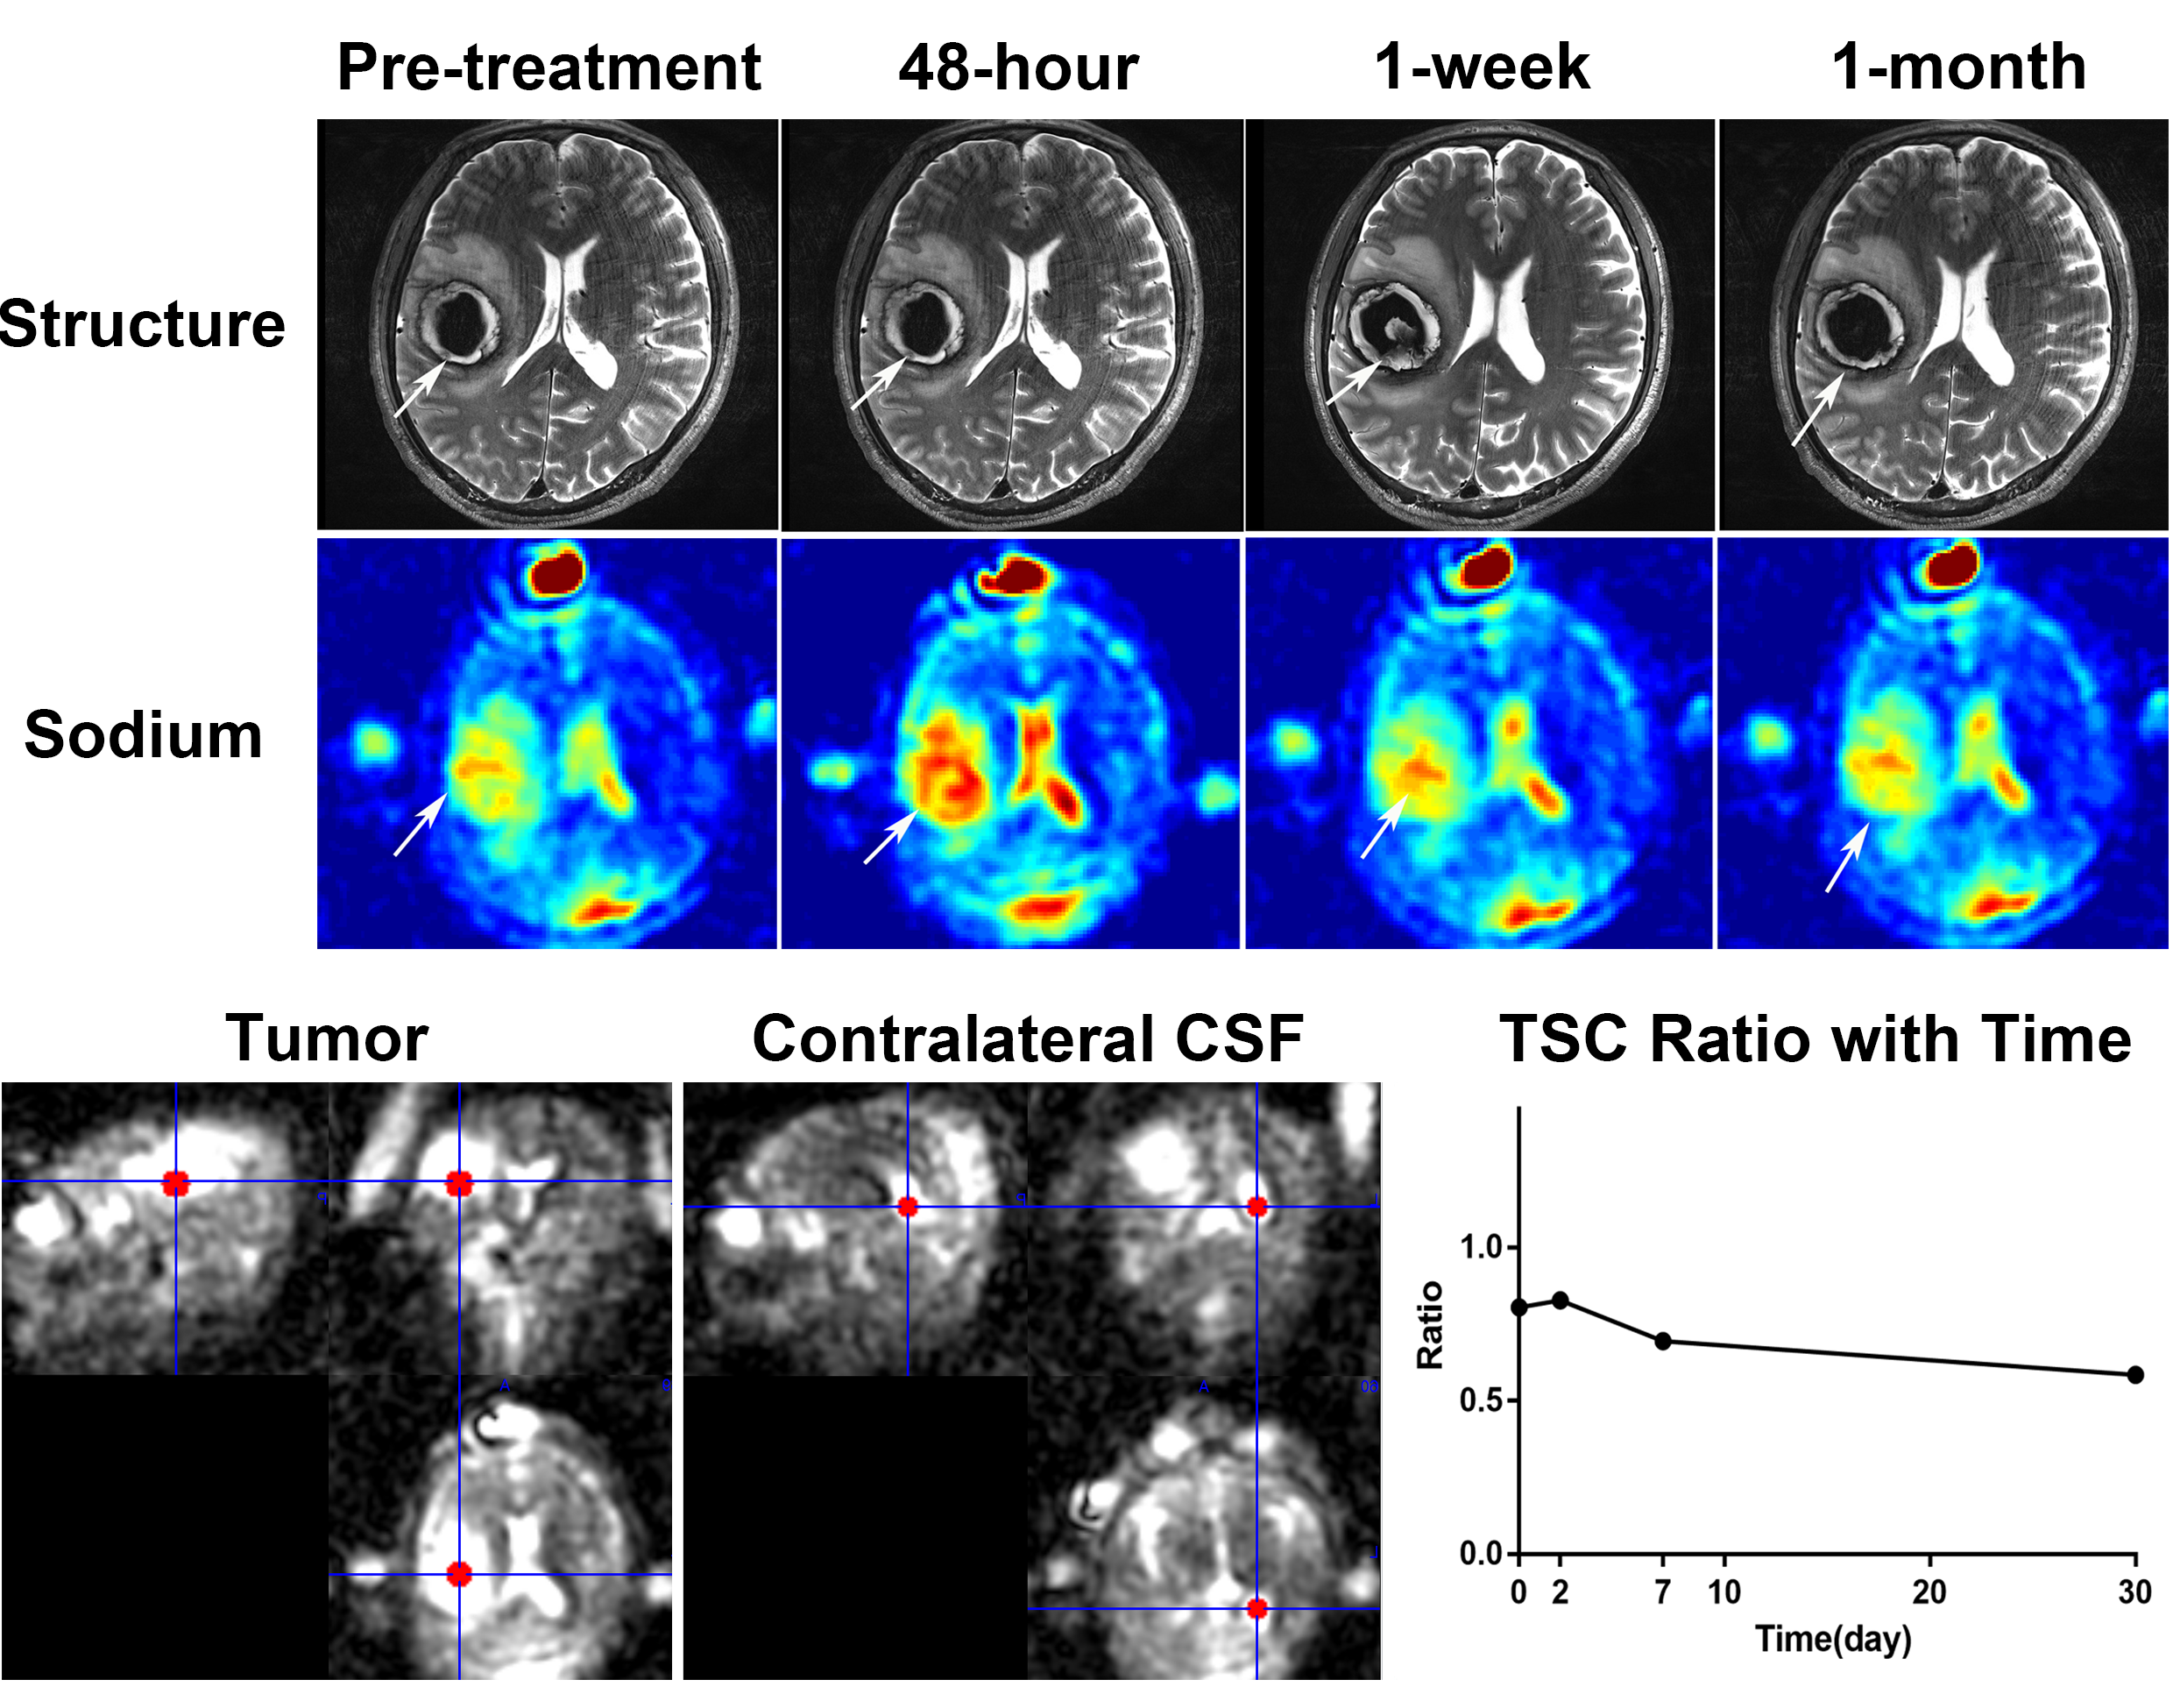
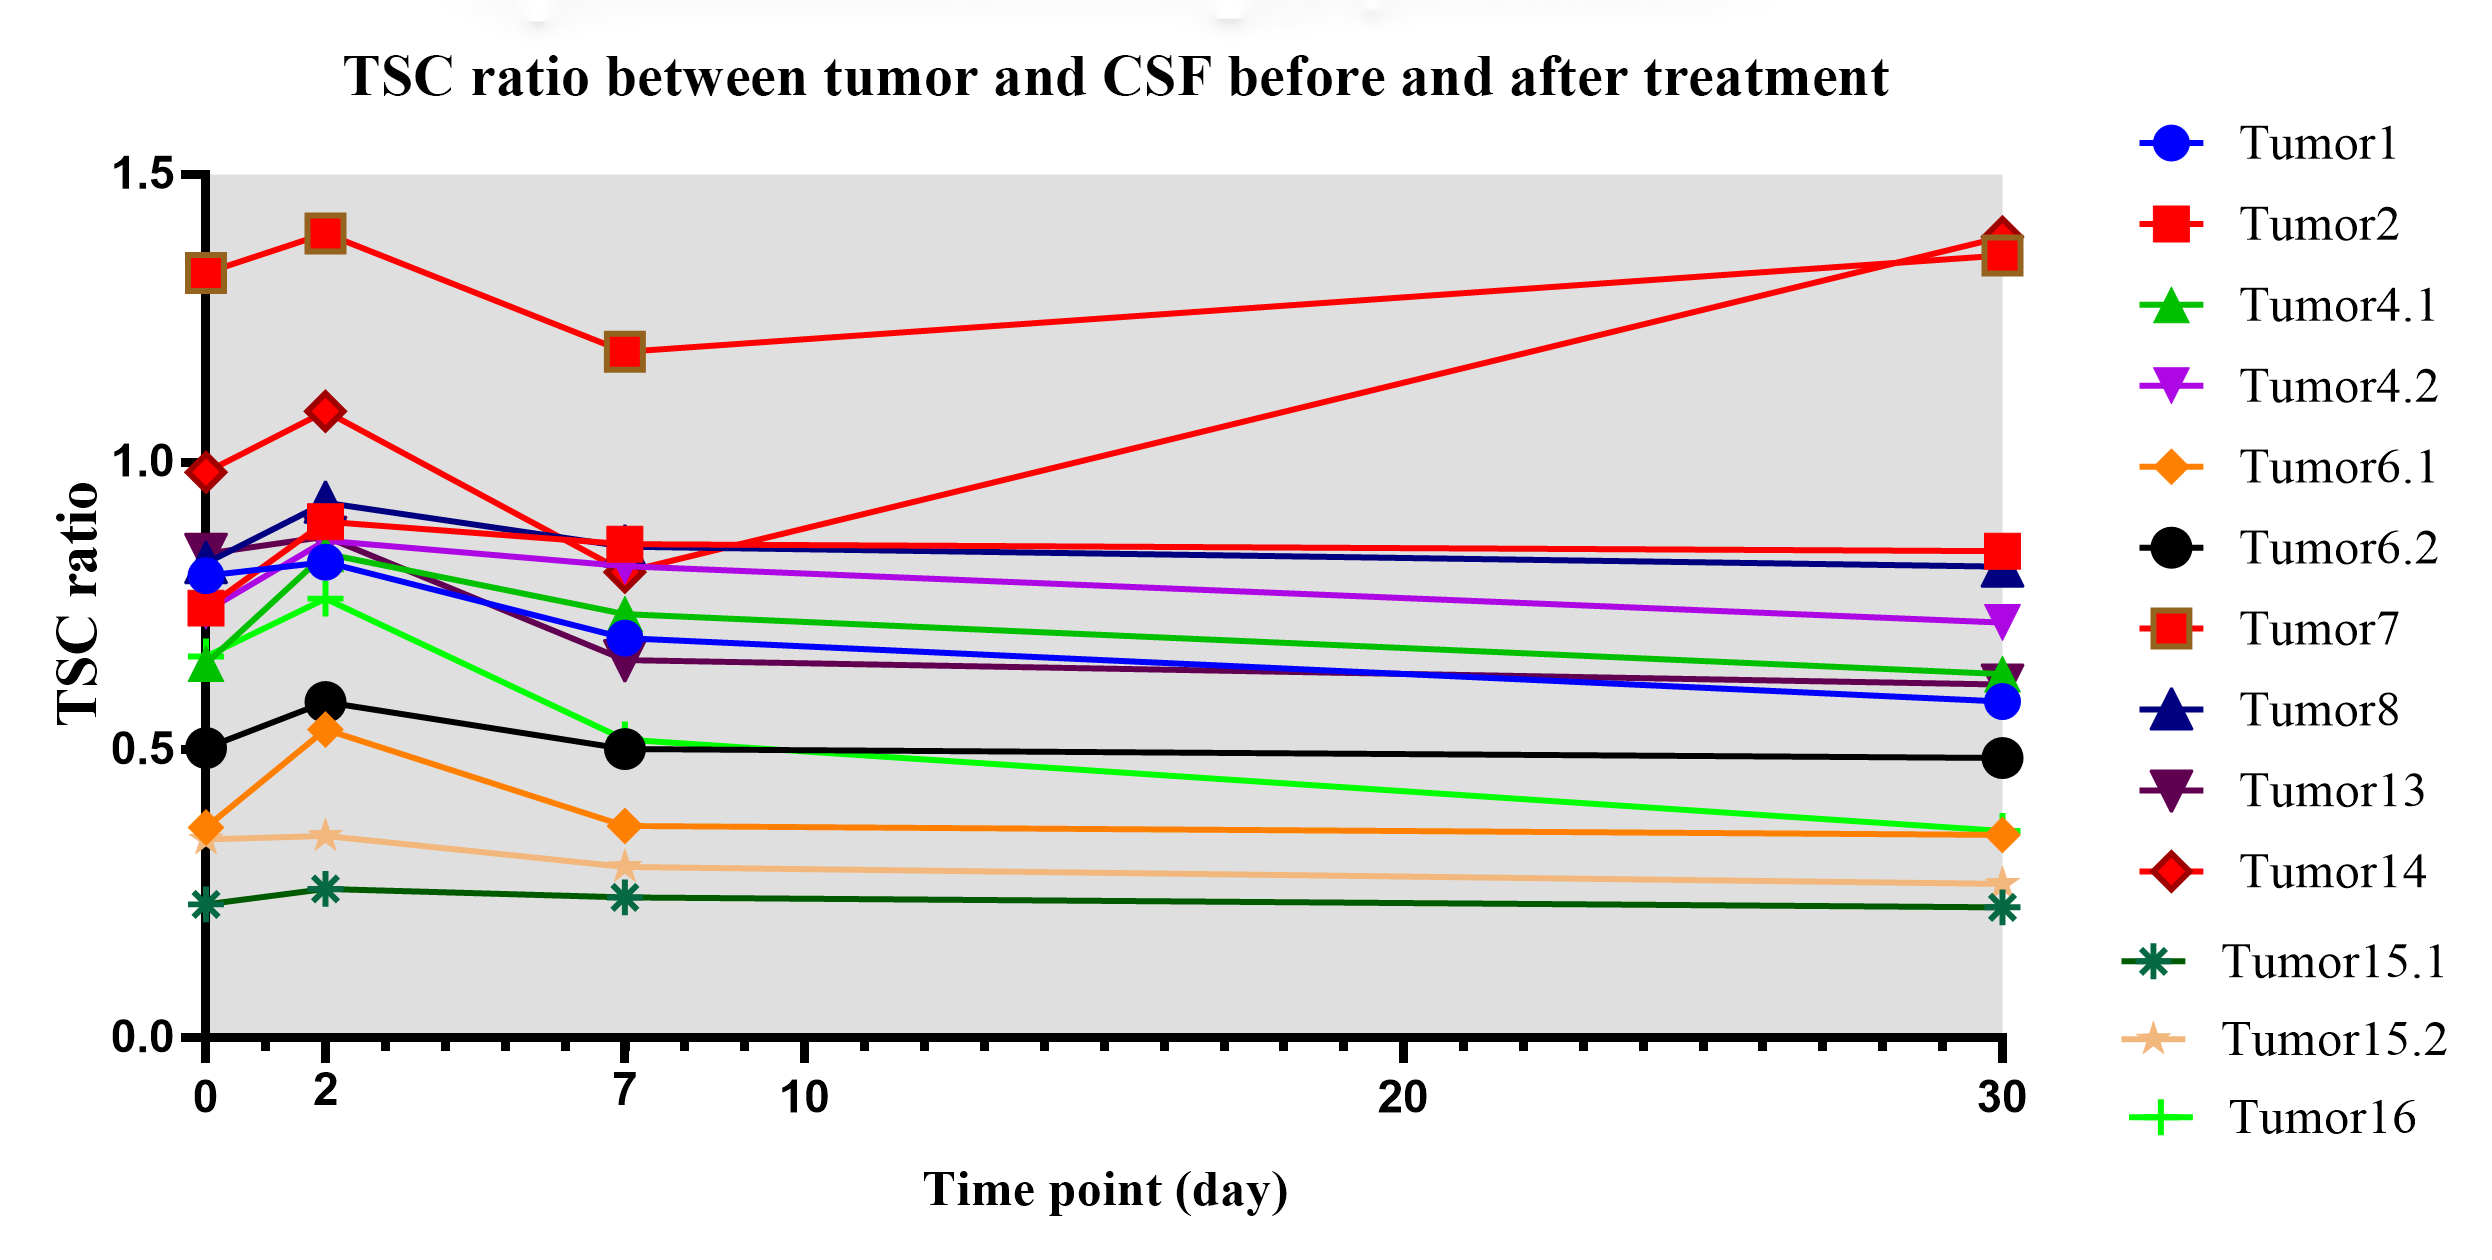
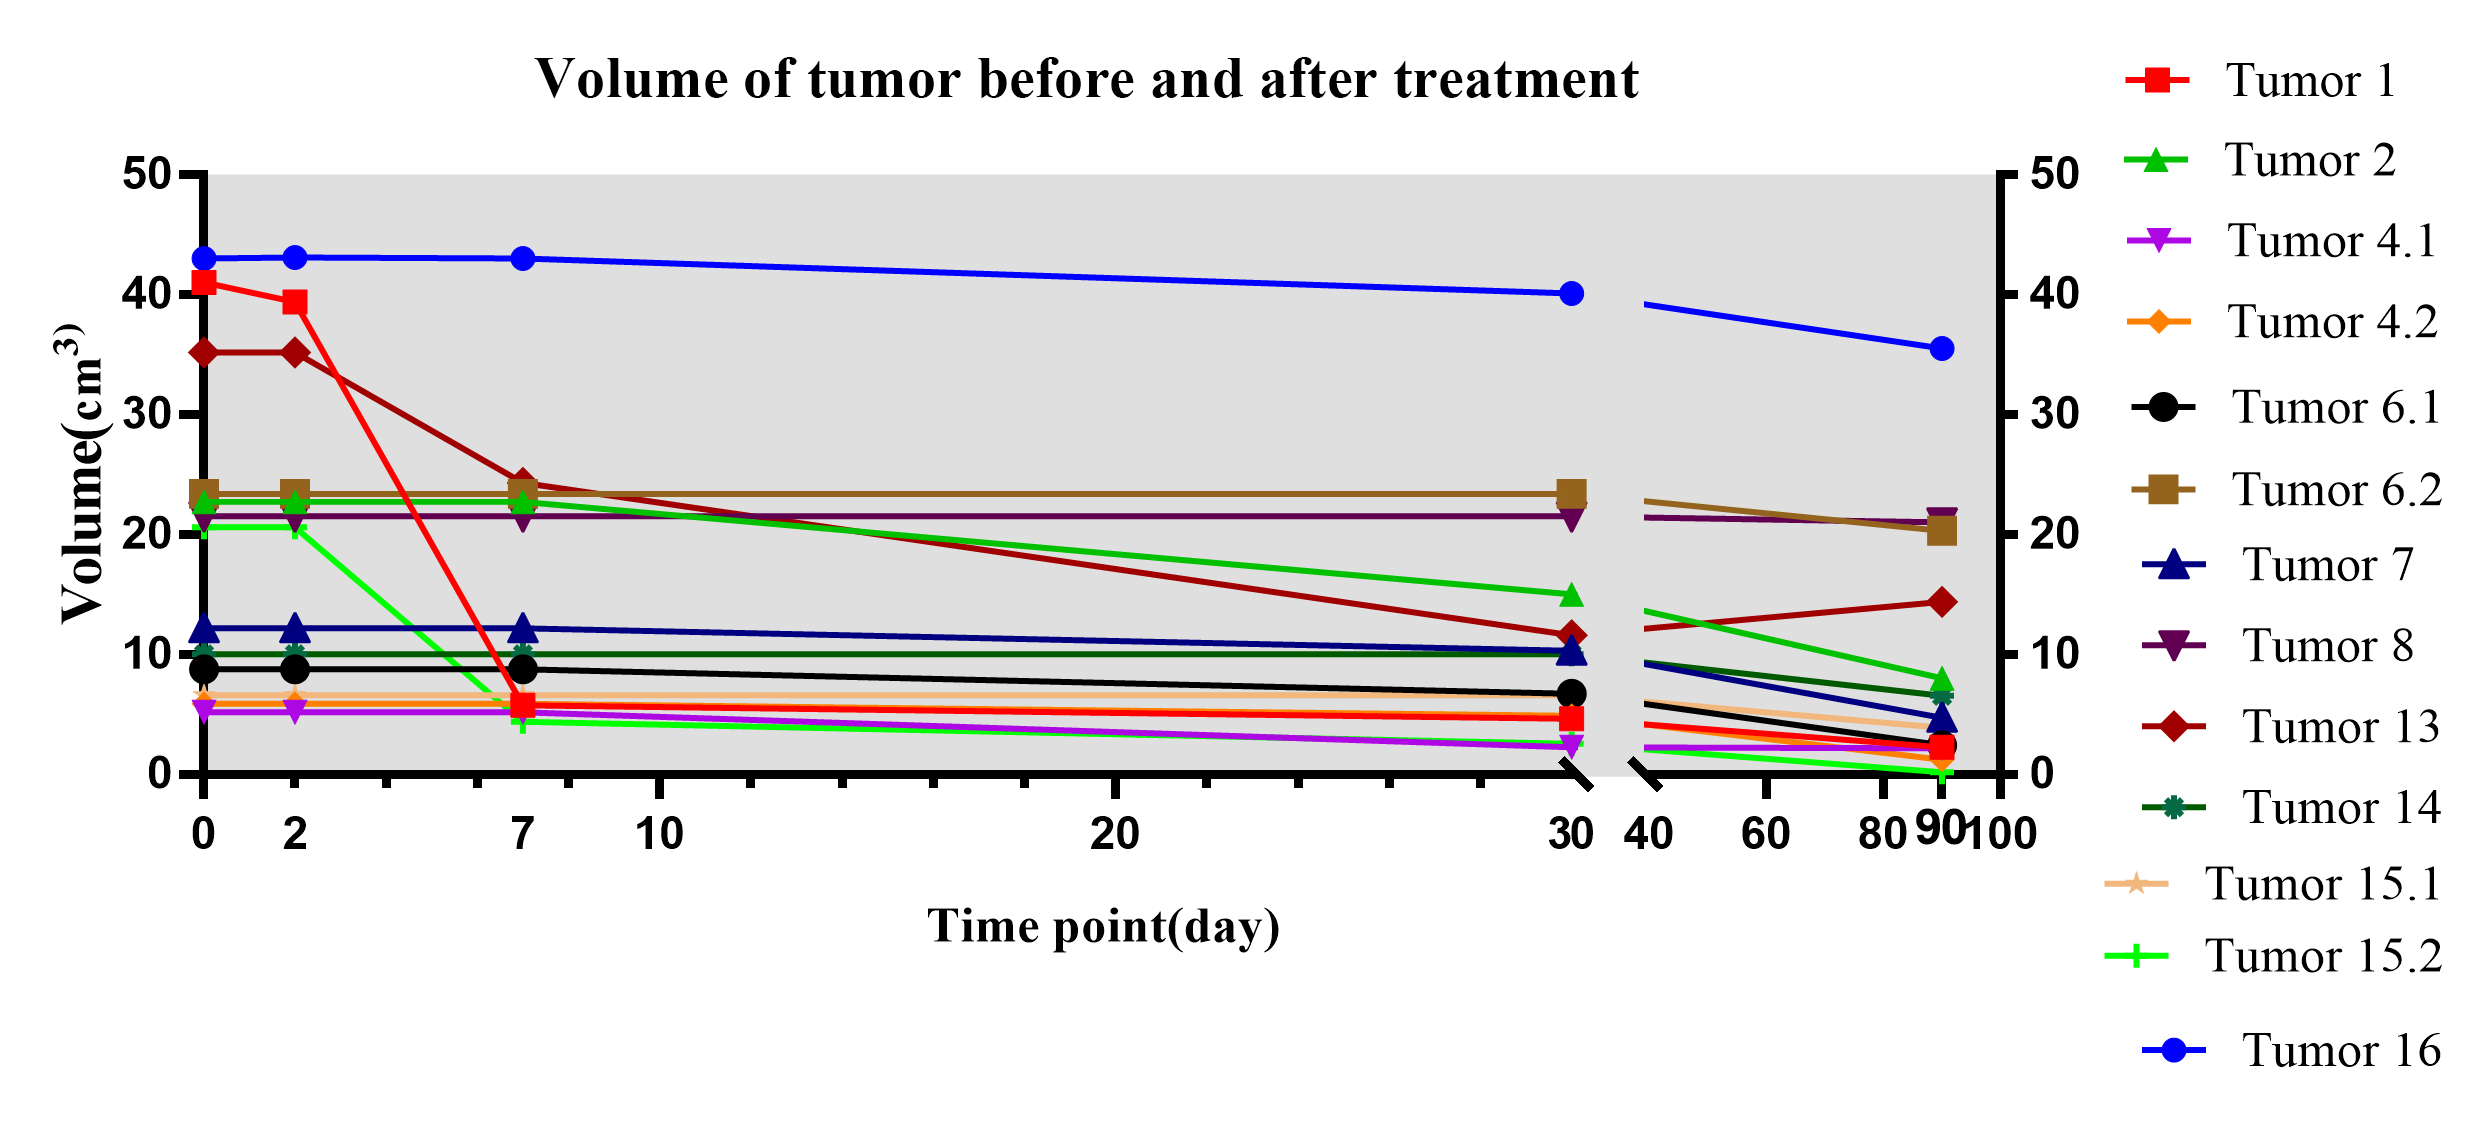
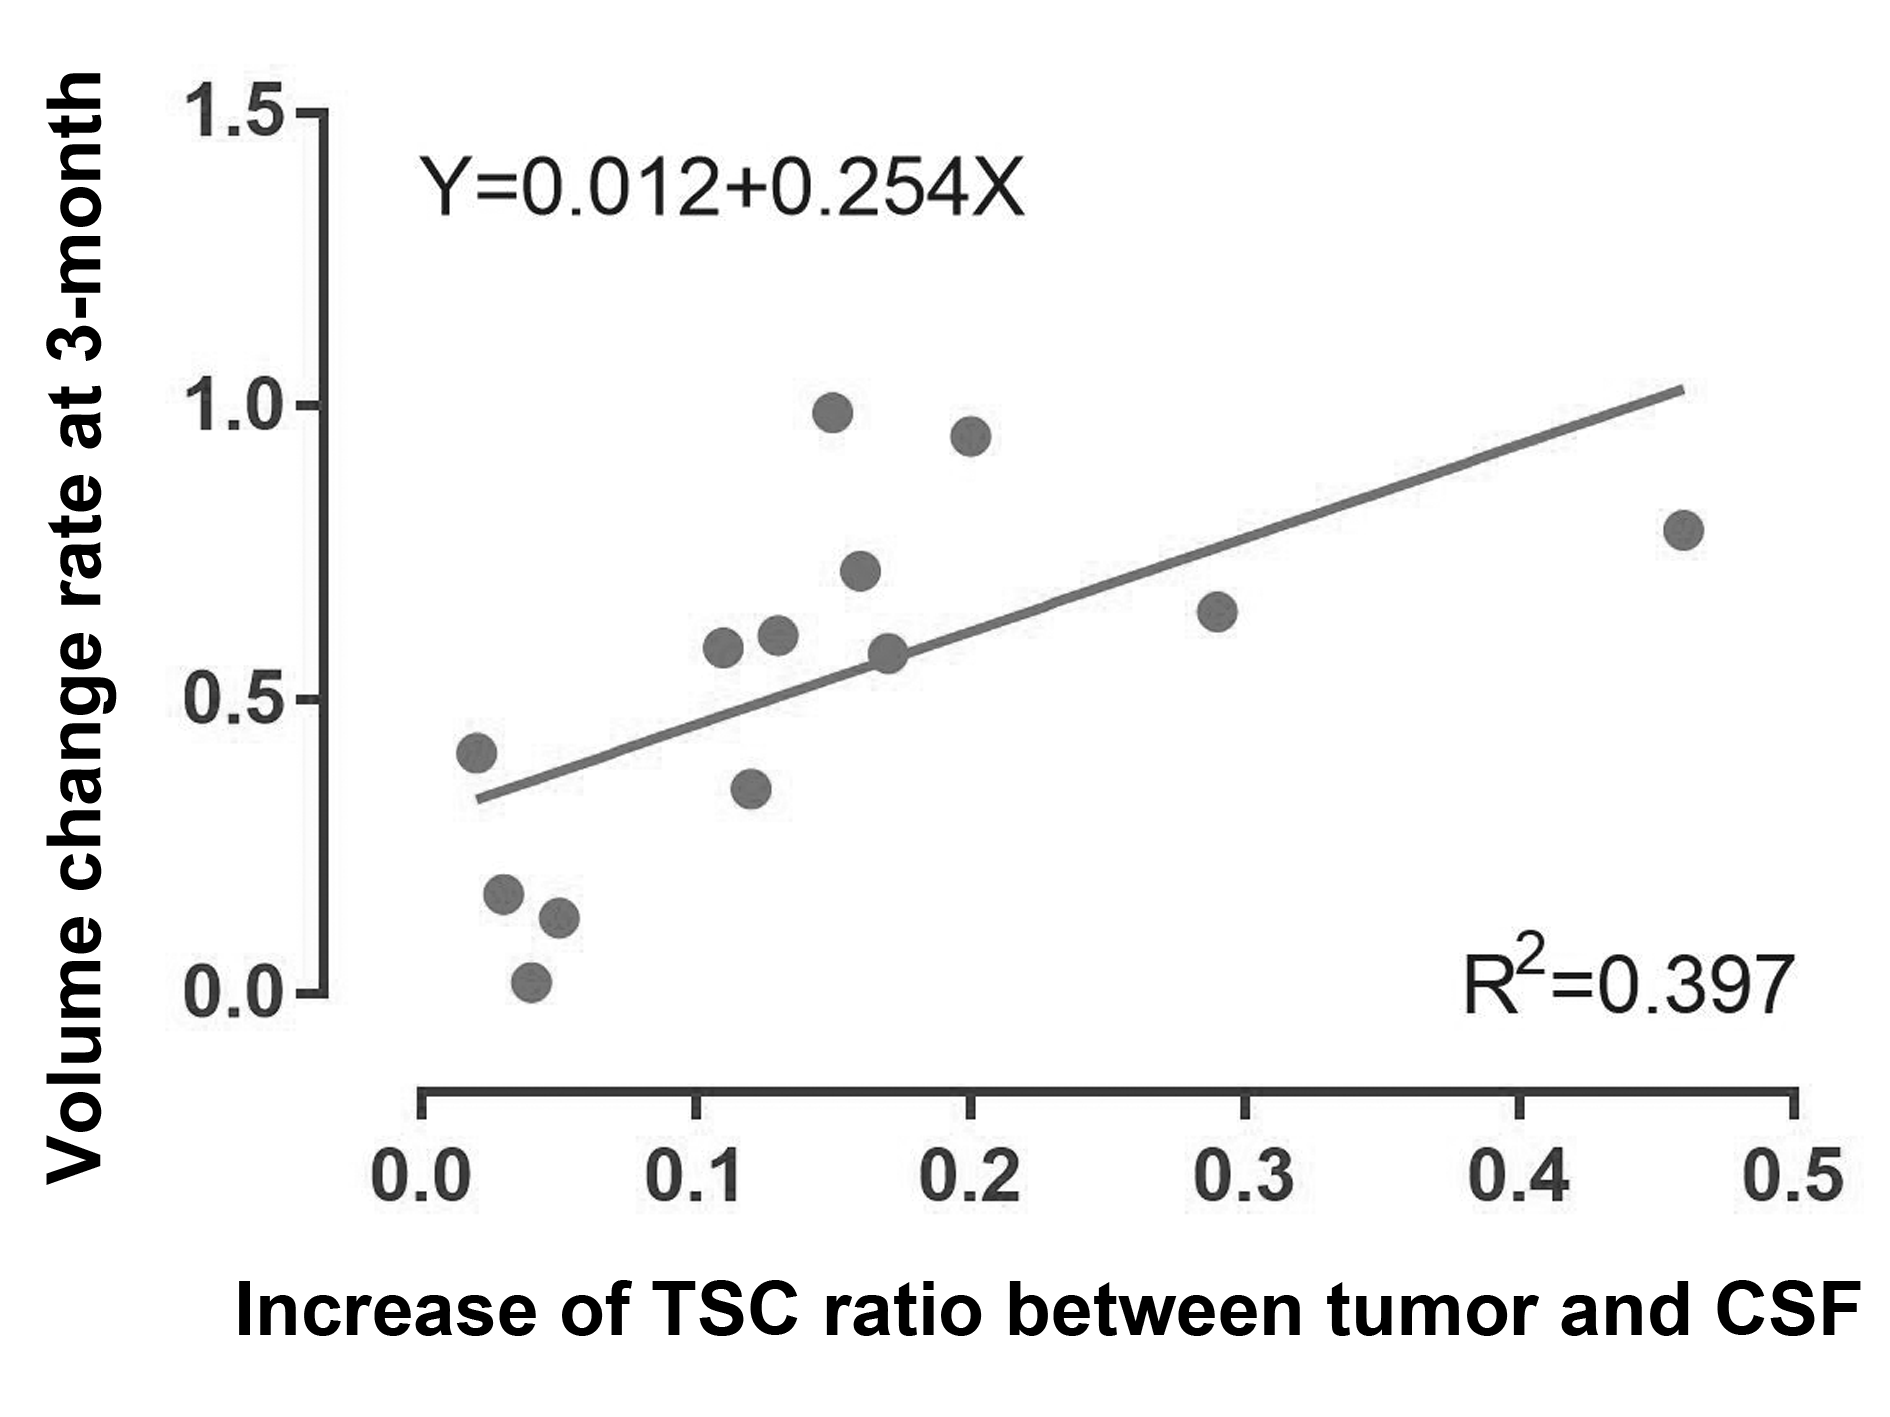
Fig. 1 demonstrated the structural and sodium images of tumor 1, and the ROIs of extracting the TSC values for further analysis. For the 21 tumors before treatment, their sodium images clearly showed that the intratumoral signal is significantly higher than normal tissue, while the edema zones were also displayed as high signal. Using contralateral CSF as references, the TSC ratios of tumors, contralateral normal tissues, and edemas were 0.67±0.32, 0.30±0.08, and 0.58±0.22, respectively. The TSC of the tumors was higher than that of contralateral normal tissues (t=5.934, P<0.001).For the 13 tumors that were scanned after treatment, the TSC and volume changes of the tumors with time were demonstrated in Fig. 2 and Fig. 3, respectively. The mean TSC of the tumors at 48 hours after treatment was 0.09 higher than that before treatment, and began to decrease at 1 week. The TSC ratios of 11 tumors continued to decline after 1 month, but increased in two tumors. Tumor 2 and 7 relapsed at 6 months and 12 months after treatment, respectively. The volumes of tumors decreased to a different extent after treatment. There was a significant correlation between the increase of TSC ratio (X) at 48-hour (completing SRT treatment) and the change rate of volume (Y) at 3-month: Y=0.012+0.254*X (R2=0.397, P=0.021, see Fig. 4).
DISCUSSION
We acquired and analyzed TSC maps at multiple time-points before and after radiotherapy in a group of intracranial tumors. Of the 21 tumors before treatment, TSC was 55% higher than that of the contralateral normal brain tissue. This is similar to the results of previous reports4,8. The unregulated cell division of malignant tumors can cause changes in Na+/K+_ATP exchange kinetics9, resulting in a regional increase in TSC.The TSC maps in multi-timepoints demonstrated the response of tumor tissue to SRT. After SRT, the disruption of Na+/K+_ATP or ATP dependent process leads to the change of ion balance, which performs as the increase of TSC3. The sodium overload at 48-hour after radiotherapy in Fig. 2 reflects the destruction of cell membrane caused by apoptosis. The correlation between increased TSC ratio at 48-hour and the volume change rate at 3-month indicates that quantitative sodium MRI can predict the response of tumor to radiotherapy in early stages. The rapid feedback of TSC can be used to guide adaptive treatment for each patient and avoid excessive radiation when no response can be achieved.
Tumor 7 and 14 showed elevated level of TSC after 1 month and relapsed later. We speculate that the increased TSC at 1-month is related to active recurrence of tumor cells, increased cell division, or proliferation of blood vessels. However, follow-up studies at more time points in a larger population are necessary to confirm our speculation.
CONCLUSION
Quantitative sodium MRI at 7T reflects the change of TSC before and after radiotherapy. TSC maps can predict the response of tumor to SRT in early stages. The reoccurrence of tumor may be detected by the abnormal rise of TSC. The technique provides valuable information for individualized and accurate treatment of intracranial tumors.Acknowledgements
We would like to thank Fernando E. Boada from New York University for providing the twisted projection imaging sequence and tuning the scanning parameters.
This work was supported in part by Young Elite Scientists Sponsorship Program by CAST (2017QNRC001), the Beijing Municipal Natural Science Foundation (7184226, 19G10046), and the grant of Ministry of Science and Technology of China (2017YFC1307904).
References
1. Nagy IZ, Lustyik G, Lukács G, Nagy VZ, Balázs G. Correlation of malignancy with the intracellular Na+: K+ ratio in human thyroid tumors. Cancer research. 1983 Nov 1;43(11):5395-402.
2. Ng KH, Bradley DA, Looi LM. Elevated trace element concentrations in malignant breast tissues. The British journal of radiology. 1997 Apr;70(832):375-82.
3. Boada FE, LaVerde G, Jungreis C, Nemoto E, Tanase C, Hancu I. Loss of cell ion homeostasis and cell viability in the brain: what sodium MRI can tell us. Current topics in developmental biology. 2005 Jan 1;70:77-101.
4. Ouwerkerk R, Bleich KB, Gillen JS, Pomper MG, Bottomley PA. Tissue sodium concentration in human brain tumors as measured with 23Na MR imaging. Radiology. 2003 May;227(2):529-37.
5. Lu A, Atkinson IC, Claiborne TC, Damen FC, Thulborn KR. Quantitative sodium imaging with a flexible twisted projection pulse sequence. Magnetic Resonance in Medicine: An Official Journal of the International Society for Magnetic Resonance in Medicine. 2010 Jun;63(6):1583-93.
6. O'donnell M, Edelstein WA. NMR imaging in the presence of magnetic field inhomogeneities and gradient field nonlinearities. Medical physics. 1985 Jan;12(1):20-6.
7. Fleysher L, Oesingmann N, Brown R, Sodickson DK, Wiggins GC, Inglese M. Noninvasive quantification of intracellular sodium in human brain using ultrahigh–field MRI. NMR in Biomedicine. 2013 Jan;26(1):9-19.
8. Thulborn KR, Lu A, Atkinson IC, Damen F, Villano JL. Quantitative sodium MR imaging and sodium bioscales for the management of brain tumors. Neuroimaging Clinics. 2009 Nov 1;19(4):615-24.
9. Spector M, O'Neal S, Racker E. Phosphorylation of the beta subunit of Na+ K+-ATPase in Ehrlich ascites tumor by a membrane-bound protein kinase. Journal of Biological Chemistry. 1980 Sep 25;255(18):8370-3.
Figures