0273
In vivo fluorine-19 MRI of intracellular oximetry response to chimeric antigen receptor T cell therapy against glioma1Biomedical Engineering, University of Kentucky, Lexington, KY, United States, 2Radiology, University of California San Diego, La Jolla, CA, United States, 3Neurological Surgery, University of California San Francisco, San Francisco, CA, United States
Synopsis
We explore the temporal dynamics of tumor and T cell intracellular partial pressure of oxygen (pO2) in a murine flank glioma model receiving chimeric antigen receptor (CAR) T cell therapy. Tumor cells or T cells are intracellularly labeled with perfluorocarbon nanoemulsion prior to injection. 19F MRI relaxation rate measurements are used to elucidate intracellular pO2 in vivo. The tumor pO2 peaks at 3 days post-infusion, commensurate with CAR T cell infiltration and tumor cell killing. Moreover, the absolute 19F signal scales with tumor burden. Overall, 19F pO2 MRI measurements can assay cell-mediated apoptosis and provide insight into effector cell function.
Introduction
Tumor hypoxia is associated with increased tumor angiogenesis, recurrence, and malignant progression1. T cell oxygen consumption rate is expected to increase upon binding to its specific antigen, initiating a killing cascade2. Hypothetically, T cell exhaustion3,4 may also be revealed via longitudinal observation of pO2 dynamics in tumor mass cells. We tested the hypothesis that a measurable change in tumor and/or T cell pO2 is commensurate with CAR T cell apoptotic processes in a xenograft mouse model of sub-cutaneous glioblastoma targeted with CAR T cells. Perfluoro-crown-ether (PFC) nanoemulsion dissolves oxygen, resulting in a linear increase in the 19F spin-lattice relaxation rate (R1) with increasing pO2. Using in vivo 19F MRI and MRS, we measured the pO2 time-course in flank glioma cells that were intracellularly labeled with PFC nanoemulsion and treated with intravenously-infused CAR T cells, untransduced T cells, or vehicle. Additionally, intracellular T cell pO2 was monitored in xenograft mice receiving PFC-labeled CAR T cells or untransduced T cells intratumorally. Quantitative immunohistopathology supported our findings.Methods
Human T cells were transduced with a CAR lentiviral vector to express a surface antibody against EGFRvIII, a common receptor in glioblastoma multiforme5. U87 glioma cells expressing EGFRvIII and luciferase (U87-EGFRvIII-Luc), or alternatively, CAR T and untransduced T cells, were labeled ex vivo with PFC nanoemulsion6 overnight in conventional medium followed by wash. In the first cohort, female SCID mice (N=15) received unilateral sub-cutaneous injections of 5×10⁶ PFC-labeled U87-EGFRvIII-Luc cells. All mice were subjected to MRI and bioluminescence imaging (BLI) four days post tumor implantation, then received intravenous cell treatments (day 0). Groups 1-3 (N=5 per group) received 20×106 CAR T cells, 20×106 untransduced T cells, and no T cells, respectively. In a second cohort, the same strain (N=12) received subcutaneous unilateral flank injections of 5×10⁶ unlabeled glioma cells. Groups 4-5 (N=6 per group) received 1×10⁷ PFC-labeled CAR T cells injected intratumorally (IT) or PFC-labeled untransduced T cells IT in PBS, respectively. Longitudinal MRI and BLI scans were acquired using a Bruker 11.7T BioSpec and an IVIS Spectrum, respectively, on days 1, 3, 7, and 10. Proton images were acquired using RARE (TR/TE=2000/14 ms, RARE factor 2, NA=2, FOV=32×24 mm2, matrix = 256×184). Co-registered 19F images were acquired with RARE (TR/TE=2000/13 ms, RARE factor 4, NA=32, FOV=32×24 mm2, matrix = 64×46). The 19F R1 was measured over the entire tumor volume using saturation-recovery PRESS (15 TR values, 0.1-6 s, single exponential recovery fit) to yield pO2 values, calculated with a calibration curve8. At the experimental endpoint, tumors and spleens were harvested and fixed for histology to qualitatively assess (CAR) T cell homing and tumor cell apoptosis.Results
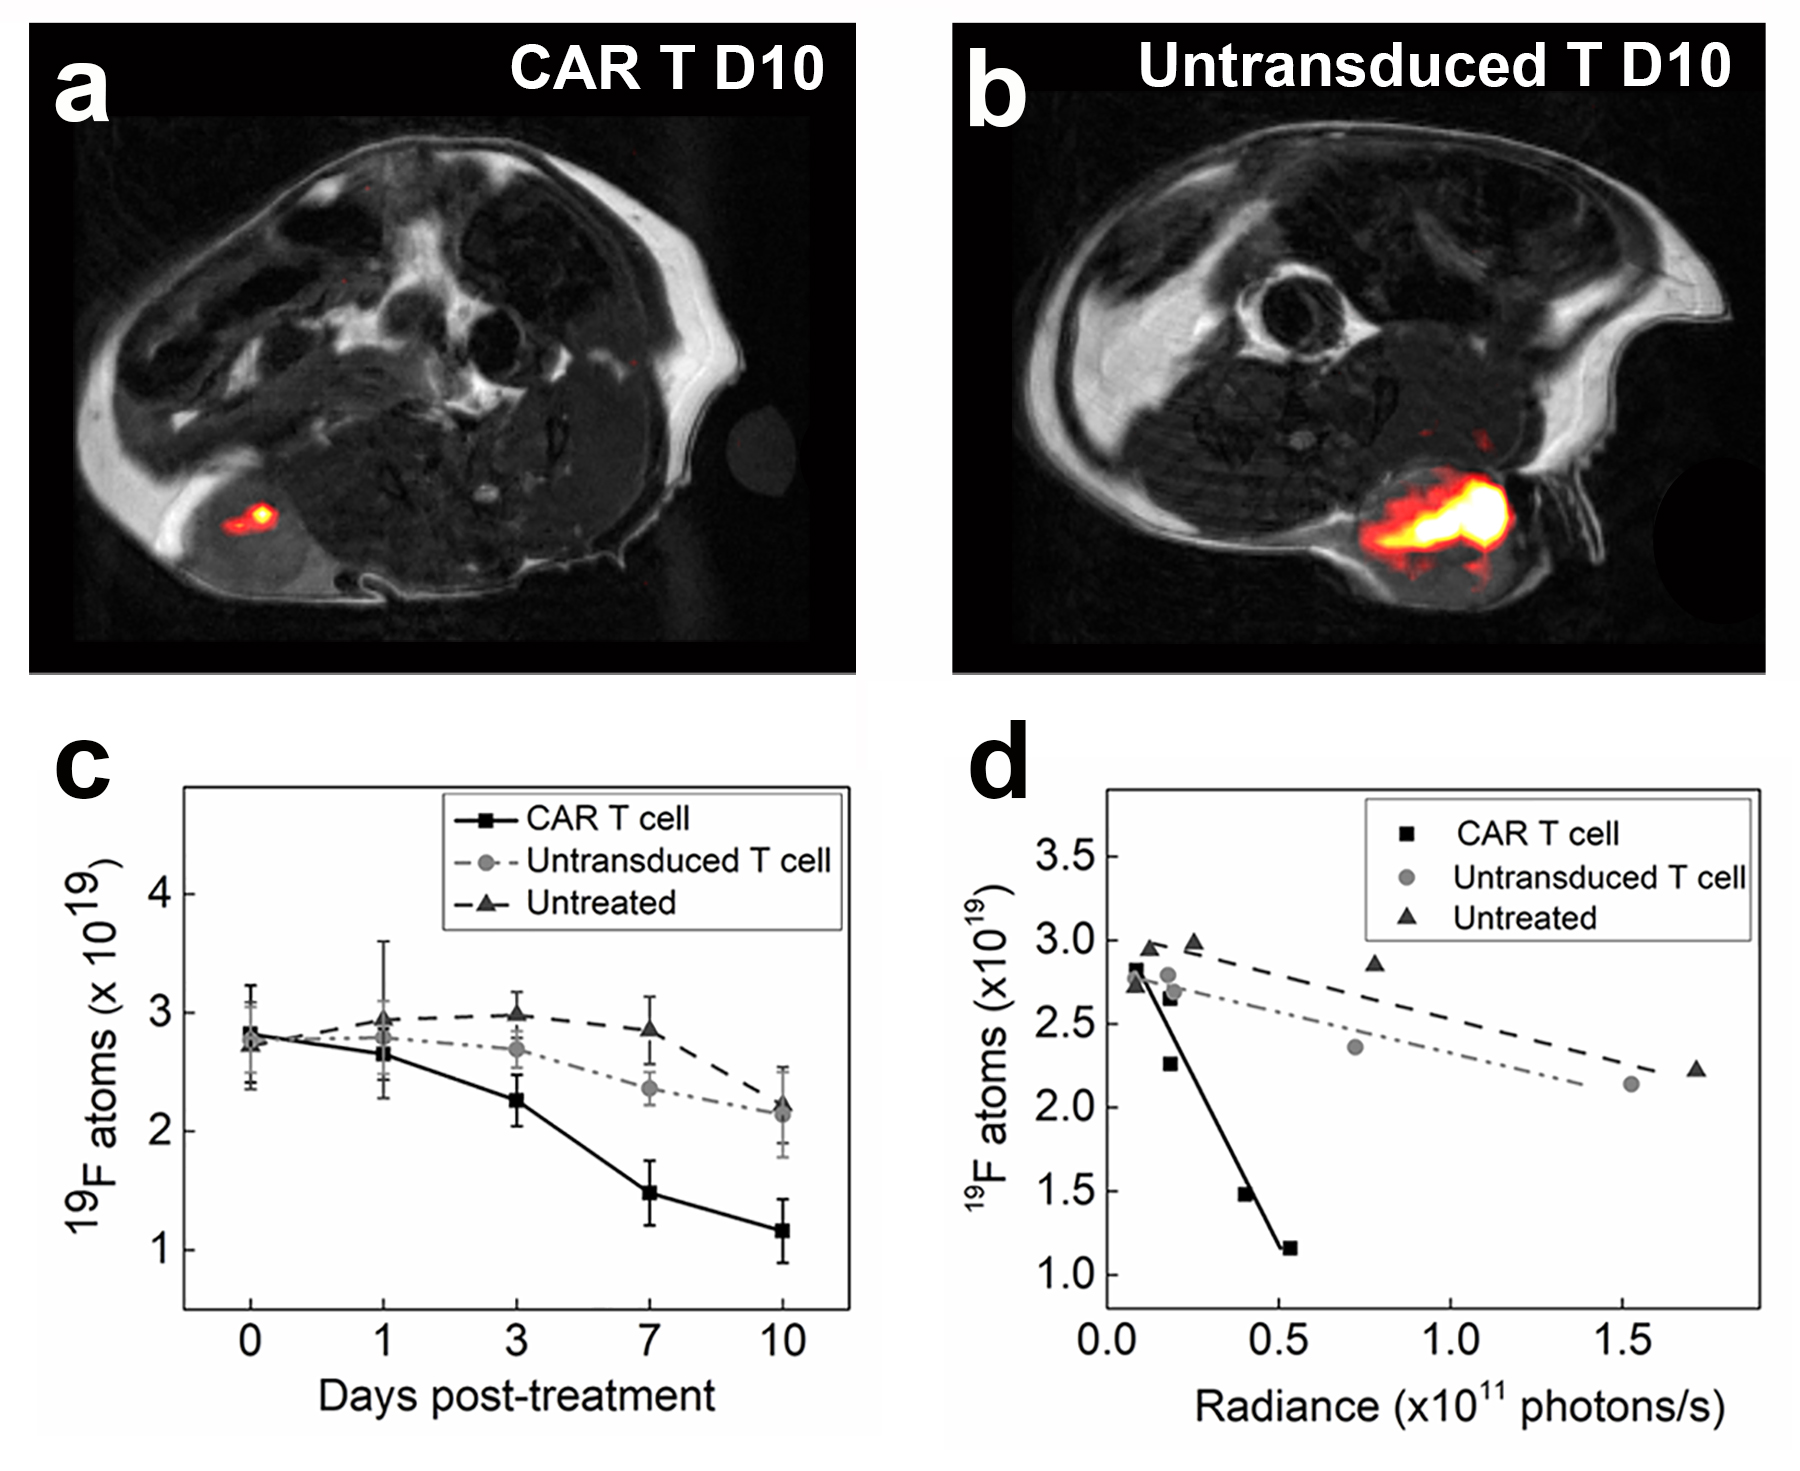
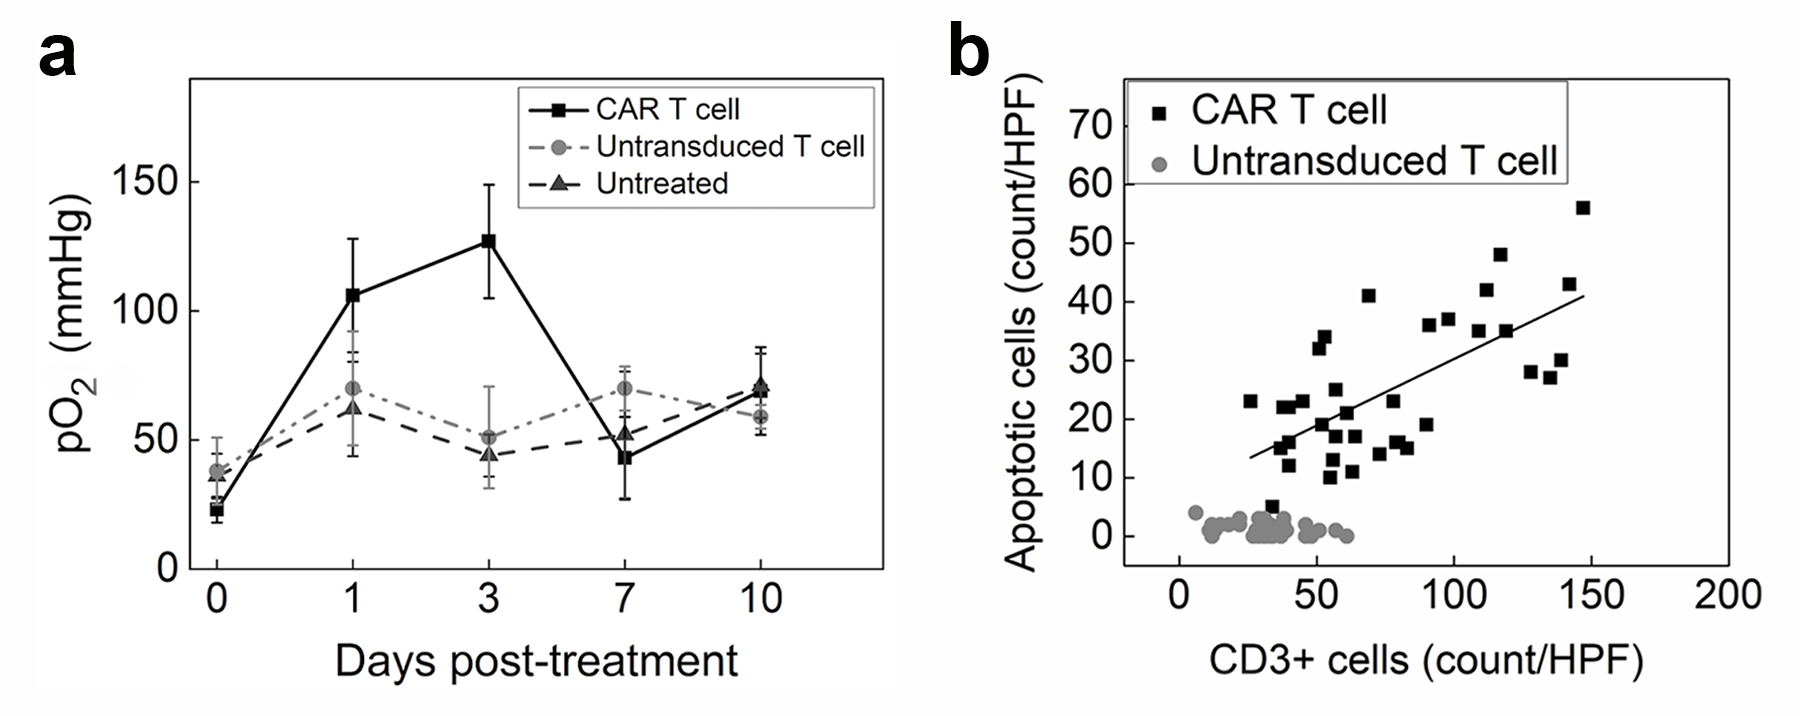
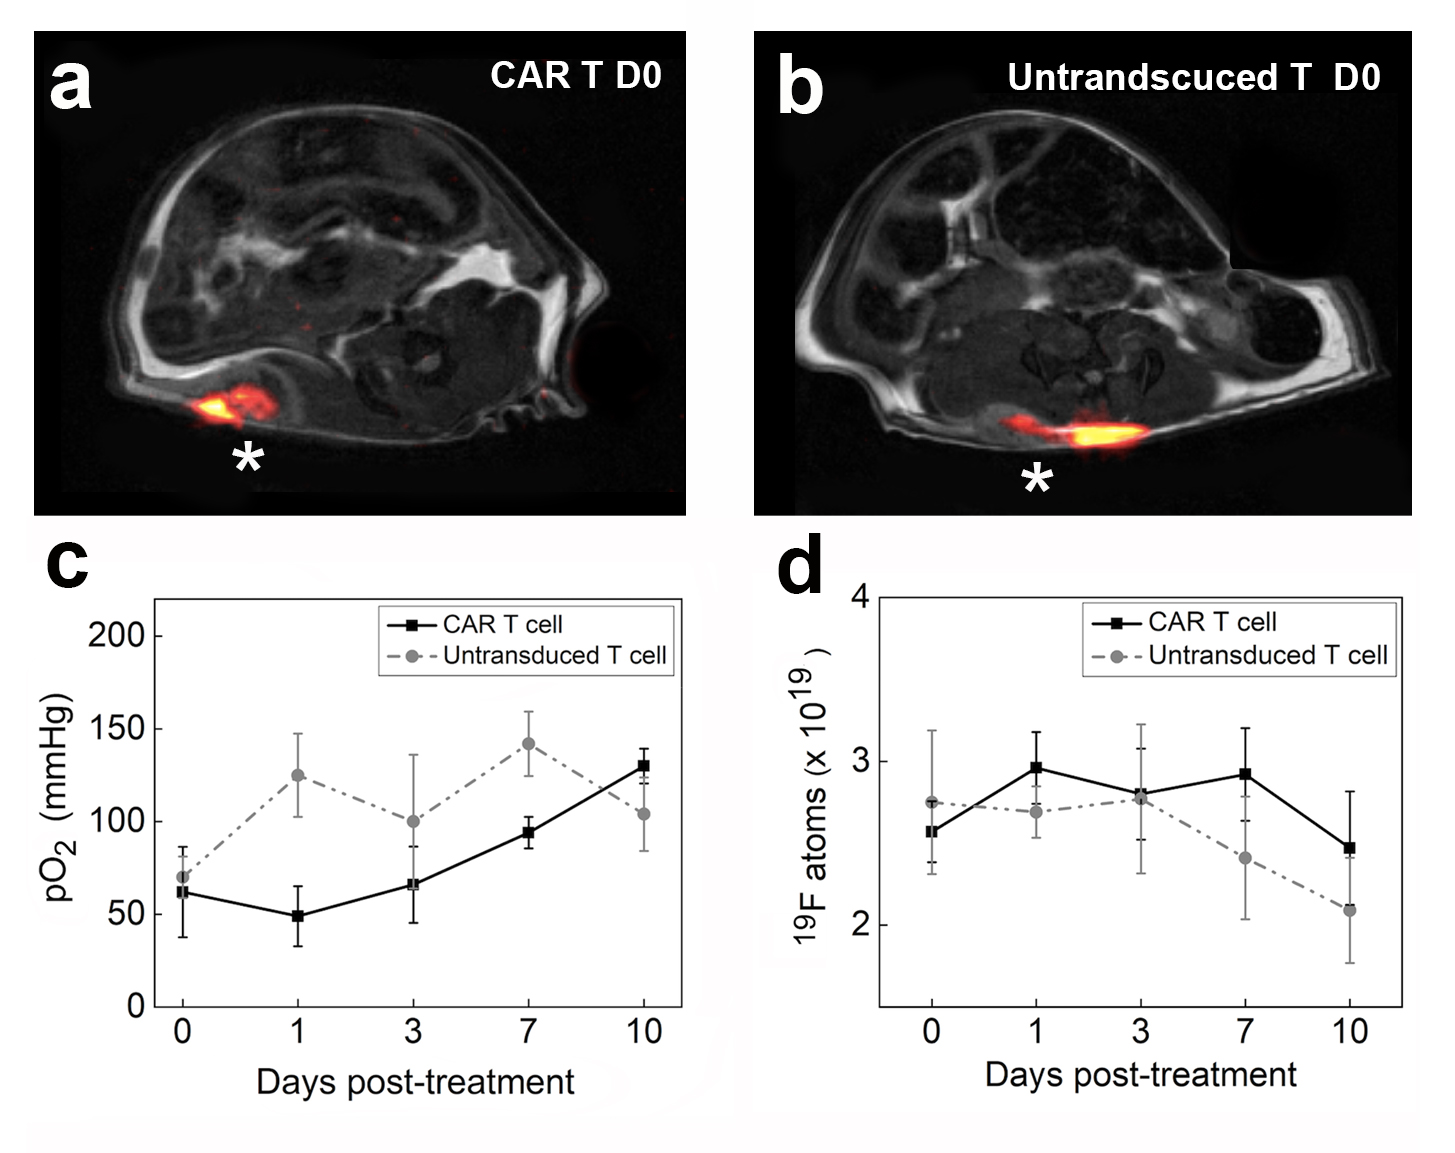
In the first cohort, we investigate the impact of CAR T cell therapy on PFC-labeled U87-EGFRvIII-Luc tumors via 19F MRI/MRS. Clearance of PFC signal is visualized in longitudinal MR images of CAR T cell treated but not in untransduced T cell treated tumors (Fig. 1a-b). The 19F content in the two control groups shows no significant change over 10 days, whereas the CAR T cell treated tumors exhibit ~ 60% signal loss (p=0.0012, Fig. 1c). Longitudinal BLI show significant tumor burden reduction 7 days post CAR T cell treatment compared to control groups (p=0.012). There is a strong negative correlation between absolute tumor 19F content and radiance in all groups (Pearson’s R: -0.85<R<-0.98, Fig. 1d). The 19F signal may thus function as a therapeutic marker in preclinical models. A transient spike is observed in tumor pO2 three days after CAR T cell infusion (pO2=134±25 mmHg, Fig 2a) which is not observed for untransduced T cells (pO2=61±20 mmHg) or control (pO2=40±9 mmHg, p = 0.026, Fig. 2a). At day 3, histopathology shows a correlation between CAR T cell numbers in the tumor and cancer cell apoptosis, whereas untransduced T cells did not generate significant apoptosis (Fig. 2b). These data suggest specific CAR T cell homing to the tumor tissue, presumably initiating target killing cascade that transiently alters intracellular pO2. By day 7, tumor oxygenation returns to baseline in the CAR T cell group (Fig. 2a).In the second cohort, we label CAR T cells overnight with PFC nanoemulsion without significant viability impairment. Following intratumoral delivery of CAR and untransduced T cells (Fig. 3a-b), pO2 does not change significantly upon contact with tumor cells over 10 days (Fig. 3c). When injected intratumorally, CAR T cells remain cytotoxic towards cancer cells compared to untransduced T cells, as evidenced by significantly lower tumor BLI radiance as early as Day 7 post-injection (p = 0.0012). Absolute fluorine content of locally injected T cells in Groups 4&5 does not change significantly over 10 days (p=0.7889 and p=0.2566, respectively, Fig. 3d).
Conclusions
Overall, we show that 19F MRI enables temporal measurements of tumor cell oxygen tension in response to CAR T cell therapy and that the absolute 19F signal scales with tumor burden. These data support the view that 19F pO2 MRI and MRS can serve as real-time biomarkers for cell-mediated apoptosis and yields insights into the modes of action of engineered T cell immunotherapy against cancer.Acknowledgements
This study was funded through NIH (R01-EB017271, R01-EB024015 and R01-CA139579) and the California Institute for Regenerative Medicine (LA1-C12-06919).References
1 Tatum, J. L. et al. Hypoxia: importance in tumor biology, noninvasive measurement by imaging, and value of its measurement in the management of cancer therapy. Int J Radiat Biol 82, 699-757, (2006).
2 Kawalekar, O. U. et al. Distinct Signaling of Coreceptors Regulates Specific Metabolism Pathways and Impacts Memory Development in CAR T Cells. Immunity 44, 712, (2016).
3 Thommen, D. S. & Schumacher, T. N. T Cell Dysfunction in Cancer. Cancer Cell 33, 547-562, (2018). 4 Miller, B. C. et al. Subsets of exhausted CD8(+) T cells differentially mediate tumor control and respond to checkpoint blockade. Nat Immunol 20, 326-336, (2019).
5 Ohno, M. et al. Expression of miR-17-92 enhances anti-tumor activity of T-cells transduced with the anti-EGFRvIII chimeric antigen receptor in mice bearing human GBM xenografts. J Immunother Cancer 1, 21, (2013).
6 Kadayakkara, D. K. et al. In vivo observation of intracellular oximetry in perfluorocarbon-labeled glioma cells and chemotherapeutic response in the CNS using fluorine-19 MRI. Magnetic resonance in medicine 64, 1252-1259, (2010).
7 Srinivas, M. et al. Fluorine-19 MRI for visualization and quantification of cell migration in a diabetes model. Magnetic resonance in medicine 58, 725-734, (2007).
8 Zhong, J. et al. In vivo intracellular oxygen dynamics in murine brain glioma and immunotherapeutic response of cytotoxic T cells observed by fluorine-19 magnetic resonance imaging. PLoS One 8, e59479, (2013).
Figures