0272
Mapping of exogenous choline uptake in brain tumors in vivo using Deuterium Metabolic Imaging (DMI)1Dept. of Radiology and Biomedical Imaging, Yale University, New Haven, CT, United States, 2Dept. of Psychiatry, Yale University, New Haven, CT, United States
Synopsis
A high level of intracellular choline is an established marker of malignancy in brain tumors. Here we investigate the uptake of exogenous choline in vitro using high resolution 1H NMR into rodent glioblastoma cell lines. To map bloodborne uptake in vivo, we used the novel technique Deuterium Metabolic Imaging (DMI), combined with intravenous infusion of [2H9]-choline in two orthotopic rat (RG2) and mouse (GL261) models of glioblastoma. DMI-based metabolic maps revealed high uptake of choline in the tumors, in a stark image contrast with normal-appearing brain, illustrating the potential of [2H9]-choline chloride as metabolic imaging agent.
Introduction
Aberrant choline metabolism is a hallmark of cancer that is currently being explored as a potential molecular target for drug therapy (1,2). In many human cancers, overexpression of enzymes involved in choline metabolism and elevated levels of choline-containing metabolites have been detected (3). In neuro-oncology 1H MRS(I) has been used for many years to measure the combined pool of endogenous choline and its metabolites, phosphocholine and glycerophosphocholine (4,5). More recently PET imaging approaches aimed at mapping the uptake of exogenous 18F-labeled methylcholine have been explored in glioma as well (6,7). Here, we use 1H MRS methods in vitro in glioma cell lines, and explore the capability of the novel metabolic imaging method, deuterium metabolic imaging (DMI), to measure uptake of exogenous 2H-labeled choline in orthotopic rodent models of glioma (8).Methods
In vitro experiments.RG2 (ATCC) and GL261 glioma cells (NCI) were grown in T75 flasks using Dulbecco’s modified Eagle’s medium (DMEM) and standard cell culture conditions. For in vitro choline uptake experiments cells were incubated with medium containing 1 mM unlabeled choline (Millipore). The incubation medium was sampled at periodic intervals, and after 120 mins the cells were harvested and metabolites were extracted. Highresolution NMR scans were performed on a 500MHz Bruker Avance MR spectrometer (Bruker Instruments, Billerica, MA) using a 5mm probesoptimized for 1H NMR. All high-resolution NMR data were processed in NMRWizard, a home-written graphical user interface (GUI) in MATLAB (MathWorks, Natick, MA). Intracellular choline, phosphocholine and glycerophosphocholine levels were measured by peak integration and normalized to the creatine level.
Animal experiments.
Glioma-bearing rats and mice were generated by intracerebral injection of RG2 cells (10,000 cells) in Fischer344 rats (n=3), and GL261 cells (100,000 cells) in B6(Cg)-Tyrc-2J/J mice (albino C57Bl/6J mice, n=3), as described previously (9). Animal studies were performed on an 11.74 T Magnex magnet (Magnex Scientific Ltd.) interfaced to a Bruker Avance III HD spectrometer running on ParaVision 6 (Bruker Instruments), as previously described (8). Glioma-bearing rodents were infused intravenously for ~80 min with [2H9]-choline chloride (Cambridge Isotopes Laboratories, Cambridge, MA) dissolved in water (400 mM), using a bolus-continuous infusion protocol (total amount of 2H9]-choline: 200 mg/kg). DMI acquisition was started ~40 min after the start of the infusion. DMI acquisition for rats was similar as described previously, except for the use of a 20x15mm2 2H surface coil, and 2.5x2.5x2.5mm3 spatial resolution for DMI (8). For DMI of mouse brain, a 14x12mm2 arched surface coil was used, combined with a 20 mm diameter surface 1H coil. Spatial resolution of mouse brain DMI was 2x2x2mm3. All 1H MRI and 2H DMI data were processed in DMIWizard, a DMI-soecific GUI written in Matlab.
Results
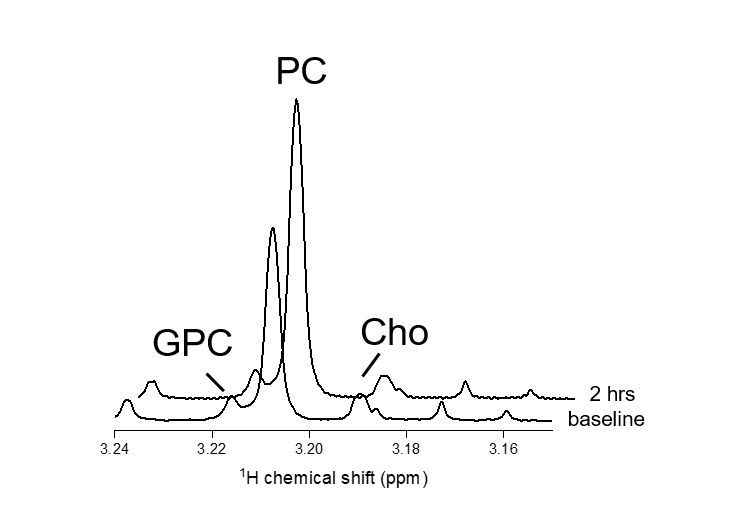
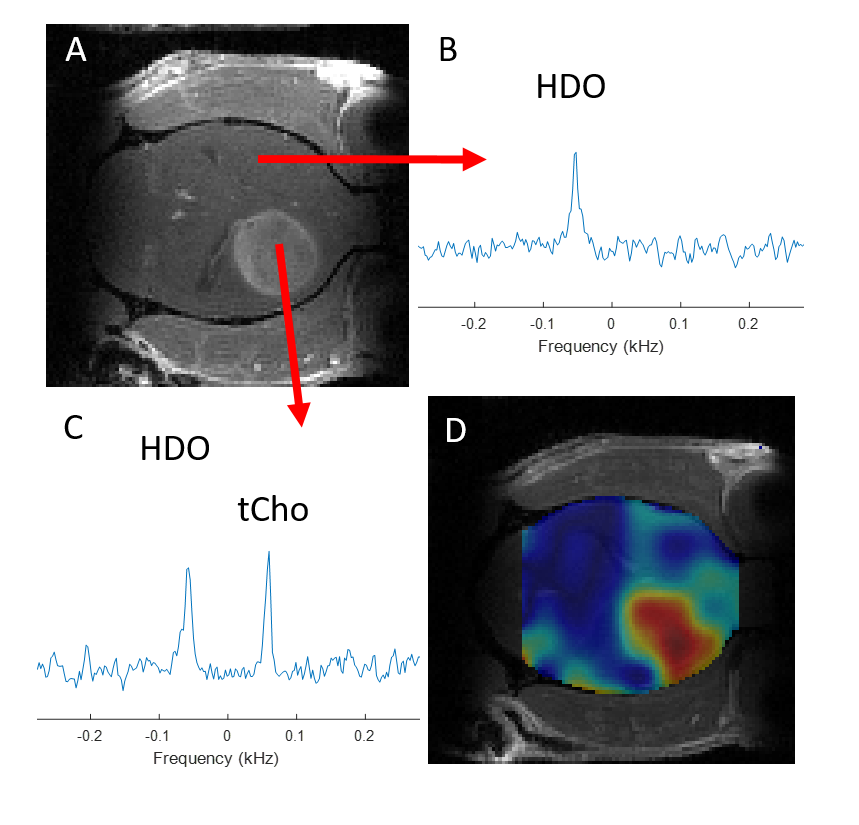
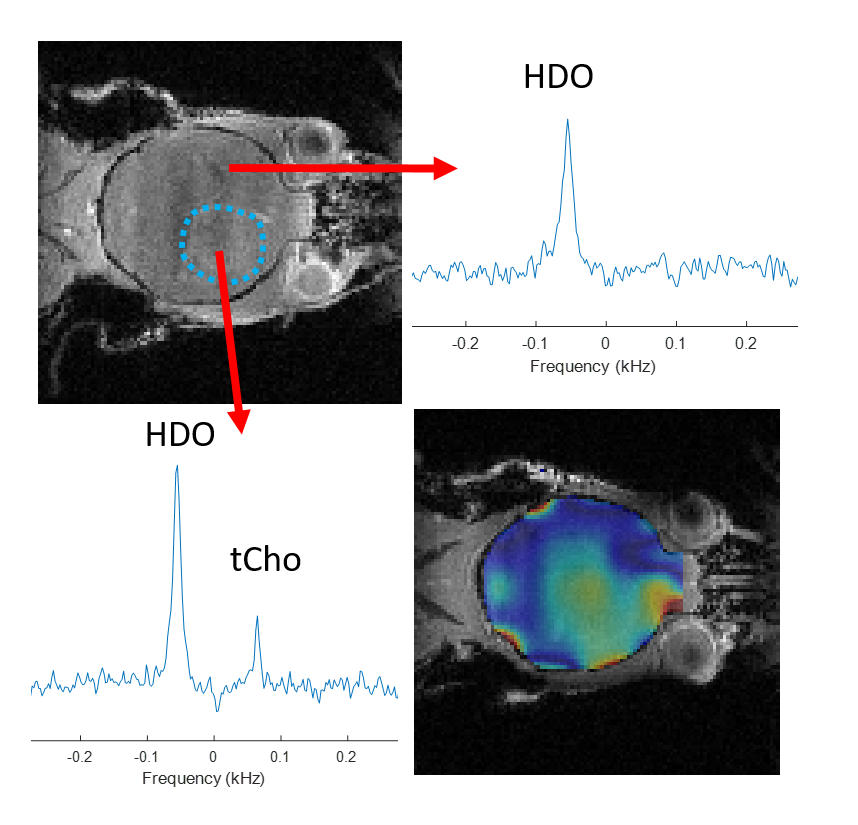
Figure 1 shows 1H NMR spectra from RG2 cell metabolite extracts, and peaks of choline, phosphocholine and glycerophosphocholine at 3.189, 3.207 and 3.216 ppm, respectively, before and after 2 hrs of incubation with 1 mM choline. In vitro choline incubation experiments indicated rapid choline uptake and phosphorylation to phosphocholine in both RG2 and GL261 cell lines (Fig. 2). DMI data acquired during [2H9]-choline infusion showed significant uptake of 2H-labeled choline in the tumor region. In contrast, normal-appearing brain did not seem to take up choline to a level detectable with in vivo DMI (Fig. 2), leading to a clear image contrast on DMI-based maps of choline/water in both rat RG2 and mouse GL261 glioma models (Fig.3 and 4). Note that,similar to 1H MRS(I), the spectral resolution of 2H MRSI in vivo does not allow to separate the different choline species.Discussion
Using DMI in vivo combined with intravenous administration of [2H9]-choline we showed clear tumor uptake of bloodborne choline in two rodent models of glioma. Based on the in vitro experiments we speculate that the choline signal observed with DMI in vivo represents a mix of free choline, phosphocholine and glycerophosphocholine, with phosphocholine being the dominant peak. High resolution NMR of extracted tumor tissue is required to test this hypothesis. The increased levels of [2H9]-choline in both brain tumors could indicate an increased transport capacity for choline, and are consistent with PET imaging of 18F-labeled methylcholine in patients with glioblastoma (6). Recent studies in cell and rodent models of gliomas harboring well-described mutations in the IDH1 gene indicate a reduction in the synthesis and levels of several choline metabolites (10–12). Whether the uptake of choline is also influenced by the presence of mutations in IDH1 remains to be established. Given that DMI is relatively easy to implement for use in human subjects, and the fact that choline can be administered in humans through intravenous infusion or oral intake, DMI of [2H9]-choline could potentially be used in a clinical setting (13,14).Conclusion
DMI combined with infusion of [2H9]-choline chloride showed striking image contrast between tumor and normal-appearing brain in both rat and mouse models of glioblastoma. These results highlight the potential of [2H9]-choline as a glioma-specific metabolic imaging probe.Acknowledgements
This research was supported by NIH grant R01- EB025840.References
1. Rodríguez-González A, Molina AR de, Fernández F, et al. Inhibition of choline kinase as a specific cytotoxic strategy in oncogene-transformed cells. Oncogene 2003;22:8803–8812 doi: 10.1038/sj.onc.1207062.
2. Kumar M, Arlauckas SP, Saksena S, et al. Magnetic Resonance Spectroscopy for Detection of Choline Kinase Inhibition in the Treatment of Brain Tumors. Mol. Cancer Ther. 2015;14:899–908 doi: 10.1158/1535-7163.MCT-14-0775.
3. Glunde K, Bhujwalla ZM, Ronen SM. Choline metabolism in malignant transformation. Nat. Rev. Cancer 2011;11:835–848 doi: 10.1038/nrc3162.
4. Nelson SJ, Kadambi AK, Park I, et al. Association of early changes in 1H MRSI parameters with survival for patients with newly diagnosed glioblastoma receiving a multimodality treatment regimen. Neuro-Oncol. 2016:now159 doi: 10.1093/neuonc/now159.
5. Li Y, Lafontaine M, Chang S, Nelson SJ. Comparison between Short and Long Echo Time Magnetic Resonance Spectroscopic Imaging at 3T and 7T for Evaluating Brain Metabolites in Patients with Glioma. ACS Chem. Neurosci. 2018;9:130–137 doi: 10.1021/acschemneuro.7b00286.
6. Bolcaen J, Acou M, Boterberg T, et al. 18f-fcho Pet and Mri for the prediction of response in glioblastoma patients according to the Rano criteria. Nucl. Med. Commun. 2017;38:242–249 doi: 10.1097/MNM.0000000000000638.
7. Calabria FF, Barbarisi M, Gangemi V, Grillea G, Cascini GL. Molecular imaging of brain tumors with radiolabeled choline PET. Neurosurg. Rev. 2018;41:67–76 doi: 10.1007/s10143-016-0756-1.
8. De Feyter HM, Behar KL, Corbin ZA, et al. Deuterium metabolic imaging (DMI) for MRI-based 3D mapping of metabolism in vivo. Sci. Adv. 2018;4:eaat7314 doi: 10.1126/sciadv.aat7314.
9. De Feyter HM, Behar KL, Rao JU, et al. A ketogenic diet increases transport and oxidation of ketone bodies in RG2 and 9L gliomas without affecting tumor growth. Neuro-Oncol. 2016;18:1079–1087 doi: 10.1093/neuonc/now088.
10. Viswanath P, Radoul M, Izquierdo-Garcia JL, et al. Mutant IDH1 gliomas downregulate phosphocholine and phosphoethanolamine synthesis in a 2-hydroxyglutarate-dependent manner. Cancer Metab. 2018;6:3 doi: 10.1186/s40170-018-0178-3.
11. Viswanath P, Radoul M, Izquierdo-Garcia JL, et al. 2-Hydroxyglutarate-Mediated Autophagy of the Endoplasmic Reticulum Leads to an Unusual Downregulation of Phospholipid Biosynthesis in Mutant IDH1 Gliomas. Cancer Res. 2018;78:2290–2304 doi: 10.1158/0008-5472.CAN-17-2926.
12. Esmaeili M, Hamans BC, Navis AC, et al. IDH1 R132H Mutation Generates a Distinct Phospholipid Metabolite Profile in Glioma. Cancer Res. 2014;74:4898–4907 doi: 10.1158/0008-5472.CAN-14-0008.
13. Mödinger Y, Schön C, Wilhelm M, Hals P-A. Plasma Kinetics of Choline and Choline Metabolites After A Single Dose of SuperbaBoostTM Krill Oil or Choline Bitartrate in Healthy Volunteers. Nutrients 2019;11:2548 doi: 10.3390/nu11102548.
14. Buchman AL, Jenden DJ, Moukarzel AA, et al. Choline pharmacokinetics during intermittent intravenous choline infusion in human subjects. Clin. Pharmacol. Ther. 1994;55:277–283 doi: 10.1038/clpt.1994.28.
Figures