0270
Deuterium MRI imaging of xenografted tumors following in vivo deuterated water labeling1Experimental Transplantation and Immunotherapy Branch, National Cancer Institute, National Institutes of Health, Bethesda, MD, MD, United States, 2Radiation Biology Branch, Center for Cancer Research, National Cancer Institute, National Institutes of Health, Bethesda, MD, MD, United States, 3Laboratory for Functional and Molecular Imaging, National Institute of Neurological Disorders and StrokNational Institutes of Health, Bethesda, MD, MD, United States
Synopsis
Water is a substrate for many biochemical reactions. If D2O is ingested, it will be incorporated into proliferating cells. We hypothesized that rapidly proliferating cancer cells would become preferentially labeled with 2H which would allow visualization by deuterium MRI following a short in vivo D2O labeling period. We initiated systemic D2O labeling in HT-29 and MiaPaCa-2 xenograft models and performed deuterium MRI following 7 and 14 days of in vivo tumor growth and labeling. We show that small tumors could be distinguished from normal tissue by the incorporation D2O into lipids with a greater sensitivity and selectivity than anatomical MRI.
Purpose:
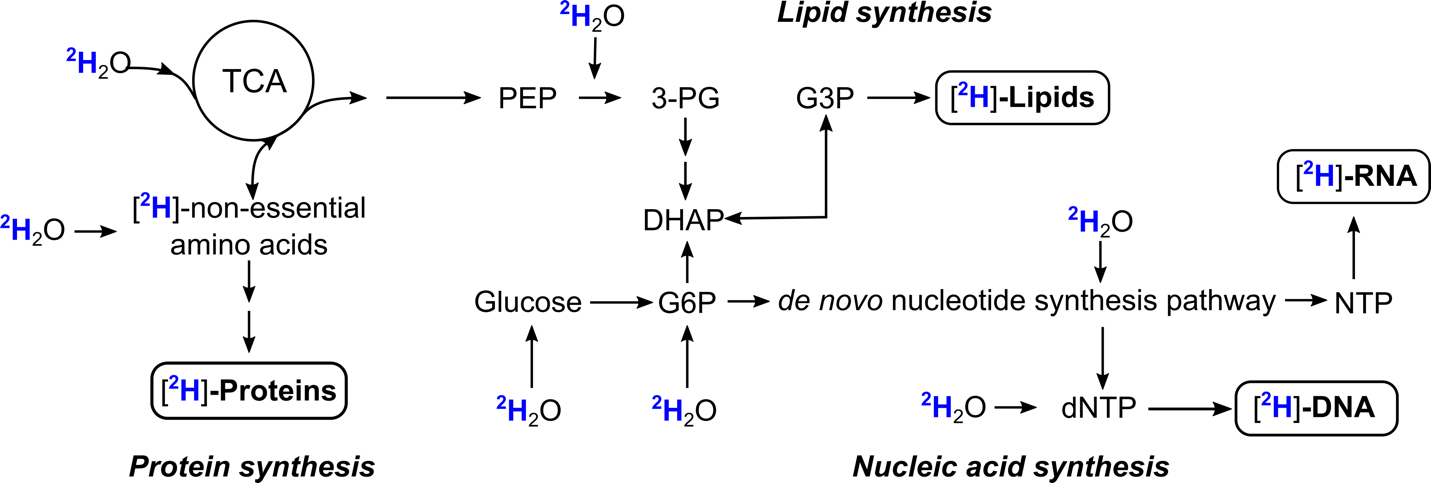
By definition, tumor cells exhibit rapid growth and frequent cell division. During biosynthesis, (deuterated) water is used as a substrate for enzymatic reactions in multiple pathways leading to the formation of stable carbon-deuterium bonds that are not interchangeable with hydrogen, thus allowing in vivo labeling of proliferating cells with simple oral administration of deuterated water (Fig. 1).1-3 This principle has formed the basis for a decades-long use of deuterated water in animal studies with virtually no adverse effects at low to moderate concentrations (up to 20-30% v/v).4-6 By combining deuterium labeling with dMRI, we were able to successfully detect the preferential accumulation of deuterium into lipids in mouse xenografts, demonstrating the utility of this method to visualize tumors in a non-radioactive manner.Methods:
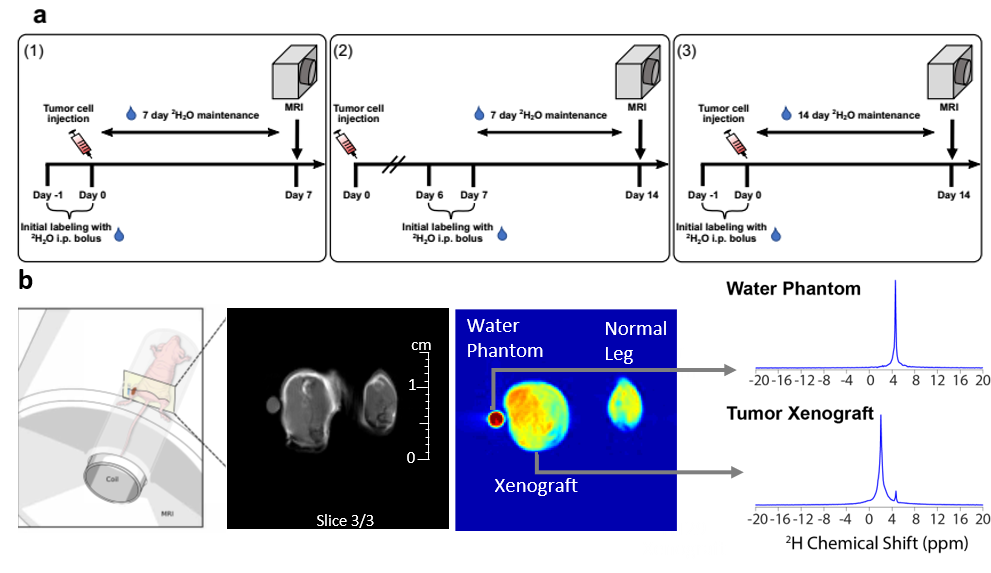
Mice received two bolus injections containing 0.9% NaCl in 100% D2O (35 ml/kg body weight) within 24 h of tumor cell implantation or 7 days after with each bolus increasing TBW enrichment by ~4% (Fig. 2a). Thereafter, the mice were provided drinking water containing 16% (v/v) 2H2O until imaging was performed1. Administration of 16% (v/v) D2O to maintain 8% D2O in TBW was necessary to account for the dilution of D2O by a factor of 0.3-0.4 due to the production of metabolic water and loss of D2O from respiration and excretion.1 Regular drinking water served as a control (0%). For deuterium MRI imaging, three 64 × 64 slices of 0.5 mm × 0.5 mm × 3 mm size were acquired by chemical shift imaging without 1H decoupling using standard linear k-space encoding with a 397 ms repetition time, 512 FID points, and a sweep width of 4,000 Hz using a custom built elliptical dual tuned 1H/2H coil that allows imaging of both legs. A spectrally selective image was first formed by summing the 10 points (156 hz) on either side of the two major peaks in the spectra after noise reduction. Comparisons were made between a region of interest drawn around tumor region obtained from the anatomical MRI and a similar region on the control leg.Results
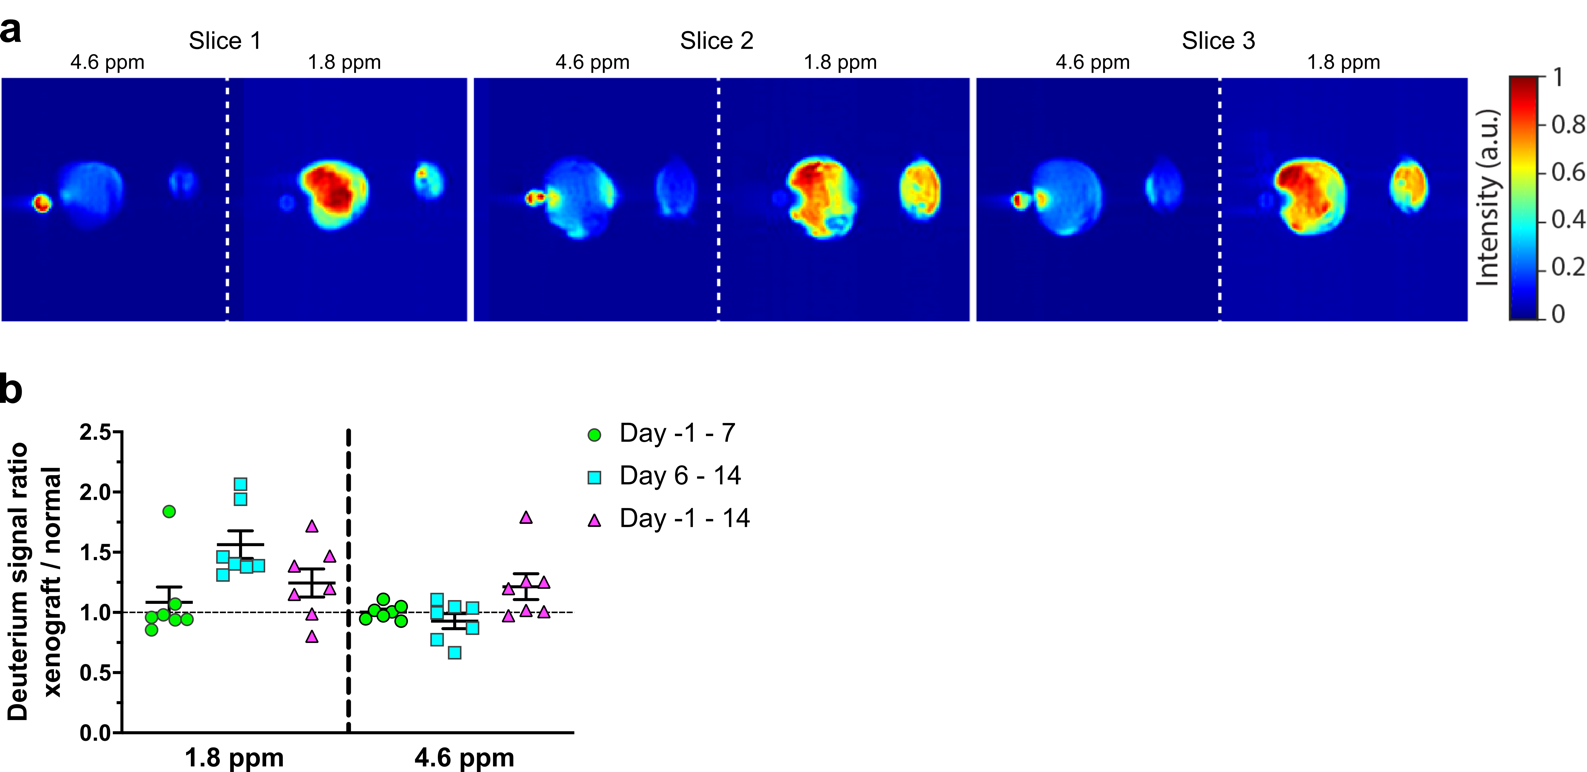
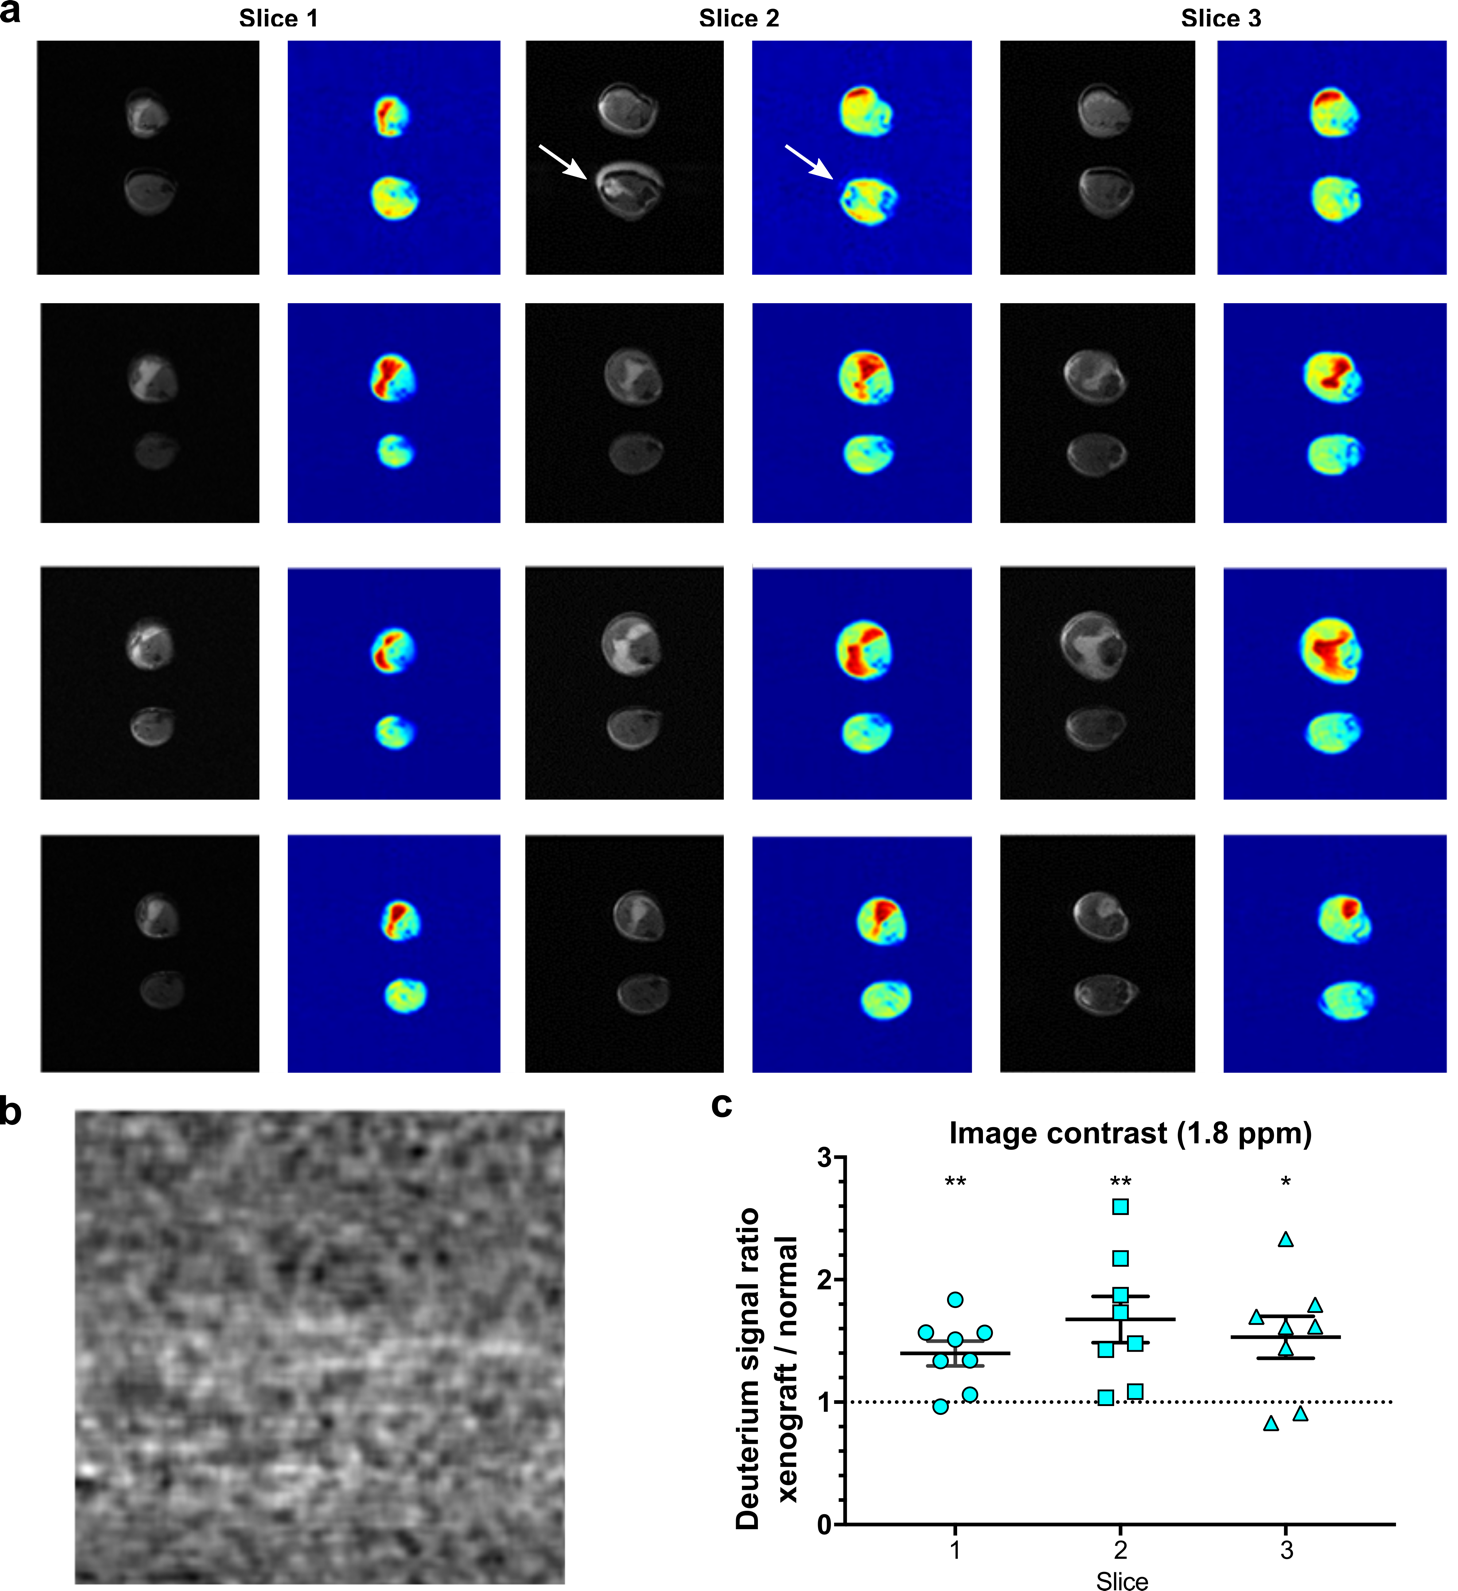
Urine samples from each study animal on the day of imaging confirmed ~6-9% deuterium body water enrichment for all animals that underwent imaging. Quantitative gas chromatography tandem mass spectrometry (GC-MS/MS) showed significantly more incorporation of deuterium into DNA in the tumor xenograft compared to the control leg following the labeling period, confirming the potential for deuterium as marker for cell proliferation. Although we can reliably quantify the deuterium enrichment via mass spectrometry, the analysis is carried out ex vivo and requires a tissue sample. In a clinical setting, acquiring tissue biopsies can be difficult and there are situations where the tumor is inaccessible, or the biopsy is otherwise medically inadvisable. To detect possible deuterium-labelled metabolites in vivo, we tested several label-imaging protocols. Figure 2b shows a representative slice from of the hind limbs of a female athymic mouse with the left leg bearing a relatively small (<1 cm) HT-29 tumor xenograft and the right leg serving as a control. A 3-mm NRM capillary tube containing 10% D2O near the left leg served as a reference for the frequency of the water signal at ~4.6 ppm. Two major peaks can be detected in the deuterium spectra. The first is centered at 4.6 ppm near the expected frequency of the HDO/D2O water peak. The remaining, non-water derived signal is characterized by an intense peak (SNR ~150) with a chemical shift of around 1.8 ppm (Fig. 2b) that is primarily, but not exclusively, observed in the tumor region. The exact identity of the peak cannot be directly inferred from MRI, but the associated shift indicates that the peak likely originates from the CH2 resonance of unsaturated fatty acids, taking into account possible B0 distortion caused by proximity to the partially filled D2O phantom vial.7 We consistently observed a stronger deuterium signal at ~1.8 ppm in the tumor region compared to unaffected surrounding tissue and the contralateral limb (Fig. 3a). No image was visible at 1.8 ppm without labeling (Fig. 4b). The degree of contrast, however, is dependent on the length and timing of the labeling period (Fig. 3b). The strongest contrast was observed after 14 days of tumor growth with labeling starting on the 7th day. Limiting both growth and labeling to the first 7 days led to negligible contrast. Labeling for the full 14-day tumor growth period decreased contrast relative to starting at the 7-day midpoint. The degree of contrast was also dependent on the type of tumor. In MiaPaCa-2 tumors, the tumor is clearly visible as a hyperintense region in the anatomical MRI and there is generally a close correspondence between the anatomical MRI and the deuterium image (Fig. 4).Conclusion
We confirmed that in vivo D2O labeling leads to stable incorporation of deuterium into tumor cells. This enabled us to establish an imaging approach using deuterium MRI approach that can distinguish a growing tumor from quiescent tissue in a non-radioactive manner. We believe that this novel proliferation based labeling-imaging technique could prove a valuable alternative to existing approaches.Acknowledgements
No acknowledgement found.References
[1] Busch, R., Neese, R. A., Awada, M., Hayes, G. M., and Hellerstein, M. K. (2007) Measurement of cell proliferation by heavy water labeling, Nat Protoc 2, 3045-3057.
[2] De Riva, A., Deery, M. J., McDonald, S., Lund, T., and Busch, R. (2010) Measurement of protein synthesis using heavy water labeling and peptide mass spectrometry: Discrimination between major histocompatibility complex allotypes, Anal Biochem 403, 1-12.
[3] Strawford, A., Antelo, F., Christiansen, M., and Hellerstein, M. K. (2004) Adipose tissue triglyceride turnover, de novo lipogenesis, and cell proliferation in humans measured with 2H2O, Am J Physiol Endocrinol Metab 286, E577-588.
[4] Jones, P. J., and Leatherdale, S. T. (1991) Stable isotopes in clinical research: safety reaffirmed, Clin Sci (Lond) 80, 277-280.
[5] Klein, P. D., and Klein, E. R. (1986) Stable isotopes: origins and safety, J Clin Pharmacol 26, 378-382. [6] Buxbaum, N. P., Farthing, D. E., Maglakelidze, N., Lizak, M., Merkle, H., Carpenter, A. C., Oliver, B. U., Kapoor, V., Castro, E., Swan, G. A., Dos Santos, L. M., Bouladoux, N. J., Bare, C. V., Flomerfelt, F. A., Eckhaus, M. A., Telford, W. G., Belkaid, Y., Bosselut, R. J., and Gress, R. E. (2017) In vivo kinetics and nonradioactive imaging of rapidly proliferating cells in graft-versus-host disease, JCI Insight 2.
[7] Delikatny, E. J., Chawla, S., Leung, D. J., and Poptani, H. (2011) MR-visible lipids and the tumor microenvironment, NMR Biomed 24, 592-611.
Figures