0268
The impact of radiomic feature reproducibility on a head and neck cancer radiotherapy response model: a comparison of two common analysis packages1Department of Physical Science, Peter MacCallum Cancer Centre, Melbourne, Australia, 2Department of Biomedical Engineering, The University of Melbourne, Melbourne, Australia, 3Department of Radiation Physics, The University of Texas MD Anderson Cancer Center, Houston, TX, United States, 4Sir Peter MacCallum Department of Oncology, The University of Melbourne, Melbourne, Australia, 5Centre for Medical Radiation Physics, University of Wollongong, Wollongong, Australia, 6Radiation Oncology Department, Centre Hospitalier de l'Université de Montréal, Montreal, QC, Canada, 7Department of Radiation Oncology, University of Texas MD Anderson Cancer Center, Houston, TX, United States, 8Department of Radiation Oncology, Peter MacCallum Cancer Centre, Melbourne, Australia
Synopsis
Radiomics is a promising technique for discovering image based biomarkers of therapy response in cancer. Reproducibility of radiomic features is a known issue that is being addressed by standardisation initiatives, but it remains a challenge to interpret previously published radiomic signatures. We investigate the reproducibility of radiomic features calculated with two common software packages and explore the impact of including non-reproducible diffusion features in a head and neck cancer (HNC) radiotherapy response model. Our results demonstrate that equivalent models can be generated from either software, but only when restricting the model to reproducible features identified with a correlation threshold method.
Introduction
Radiomics1,2 has shown potential in identifying magnetic resonance image based biomarkers for clinical outcome prediction in prostate3,4, breast5, brain6 and head and neck cancers7. Radiomics analysis generates hundreds of image based features, making feature reduction a crucial step to prevent overfitting when developing a radiomics model. Feature space can be reduced by selecting features which are stable under variance due to multiple observer contours/segmentation8 or variance in image acquisition9,10. Validation studies11,12 select a small set of features based on previously reported radiomic signatures from studies using a range of open-source and in-house radiomics software13. The image biomarker standardisation initiative (IBSI) has proposed radiomics guidelines14 which should mitigate known feature reproducibility issues15 in future studies, but feature uncertainty remains a problem when interpreting previously reported radiomic signatures. In this work we investigate the reproducibility of features generated with an open-source radiomics software package used in many published studies (IBEX16) and an emerging open-source tool which follows the IBSI guidelines (PyRadiomics17). We then explore the impact of non-reproducible radiomics features on a head and neck cancer (HNC) radiotherapy response model using apparent diffusion coefficient (ADC) features. Our comparison focuses on diffusion weighted MRI (DWI) of HNC but provides general confidence on which previously reported radiomics features can be reproduced with software that meets the IBSI guidelines14.Methods
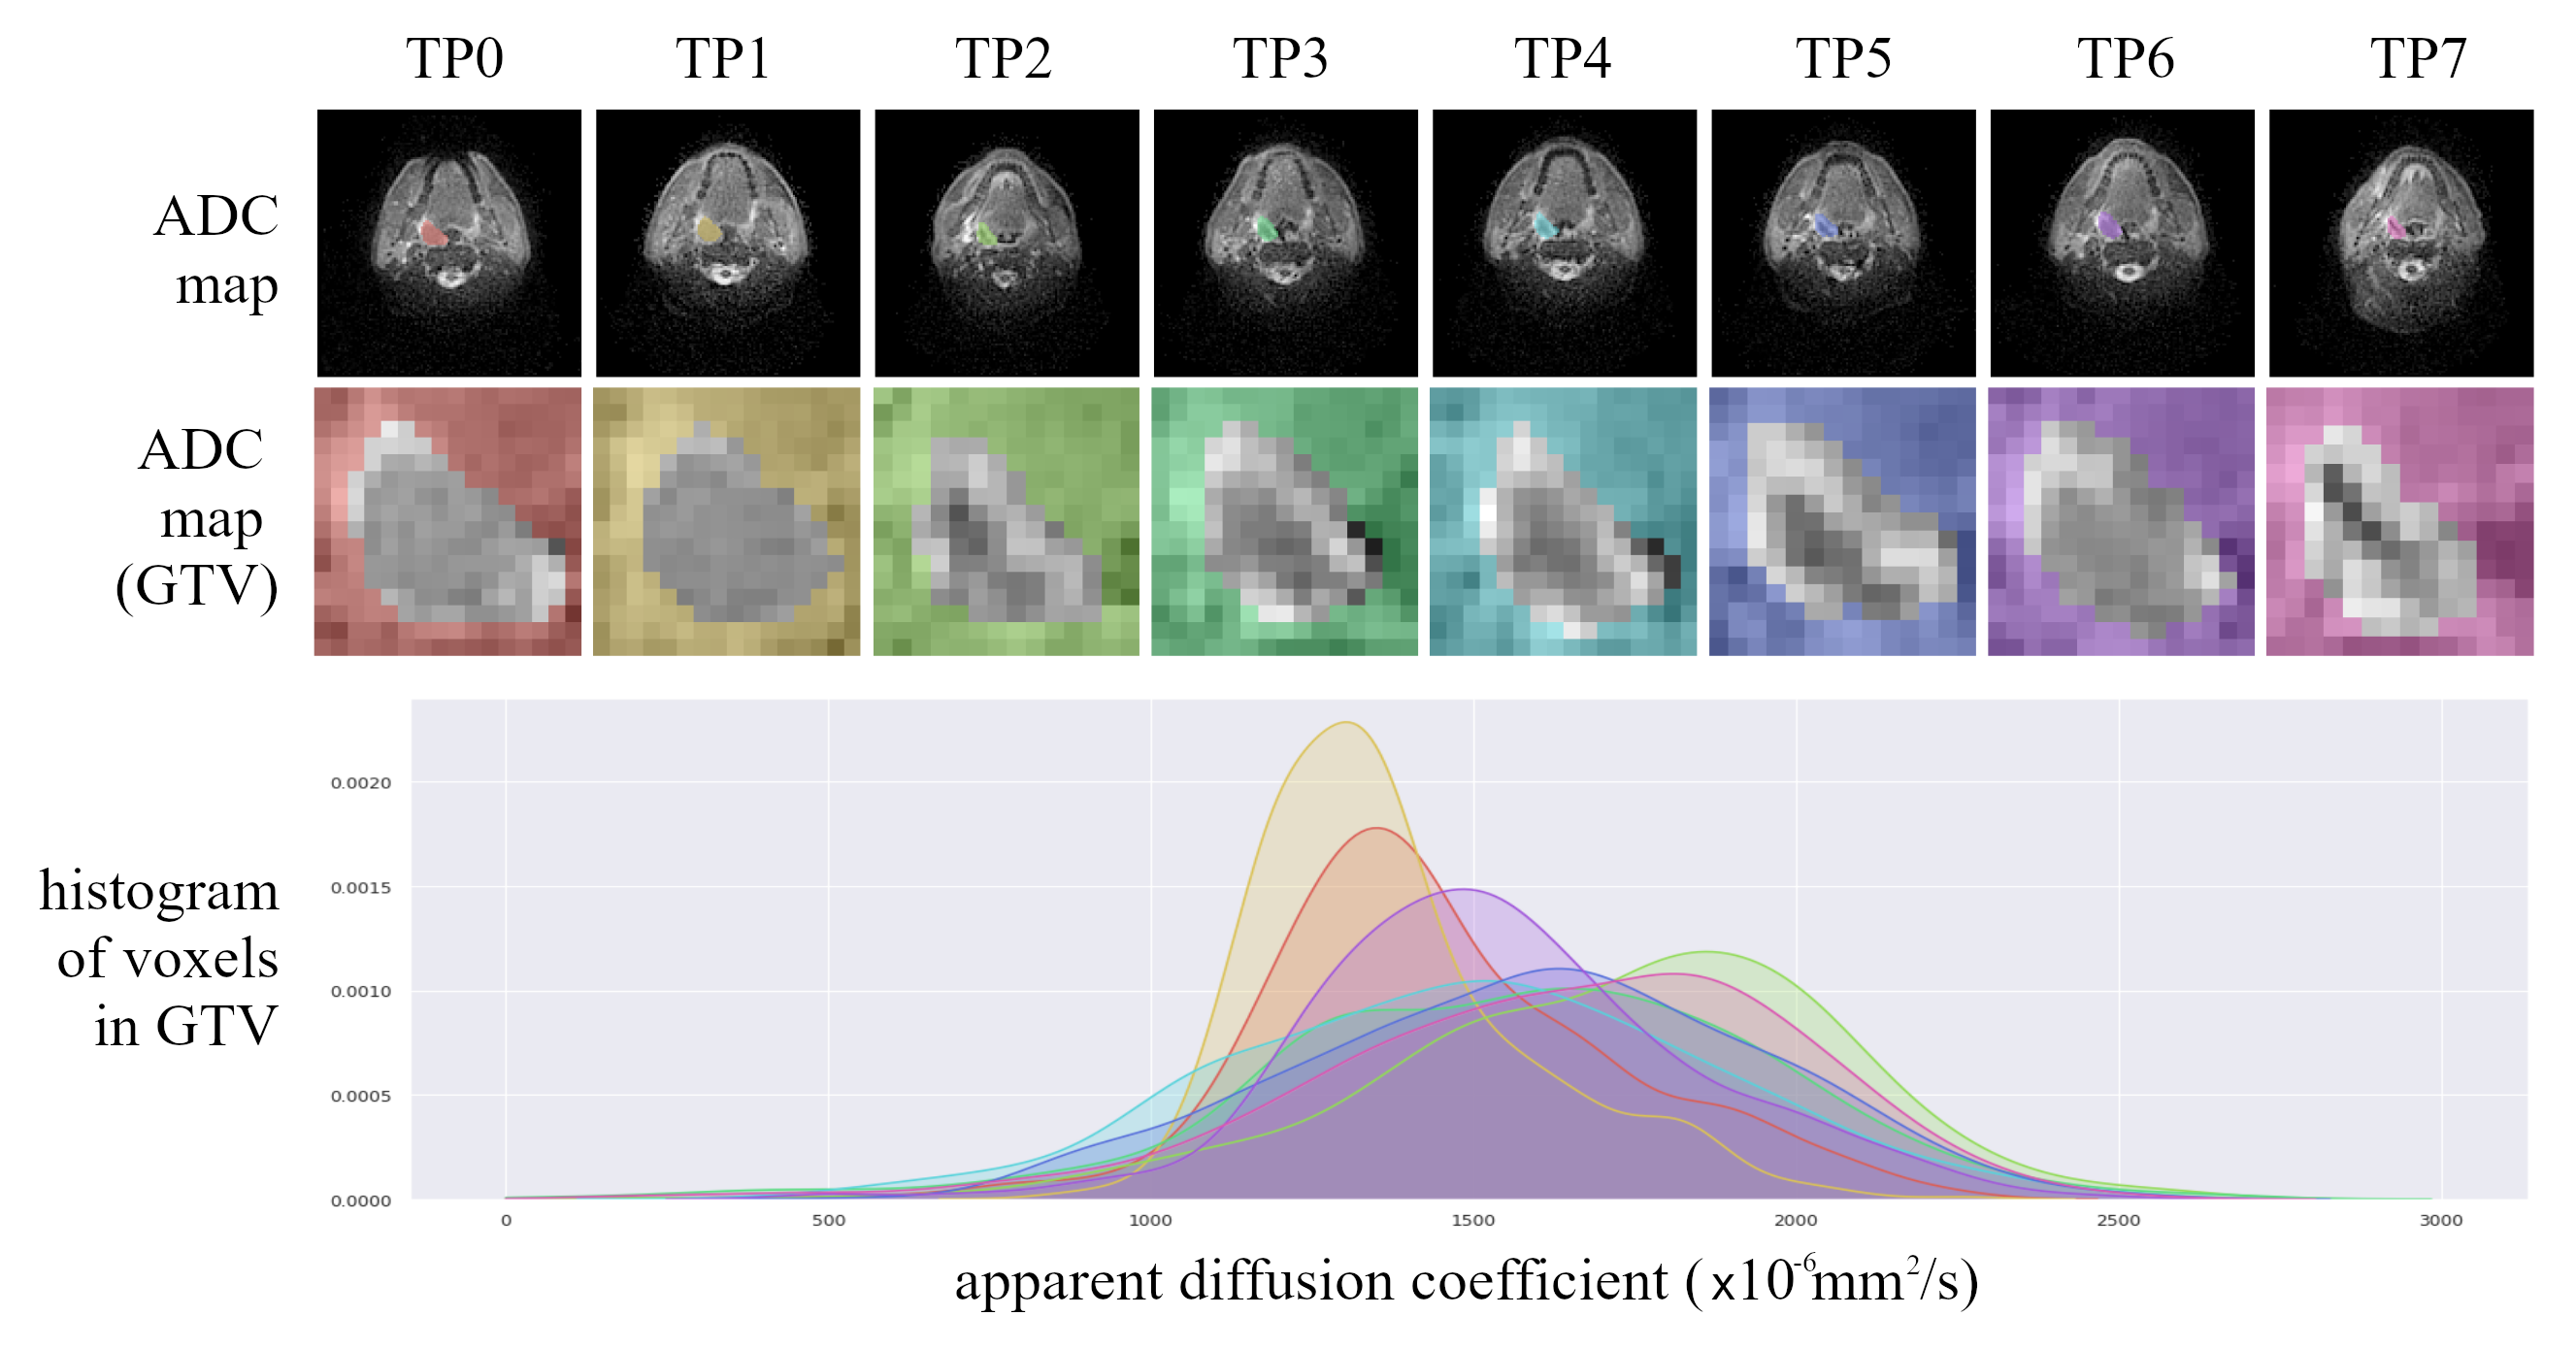
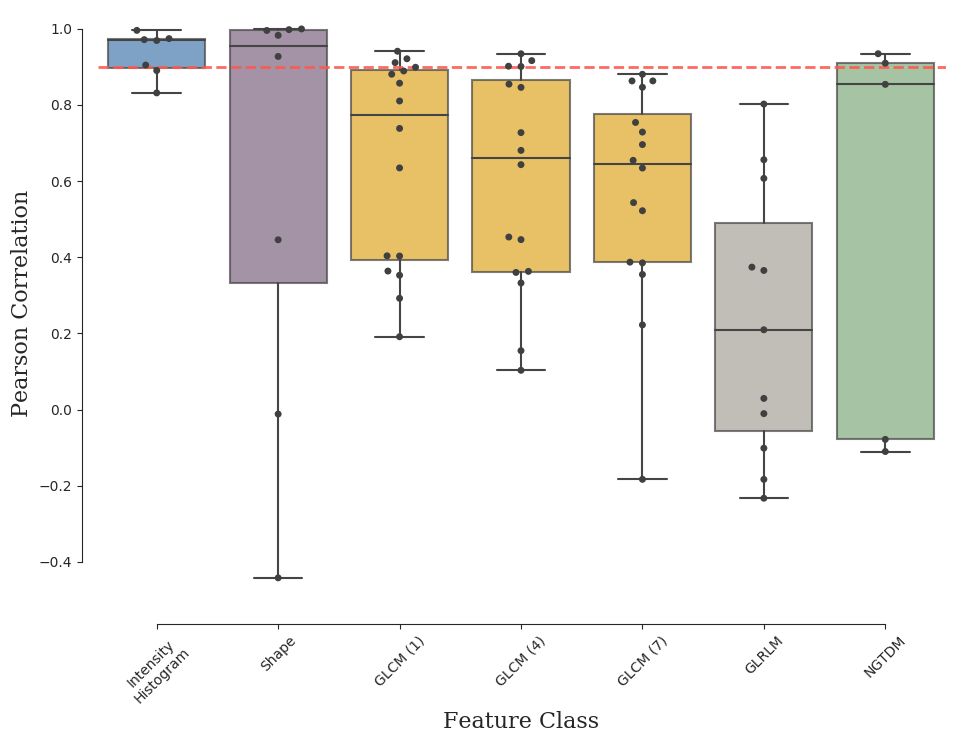
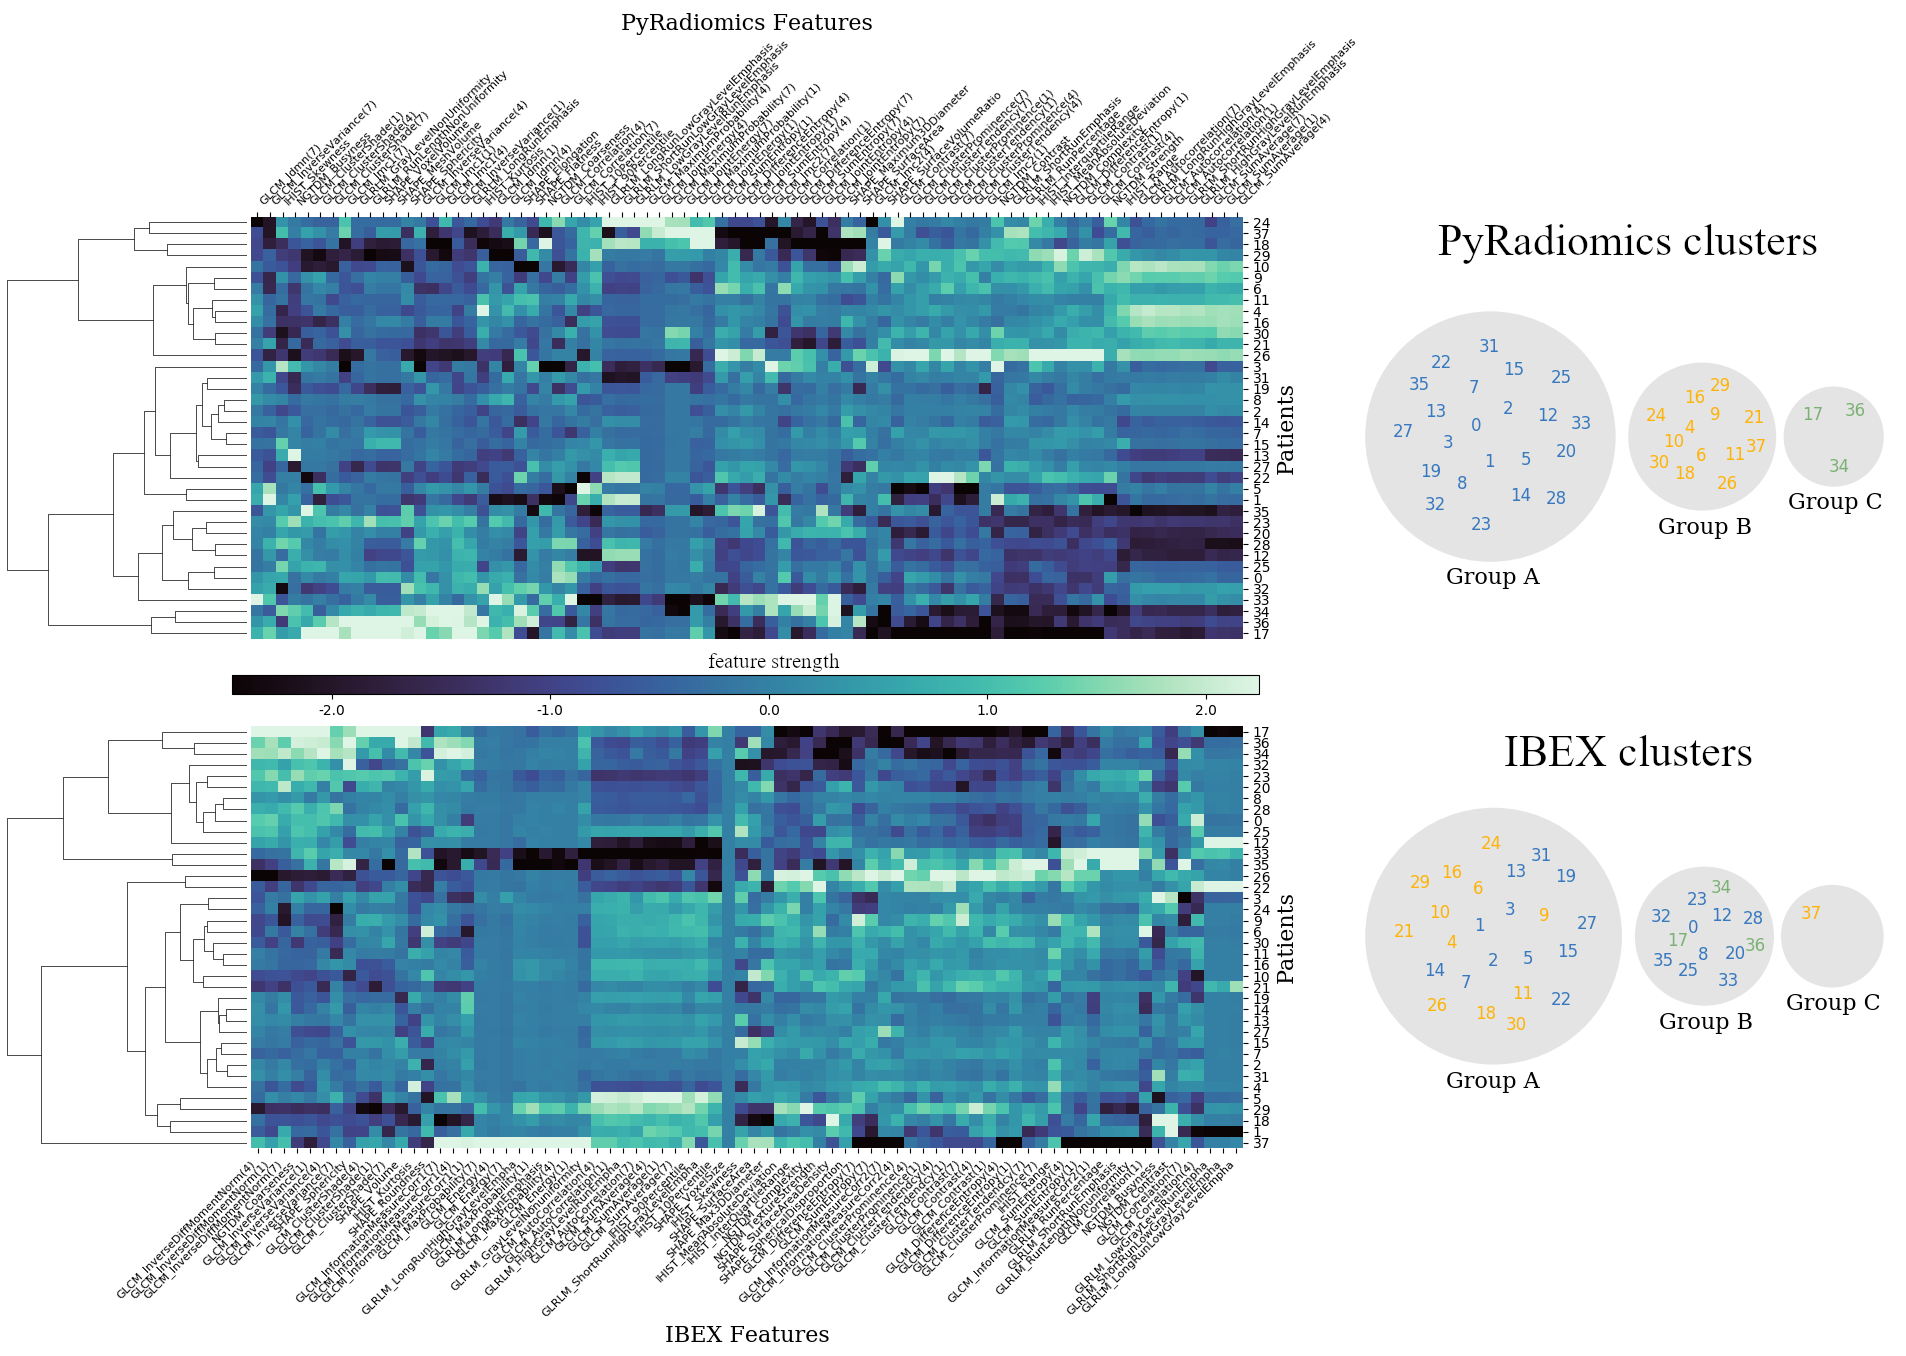
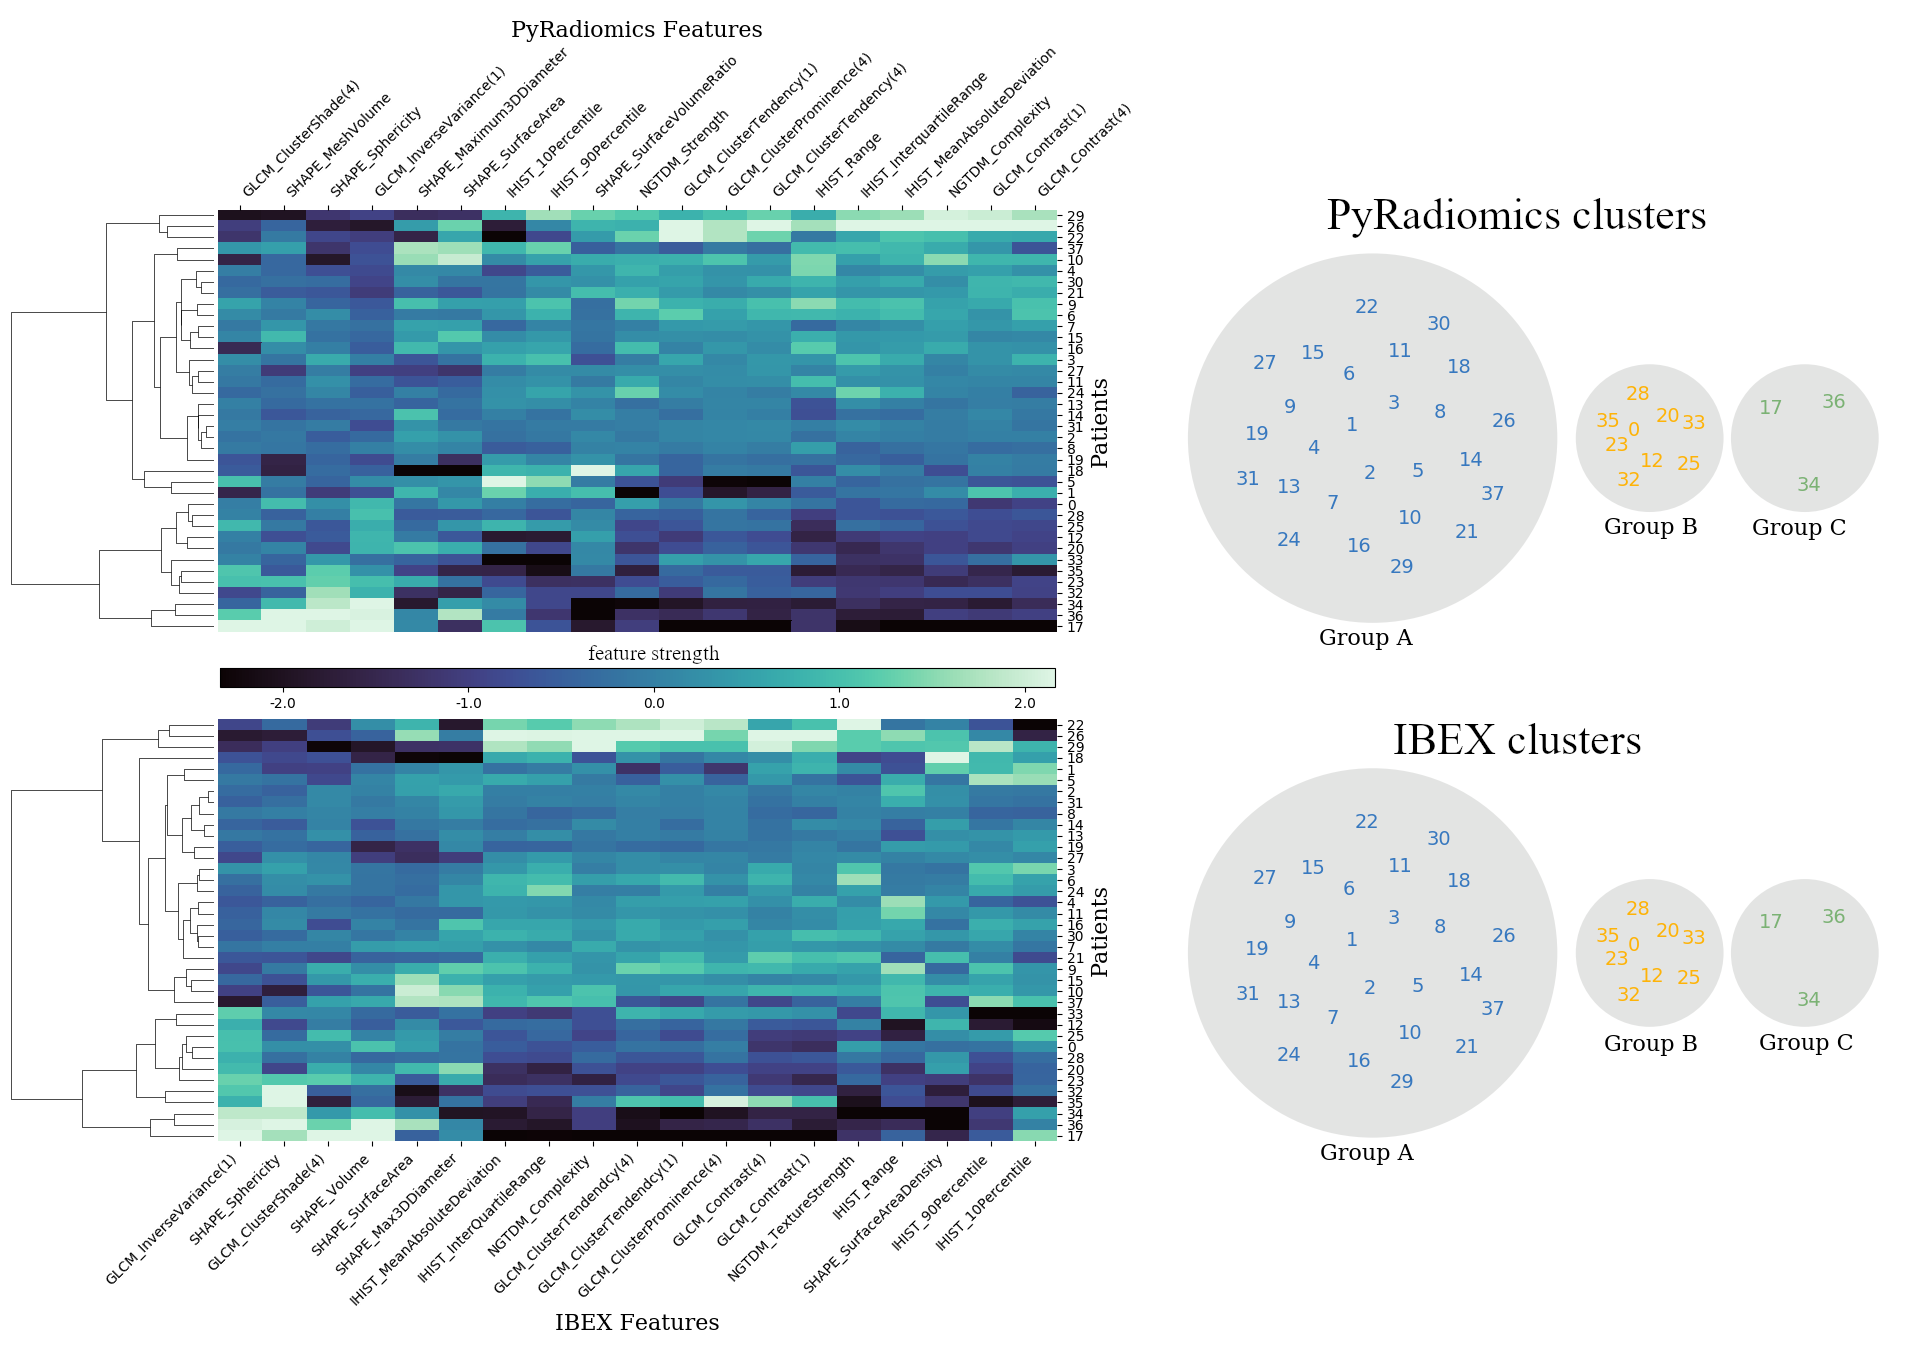
Radiomic features were calculated on 312 ADC maps from the PREDICT-HN prospective trial18 (Figure.1), in which 58 head and neck cancer patients were imaged prior to and throughout radiotherapy. Diffusion weighted images were acquired on a Siemens 1.5T Aera with the BLADE19,20 sequence (voxel size=2 mm, FOV=256x256 mm, axial slices=25, slice thickness= 4 mm, TE=50 ms, TR=5400 ms, FA=90 degrees, b=0,800 s/mm2, ETL=15, pixel bandwidth=1220 Hz). The gross tumour volume (GTV) was contoured on pre-treatment T2 weighted turbo-spin-echo (T2w-TSE) images (voxel size=0.5 mm, FOV=256x256 mm, axial slices=12, slice thickness= 2 mm, TE=80 ms, TR=4800 ms, FA=90 degrees, ETL=15, pixel bandwidth=300 Hz) by a radiation oncologist. Throughout treatment, the pre-treatment contours were adjusted to anatomical boundaries, propagated onto the ADC maps and visually verified.To determine the relationship between features generated with IBEX and PyRadiomics we performed a linear regression analysis on ADC map features from all patients at all time points. We defined a sub-set of reproducible features as those with a high Pearson correlation coefficient (r >= 0.9). To demonstrate the potential impact of incorporating non-reproducible features in a radiomics model we used unsupervised learning to identify three groups of patients, based on the change in radiomic features between pre-treatment and following a single fraction of radiotherapy. Separate radiomic models were generated based on PyRadiomics and IBEX features, first using all features and then with the sub-set of reproducible features. The patient groups (clusters) were identified with Ward's minimum variance clustering method21 on scaled features (z-score standardisation) with an automatic minimum threshold to generate no more than three clusters.
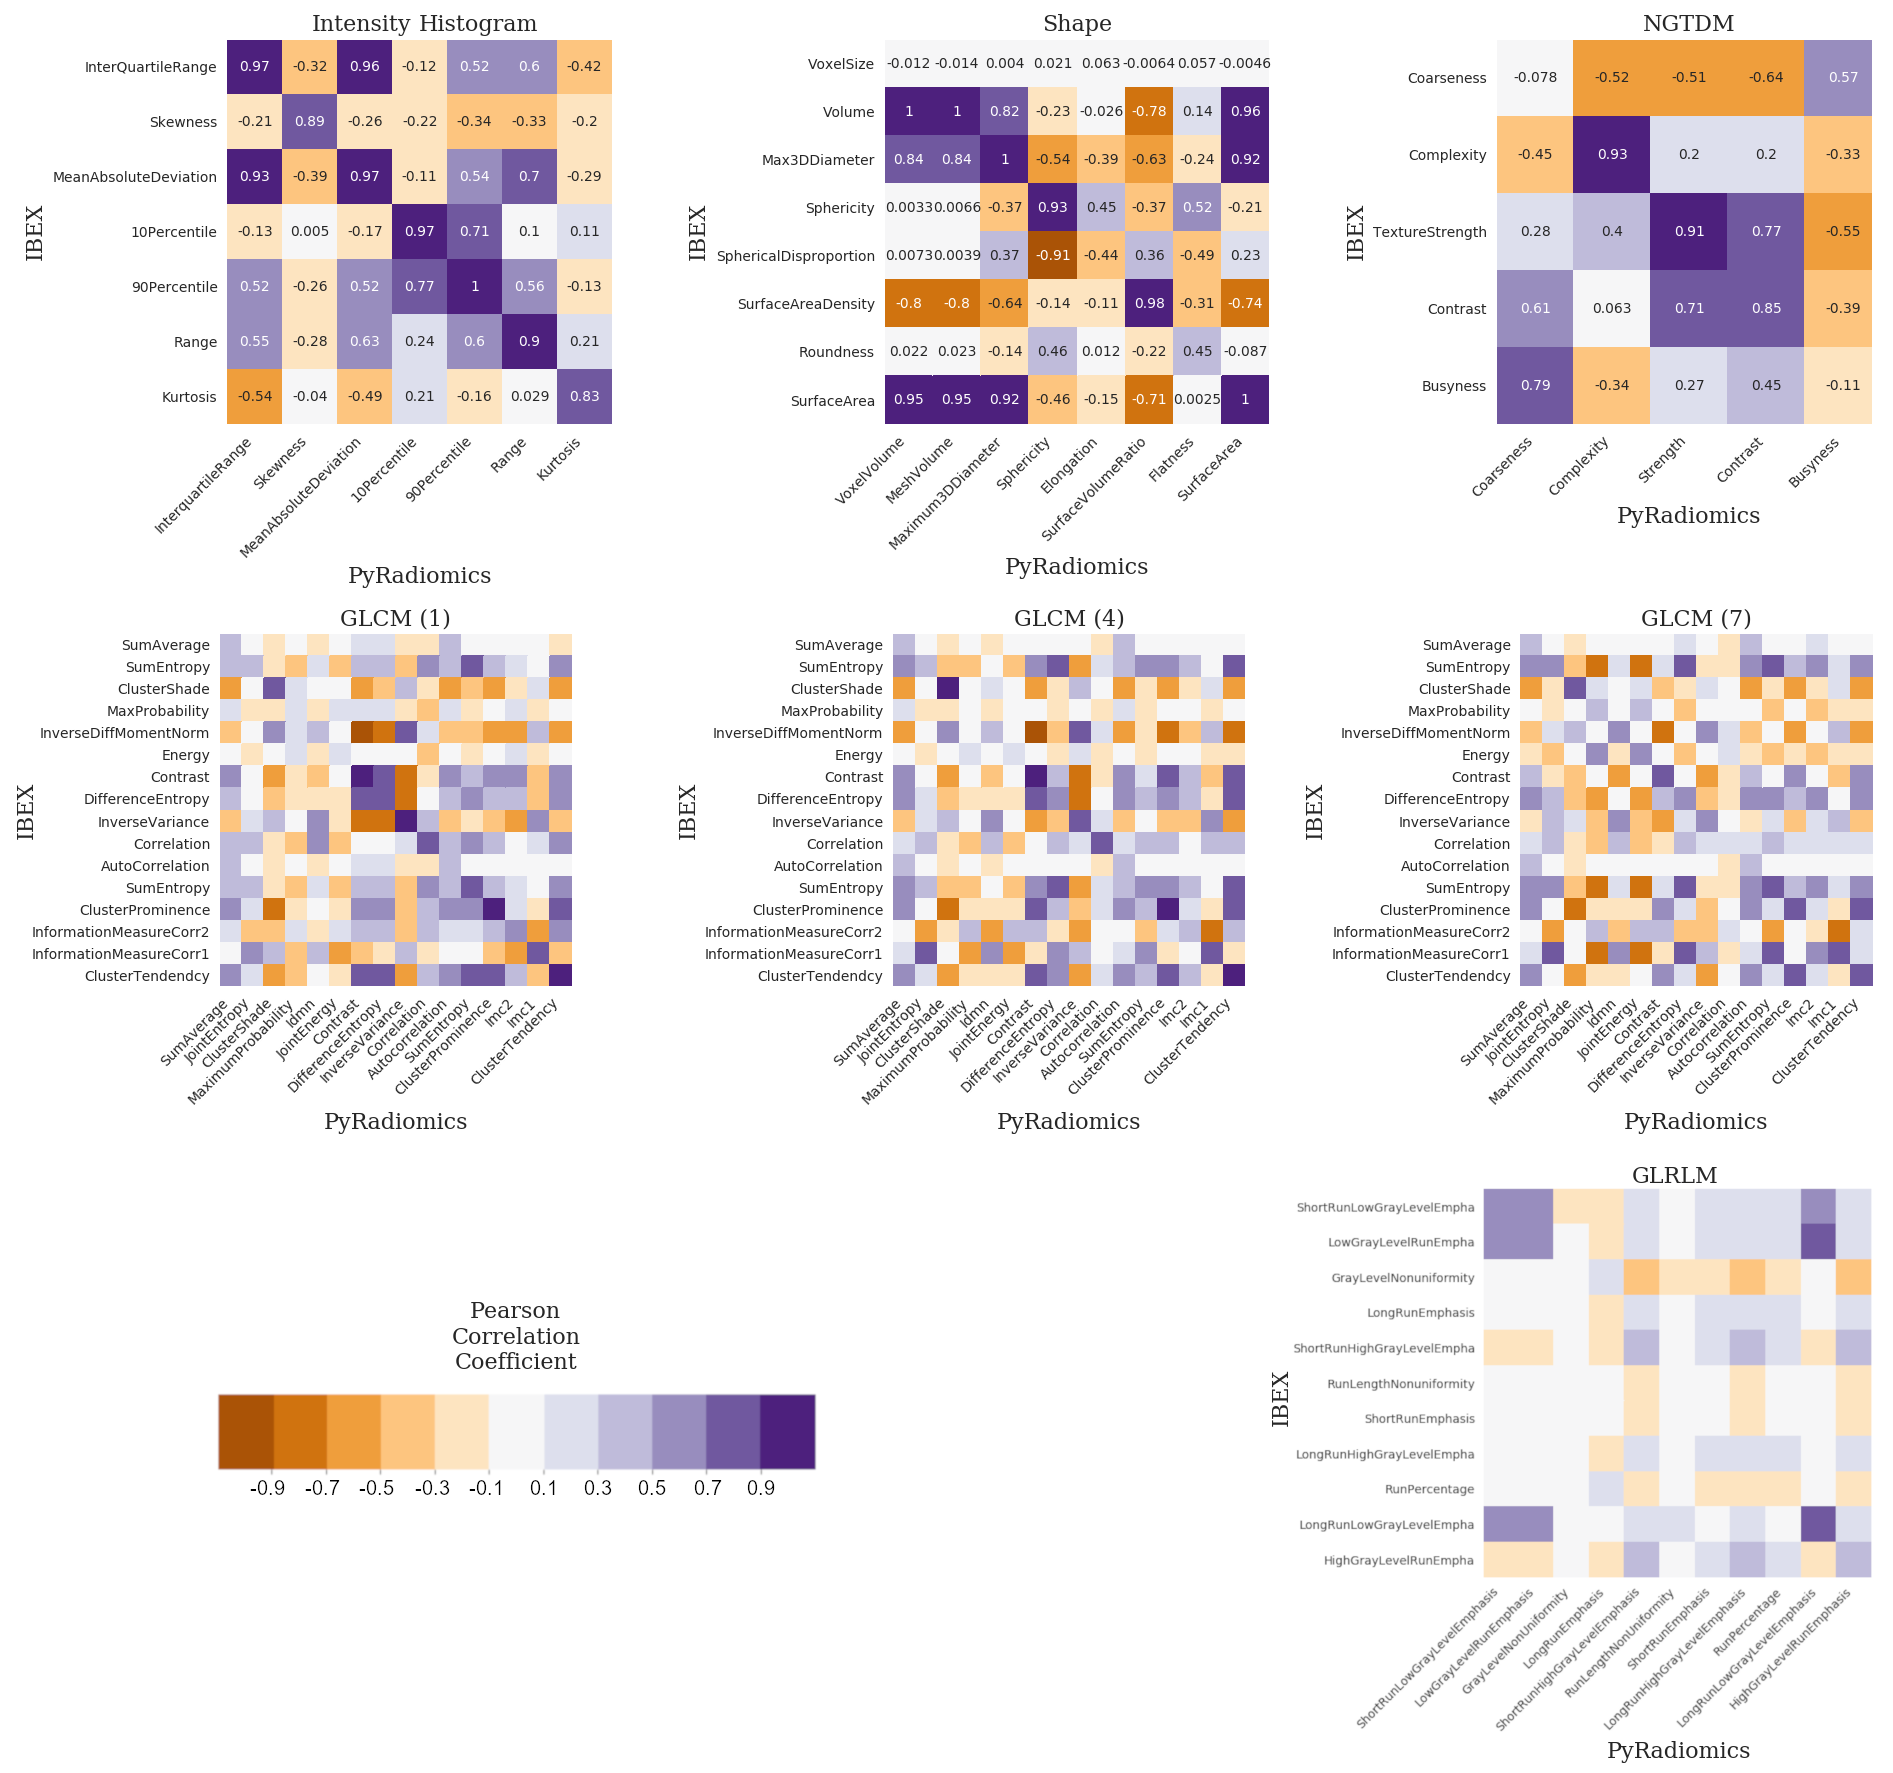
Common features (n=47) of the open-source software packages (IBEX, PyRadiomics) were identified based on name and calculated with feature extraction settings matched as closely as possible using available documentation. Intensity histogram (IHIST), shape, Grey-level co-occurrence matrix (GLCM22), grey-level run length matrix (GLRLM23) and neighbourhood grey-tone difference matrix (NGTDM24) features were calculated on the original ADC map only. The ADC maps were discretised (256 bins, bin width=16) prior to calculation of IHIST and NGTDM features and with a reduced data range (100 bins, bin width=21) for GLCM and GLRLM features. Non-symmetric GLCM features were calculated at a range of neighbourhoods (1,4,7). Symmetric NGTDM features were calculated with a neighbourhood of three. Texture features (GLCM, GLRLM, NGTDM) were calculated on axial slices, as a volumetric measure is not supported by IBEX. The average of all GLCM and GRLM feature directions was used as PyRadiomics does not report features for individual directions.
Results and Discussion
We observed a mixture of correlation between IBEX and PyRadiomics features (Figure.2) with high correlation for the majority of intensity histogram and shape features and less correlated GLCM, GLRLM and NGTDM features. Reliable features from intensity histogram (5/7), shape (5/8), GLCM (neighbourhood 1:3/16, 4:4/16, 7:0/16), GLRLM (0/11) and NGTDM (2/5) categories were identified (Figure.3). These results validate the known issue of radiomic feature reproducibility between software packages15.Clustering based on all features generated different patient groups from IBEX and PyRadiomics models (Figure.4), which demonstrates how feature reproducibility issues can negatively affect model reproducibility. IBEX and PyRadiomics models classified patients into identical groups when clustering was based solely on reliable features (Figure.5). This suggests that using a correlation threshold to identify reproducible features is an adequate method to reduce uncertainty when interpreting radiomic signatures from existing studies.
Conclusion
This work highlights feature and model reproducibility issues due to different radiomic analysis software. We propose a correlation threshold method to select reproducible features and demonstrate that the identified features from both software generate an equivalent model. This is relevant for the selection of radiomic features in clinical biomarker validation trials as it provides a framework to assess the reproducibility of radiomic signatures from existing studies. We are currently extending this analysis to include anatomical imaging (T2w-TSE) and to compare against another widely adopted radiomics package (MaZda25).Acknowledgements
This project is supported by funding from the Peter MacCallum Cancer Foundation.References
1. Lambin P, Rios-Velazquez E, Leijenaar R, et al. Radiomics: extracting more information from medical images using advanced feature analysis. European Journal of Cancer, 2012;48(4):441-446.
2. Kumar V, Gu Y, Basu S, et al. Radiomics: the process and the challenges. Magnetic Resonance Imaging. 2012;30(9):1234-1248.
3. Wibmer A, Hricak H, Gondo T, et al. Haralick texture analysis of prostate MRI: utility for differentiating non-cancerous prostate from prostate cancer and differentiating prostate cancers with different Gleason scores. European Radiology. 2015;25(10):2840-2850.
4. Gnep K, Fargeas A, Gutiérrez‐Carvajal RE, et al. Haralick textural features on T2‐weighted MRI are associated with biochemical recurrence following radiotherapy for peripheral zone prostate cancer. Journal of MRI. 2017;45(1):103-117.
5. Li H, Zhu Y, Burnside ES, et al. MR imaging radiomics signatures for predicting the risk of breast cancer recurrence as given by research versions of MammaPrint, Oncotype DX, and PAM50 gene assays. Radiology. 2016;281(2):382-391.
6. Kickingereder P, Burth S, Wick A, et al. Radiomic profiling of glioblastoma: identifying an imaging predictor of patient survival with improved performance over established clinical and radiologic risk models. Radiology. 2016;280(3):880-889.
7. Jethanandani A, Lin T, Volpe S, et al. Exploring applications of radiomics in magnetic resonance imaging of head and neck cancer: a systematic review. Frontiers in oncology. 2018;8:131.
8. Aerts HJ, Velazquez ER, Leijenaar RT, et al. Decoding tumour phenotype by noninvasive imaging using a quantitative radiomics approach. Nature Communications. 2014;5:4006.
9. Leijenaar RT, Carvalho S, Velazquez E, et al. Stability of FDG-PET Radiomics features: an integrated analysis of test-retest and inter-observer variability. Acta Oncologica. 2013;52(7):1391-1397.
10. Zwanenburg A, Leger S, Agolli L, et al. Assessing robustness of radiomic features by image perturbation. Scientific Reports. 2019;9(1):614.
11. Leijenaar RT, Carvalho S, Hoebers FJ, et al. External validation of a prognostic CT-based radiomic signature in oropharyngeal squamous cell carcinoma. Acta Oncologica. 2015;54(9):1423-1429.
12. Lucia F, Visvikis D, Vallières M, et al. External validation of a combined PET and MRI radiomics model for prediction of recurrence in cervical cancer patients treated with chemoradiotherapy. European Journal of Nuclear Medicine and Molecular Imaging. 2019;46(4):864-877.
13. Nie K, Al-Hallaq H, Li XA, et al. NCTN assessment on current applications of Radiomics in oncology. International Journal of Radiation Oncology Biology Physics. 2019;104(2):303-315
14. Zwanenburg A, Leger S, Vallières M, et al. Image biomarker standardisation initiative. arXiv. 2016;1612.07003.
15. Foy JJ, Robinson KR, Li H, et al. Variation in algorithm implementation across radiomics software. Journal of Medical Imaging. 2018;5(4);044505.
16. Zhang L, Fried DV, Fave XJ, et al. IBEX: an open infrastructure software platform to facilitate collaborative work in radiomics. Medical Physics. 2015;42(3):1341-1353.
17. Van Griethuysen JJ, Fedorov A, Parmar C, et al. Computational radiomics system to decode the radiographic phenotype. Cancer Research. 2017;77(21):e104-e107.
18. Ng SP, Bahig H, Wang J, et al. Predicting treatment Response based on Dual assessment of magnetic resonance Imaging kinetics and Circulating Tumor cells in patients with Head and Neck cancer (PREDICT-HN): matching ‘liquid biopsy’and quantitative tumor modeling. BMC cancer. 2018;18(1):903.
19. Pipe JG. Motion correction with PROPELLER MRI: application to head motion and free‐breathing cardiac imaging. Magnetic Resonance in Medicine. 1999;42(5):963-969.
20. Wintersperger BJ, Runge VM, Biswas J, et al. Brain magnetic resonance imaging at 3 Tesla using BLADE compared with standard rectilinear data sampling. Investigative Radiology. 2016;41(7):586-592.
21. Ward Jr JH. Hierarchical grouping to optimize an objective function. Journal of the American Statistical Association. 1963;58(301):236-244.
22. Haralick RM, Shanmugam K, Dinstein IH. Textural features for image classification. IEEE Transactions on Systems, Man, and Cybernetics. 1973;6:610-621.
23. Galloway, M.M. Texture Analysis Using Gray Level Run Lengths. Computer Graphics and Image Processing. 1975;4:172-179.
24. Amadasun M, King R. Textural features corresponding to textural properties. IEEE Transactions on Systems, Man, and Cybernetics. 1989;19(5);1264-1274.
25. Szczypiński PM, Strzelecki M, Materka A, et al. MaZda—a software package for image texture analysis. Computer methods and programs in biomedicine. 2009;94(1):66-76.
Figures