0266
Identification of Sarcomatoid De-Differentiation in Renal Cell Carcinoma by Machine Learning on Multiparametric MRI
Asim M. Mazin1, Samuel H. Hawkins1, Olya Stringfield2, Jasreman Dhillon3, Brandon J. Manley4, Daniel K. Jeong5, and Natarajan Raghunand1
1Department of Cancer Physiology, Moffitt Cancer Center, Tampa, FL, United States, 2IRAT Shared Service, Moffitt Cancer Center, Tampa, FL, United States, 3Department of Anatomic Pathology, Moffitt Cancer Center, Tampa, FL, United States, 4Department of Genitourinary Oncology, Moffitt Cancer Center, Tampa, FL, United States, 5Department of Diagnostic & Interventional Radiology, Moffitt Cancer Center, Tampa, FL, United States
1Department of Cancer Physiology, Moffitt Cancer Center, Tampa, FL, United States, 2IRAT Shared Service, Moffitt Cancer Center, Tampa, FL, United States, 3Department of Anatomic Pathology, Moffitt Cancer Center, Tampa, FL, United States, 4Department of Genitourinary Oncology, Moffitt Cancer Center, Tampa, FL, United States, 5Department of Diagnostic & Interventional Radiology, Moffitt Cancer Center, Tampa, FL, United States
Synopsis
We report a machine learning approach using Self-Organizing Maps (SOM) and Learning Vector Quantization (LVQ) to analyze multiparametric MRI for the purpose of differentiating between renal cell carcinoma tumor with (sRCC) and without (nsRCC) sarcomatoid de-differentiation, a transformation that is associated with poorer outcomes. The SOM+LVQ model was trained on mpMRI data from 9 nsRCC and 9 sRCC tumors, validated on a separate cohort of 3 nsRCC and 3 sRCC tumors, and tested on a held-out set of 5 nsRCC and 5 sRCC tumors. An overall classification accuracy of 70% was achieved on the test cohort.
Purpose
Suspected RCCs are not routinely biopsied prior to surgical resection; therefore the presence of sarcomatoid de-differentiation (sRCC) is often unknown until histologic evaluation. sRCC is associated with a poor prognosis, and is therefore managed more aggressively than renal cell carcinoma without sarcomatoid components (nsRCC). There is a clinical need for a non-invasive method to detect sarcomatoid dedifferentiation pre-operatively, especially when considering management options like active surveillance [1]. We report a supervised machine learning approach to classify renal cell carcinoma (RCC) tumors based on their appearance on T2-weighted (T2W), non-contrast T1-weighted fat-saturated (T1W), contrast-enhanced arterial phase T1-weighted fat-saturated (T1W-CEart), and contrast-enhanced venous phase T1-weighted fat-saturated (T1W-CEven) MRI images. The model was trained on these multiparametric MRI (mpMRI) data from 9 nsRCC and 9 sRCC tumors, validated on a separate cohort of 3 nsRCC and 3 sRCC tumors, and tested on a held-out set of 5 nsRCC and 5 sRCC tumors.Methods
In this IRB-approved study we identified 17 subjects with pathology-proven sRCC tumors for whom pre-operative T2W, T1W, T1W-CEart and T1W-CEven MRI scans were available. We also curated a set of 17 nsRCC tumors of comparable tumor volumes. Tumors were divided into balanced training, validation and test cohorts as in Table 1. The T1W, T1W-CEart and T1W-CEven images were resampled and spatially co-registered to the T2W image. The contralateral normal kidney cortex was semi-automatically segmented on all applicable slices of the T1W-CEart images to provide a large number of voxels for intensity calibration as shown in Figure 1 . The tumor was manually contoured on all applicable slices by a Radiologist as illustrated in Figure 1. Raw tumor voxel intensities on T2W images were calibrated by dividing them by the mean intensity of the contralateral normal kidney cortex on T2W of the same patient. Raw tumor voxel intensities on T1W, T1W-CEart and T1W-CEven images were calibrated by dividing them by the mean intensity of the contralateral normal kidney cortex on T1W of the same patient. Calibrated voxel intensities from tumors belonging to the training and validation cohorts were variance-normalized to the means and standard deviations of pooled training + validation tumor voxels on each respective scan type; the same means and standard deviations were also used to variance-normalize intensities of voxels in tumors from the test cohort. After this process each voxel had 4 “channels” of calibrated and variance-normalized mpMRI intensities associated with it [2-4]. Reasoning that each mpMRI “channel” may be adequately described by 3 intensity levels, for a total of 34 = 81 levels, we employed a Kohonen Self-Organizing Map (SOM) [5] of order 9x9 to reduce this 4-dimensional intensity space to 81 levels.Results
A 9x9 SOM was trained on the 18 training cohort tumors to produce the SOM depicted in Figure 2(a); the 81 “neurons” in the trained SOM correspond to distinct “phenotypes” in the 4-dimensional calibrated & variance-normalized intensity space. Figure 2(b) shows the Activation Map of all 9 nsRCC tumors in the training cohort, while Figure 2(c) shows the Activation Map of all 9 sRCC tumors in the training cohort; each cell in a given Activation Map represents the relative number of voxels belonging to a given “phenotype” in the corresponding SOM. Activation Maps were generated individually for each of the training, validation and test tumors, and these became the inputs on which a Learning Vector Quantizer [6] (LVQ) classifier was trained. The LVQ was trained on Activation Maps of the 18 training cohort tumors and optimized for step size and number of training epochs. The model with the best performance (learning rate = 0.001, 1000 training epochs, Figure 3) on Activation Maps of the 6 validation cohort tumors was advanced to the test phase. This model produced an accuracy of 70% on the 10 test cohort tumors (Figure 4).Discussion & Conclusions
We have demonstrated a Self-Organizing Map based approach to analysis of standard multiparametric MRI images for the task of identifying sarcomatoid dedifferentiation in renal cell carcinoma. Sarcomatoid de-differentiation is noted in approximately 5-10% of all RCCs, and this relatively uncommon presentation, combined with our requirement for availability of pre-operative MRIs, restricted the current study to a relatively small sample size. Our ongoing work is focused on increasing the sample size as well as on increasing the number of mpMRI “channels” to increase the information available to the SOM-LVQ model. In particular, we are seeking to add Apparent Diffusion Coefficient maps that are known to be useful for differential diagnosis in this setting [1].Acknowledgements
No acknowledgement found.References
- Jeong DK, Raghunand N, Hernando D, Poch M, Jeong K, Eck B, Dhillon J. Quantification of sarcomatoid dedifferentiation in renal cell carcinoma on magnetic resonance imaging. Quantitative Imaging in Medicine and Surgery 8:373-382, 2018.2.
- Vannier MW, Butterfield RL, Jordan D, Murphy WA, Levitt RG, Gado M. Multispectral analysis of magnetic resonance images. Radiology 154:221-224, 1985.3.
- Taxt T, Lundervold A, Fuglaas B, Lien H, Abeler V. Multispectral analysis of uterine corpus tumors in magnetic resonance imaging. Magnetic Resonance in Medicine 23:55-76, 1992.4.
- Carano RA, Ross AL, Ross J, Williams SP, Koeppen H, Schwall RH, Van Bruggen N. Quantification of tumor tissue populations by multispectral analysis. Magnetic Resonance in Medicine 51:542-51, 2004.5.
- Kohonen T, The self-organizing map. Neurocomputing 21:1-6, 1998.6.
- Kohonen T. (1995) Learning Vector Quantization. In: Self-Organizing Maps. Springer Series in Information Sciences, vol 30. Springer, Berlin, Heidelberg.
Figures
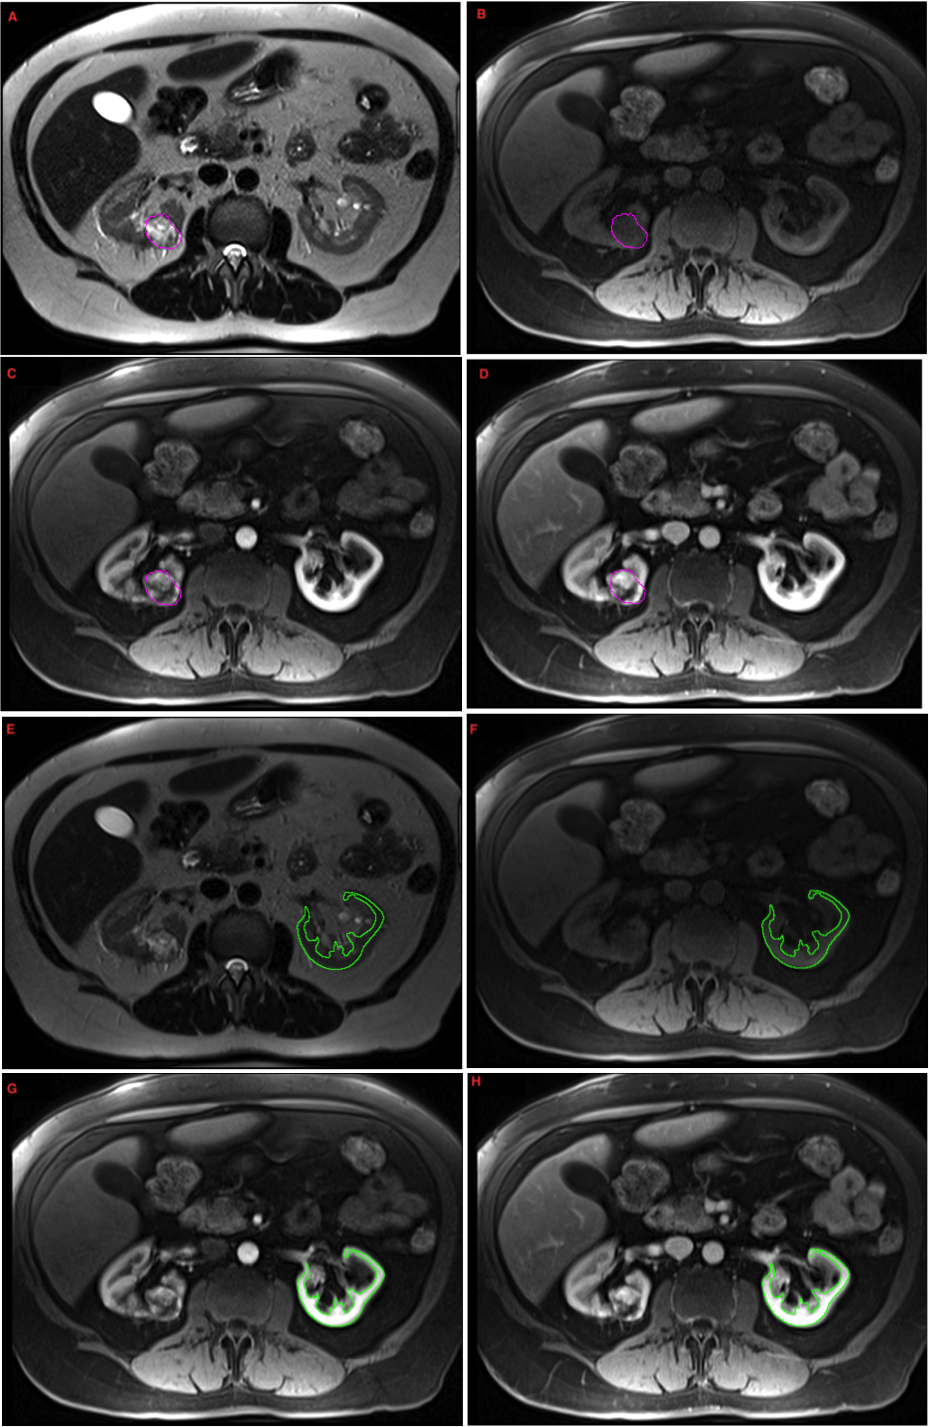
Figure1. Example mpMRI images of a subject with RCC. Axial A. T2w, B. T1w fs noncontrast, C. T1w fs arterial phase, D. T1w fs venous phase images demonstrate a nsRCC segmented in purple on each sequence. Axial E. T2w, F. T1w fs noncontrast, G. T1w fs arterial phase, H. T1w fs venous phase images demonstrate the semi-automated contours of the contralateral normal renal cortex in the same patient on each sequence.
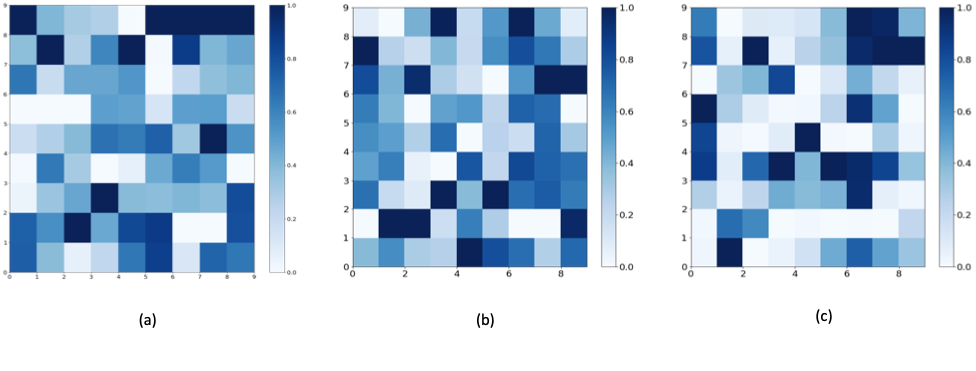
Figure 2. (a) A 9X9 SOM trained on 9 sRCC + 9 nsRCC tumors, (b) Activation Map of pooled voxels from all 9 nsRCC tumors in the training cohort, (c) Activation Map of pooled voxels from all 9 sRCC tumors in the training cohort. Panels (b) and (c) are shown to illustrate differences in the SOM signatures of the two classes of tumors. The LVQ classifier was actually trained using Activation Maps of individual tumors as inputs.
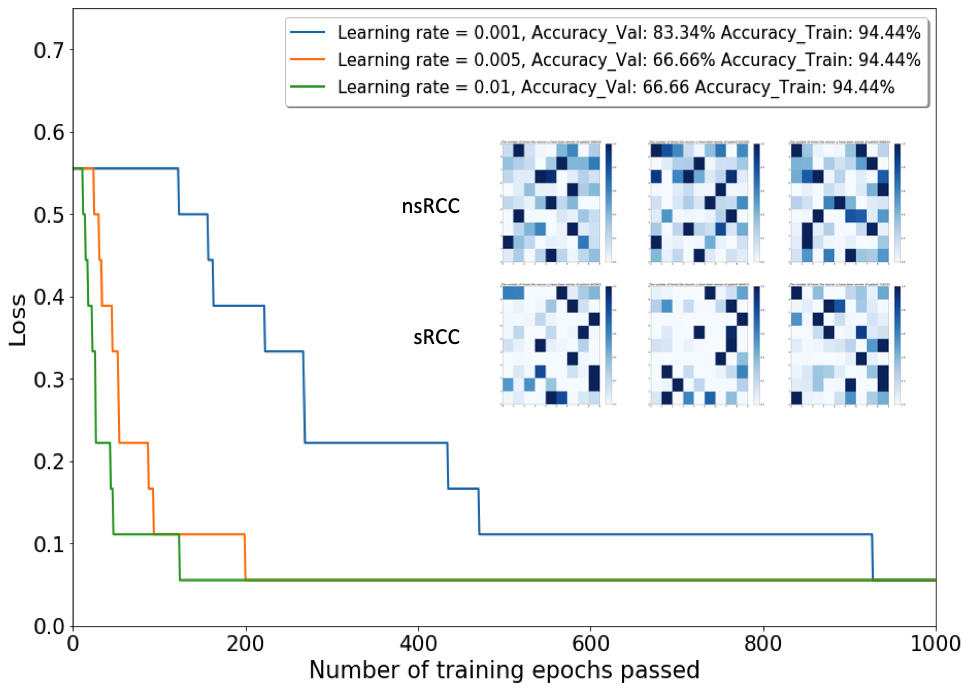
Figure 3. The main plot shows loss (misclassification ratio) as a function of step size (learning rate) and number of training epochs of the Learning Vector Quantizer (LVQ) model. The inset shows individual Activation Maps of the 6 Validation Cohort tumors.
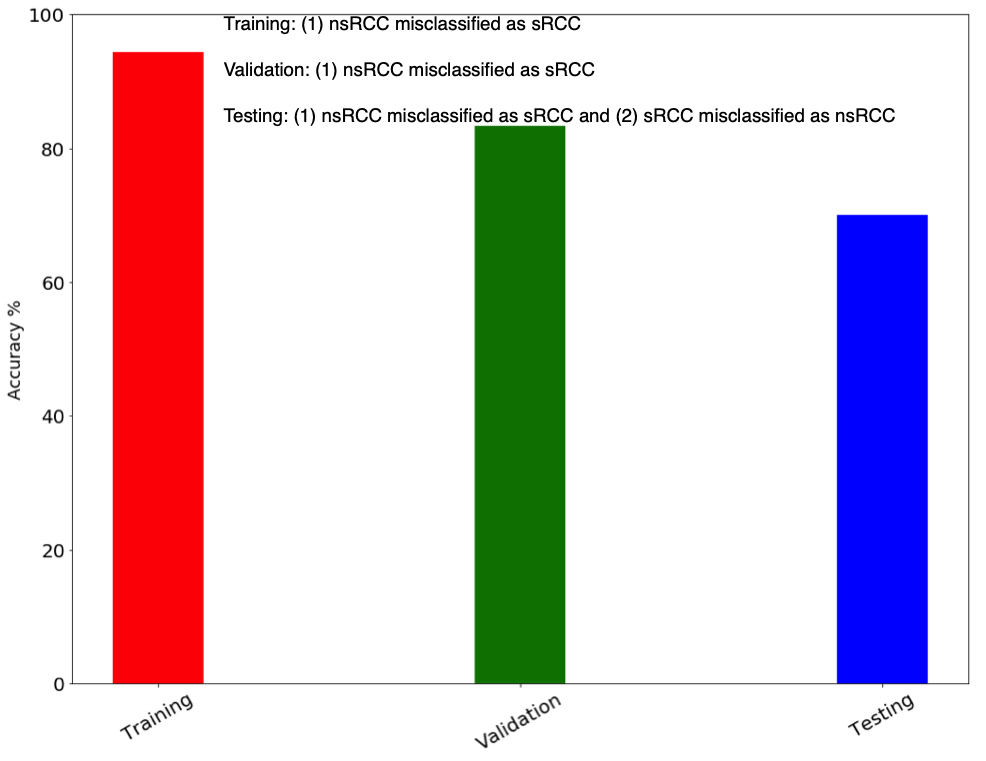
Figure 4. Overall performance of the LVQ classifier on the training, validation and test cohorts.
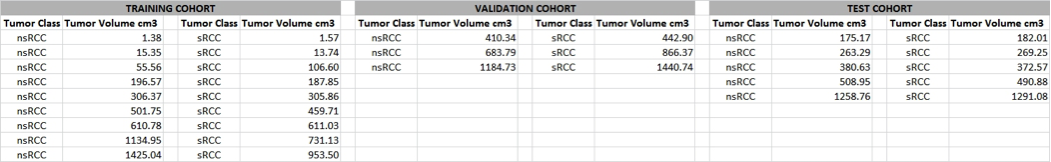
Table1. Training, validation and test cohorts