0265
Radiomic features of cervical tumors: identifying volume thresholds for transition to a poor prognosis phenotype1Imaging, The Institute of Cancer Research, Sutton, Surrey, United Kingdom, 2Gynaecological Oncology, The Royal Marsden NHS FoundationTrust, London, United Kingdom, 3Surgery, St. Georges University Hospital, London, United Kingdom, 4MRI Unit, The Royal Marsden NHS Foundation Trust, Sutton, Surrey, United Kingdom
Synopsis
Cervical cancer recurs post-trachelectomy often because of close surgical margins or lymph-node micrometastases. We show that 5 texture features distinguish good- from poor-prognosis tumors (low/high volume, without/with parametrial invasion, without/with lymph node metastases). For tumors suitable for trachelectomy (<4.19cm3), linear regression of feature value with volume (using 3 features with high discrimination of groups and 1 standard deviation from median from good prognosis group as threshold) indicated that radiomic features tended towards values representing poor prognosis at 1.8±0.2cm3 (T2-W images) and 1.8±0.06cm3 (ADC maps). Above 1.8cm3 textural features of cervical cancer shift towards a phenotype likely to spread and metastasize.
Background
T2-W and diffusion-weighted (DW) imaging form the mainstay of diagnostic sequences in cervical cancer [1; 2]. It is possible to refine analysis of these images and convert the T2-W [3] and DW [4] imaging data into a high-dimensional feature space using algorithms to extract a more extensive set of statistical features within the data (“radiomics”). We previously demonstrated differences in texture features from T2-W imaging and ADC maps between high- and low-volume tumors (<4cm3, suitable for fertility preservation with trachelectomy based on surgical assessment) [5]. Nevertheless, even with small volume tumors, there is a ~10% recurrence rate post trachelectomy [6]. This is often related to close margins at surgery or micrometastases in lymph nodes. Establishing the volume above which the texture features of a small tumor suitable for trachelectomy are likely to indicate local invasion/ metastasis would aid better selection of patients for this fertility-sparing surgery.Purpose
- To determine the radiomic features that distinguish tumors i) without and with parametrial invasion and ii) without and with lymph node metastases; to compare them with those identified for tumors less or greater than 4.19 cm3 (spherical volume corresponding to the 2 cm diameter clinical threshold for trachelectomy).
- To establish the volume at which these radiomic features exceed 1 standard deviation from median value of “good prognosis” tumors (low volume, no parametrial invasion, no lymph node metastasis).
Methods
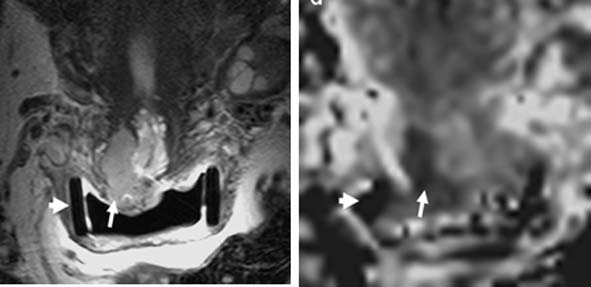
Of 378 patients with Stage1-2 cervical cancer imaged prospectively (3T, endovaginal coil, Figure 1), 125 had well-defined, histologically-confirmed squamous or adenocarcinomas with >100 voxels (>0.07cm3) suitable for radiomic analysis. Regions-of-interest outlined the whole tumor on T2-W images and apparent diffusion coefficient (ADC) maps. Features were extracted from the MRI images using Haralick texture analysis; these features are computed from the grey level co-occurrence matrices (GLCM) at each voxel within a segmented 3D volume. Correlated Haralick features were eliminated prior to analysis. A Wilcoxon rank sum test with Bonferroni correction was applied to assess the differences in these features between tumors greater (n=46) or less (n=79) than 4.19 cm3, those without (n=84) and with (n=41) parametrial invasion, and without (n=86) and with (n=39) lymph node metastasis. Features that clearly distinguished good-prognosis from poor prognosis tumors (low vs. high volume, organ-confined vs. locally advanced, non-metastatic vs. metastatic) were identified. For tumors <4.19 cm3, linear regression equations of these features against volume were derived and solved for values 1 standard deviation from median obtained from the good prognosis group (16th centile for Dissimilarity and InverseVariance where good prognosis values significantly higher than poor prognosis values; 84th centile for Energy where good prognosis values significantly lower than poor prognosis values).Results
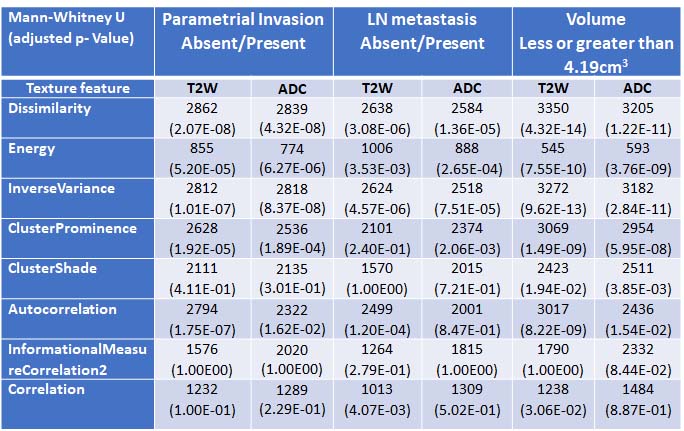
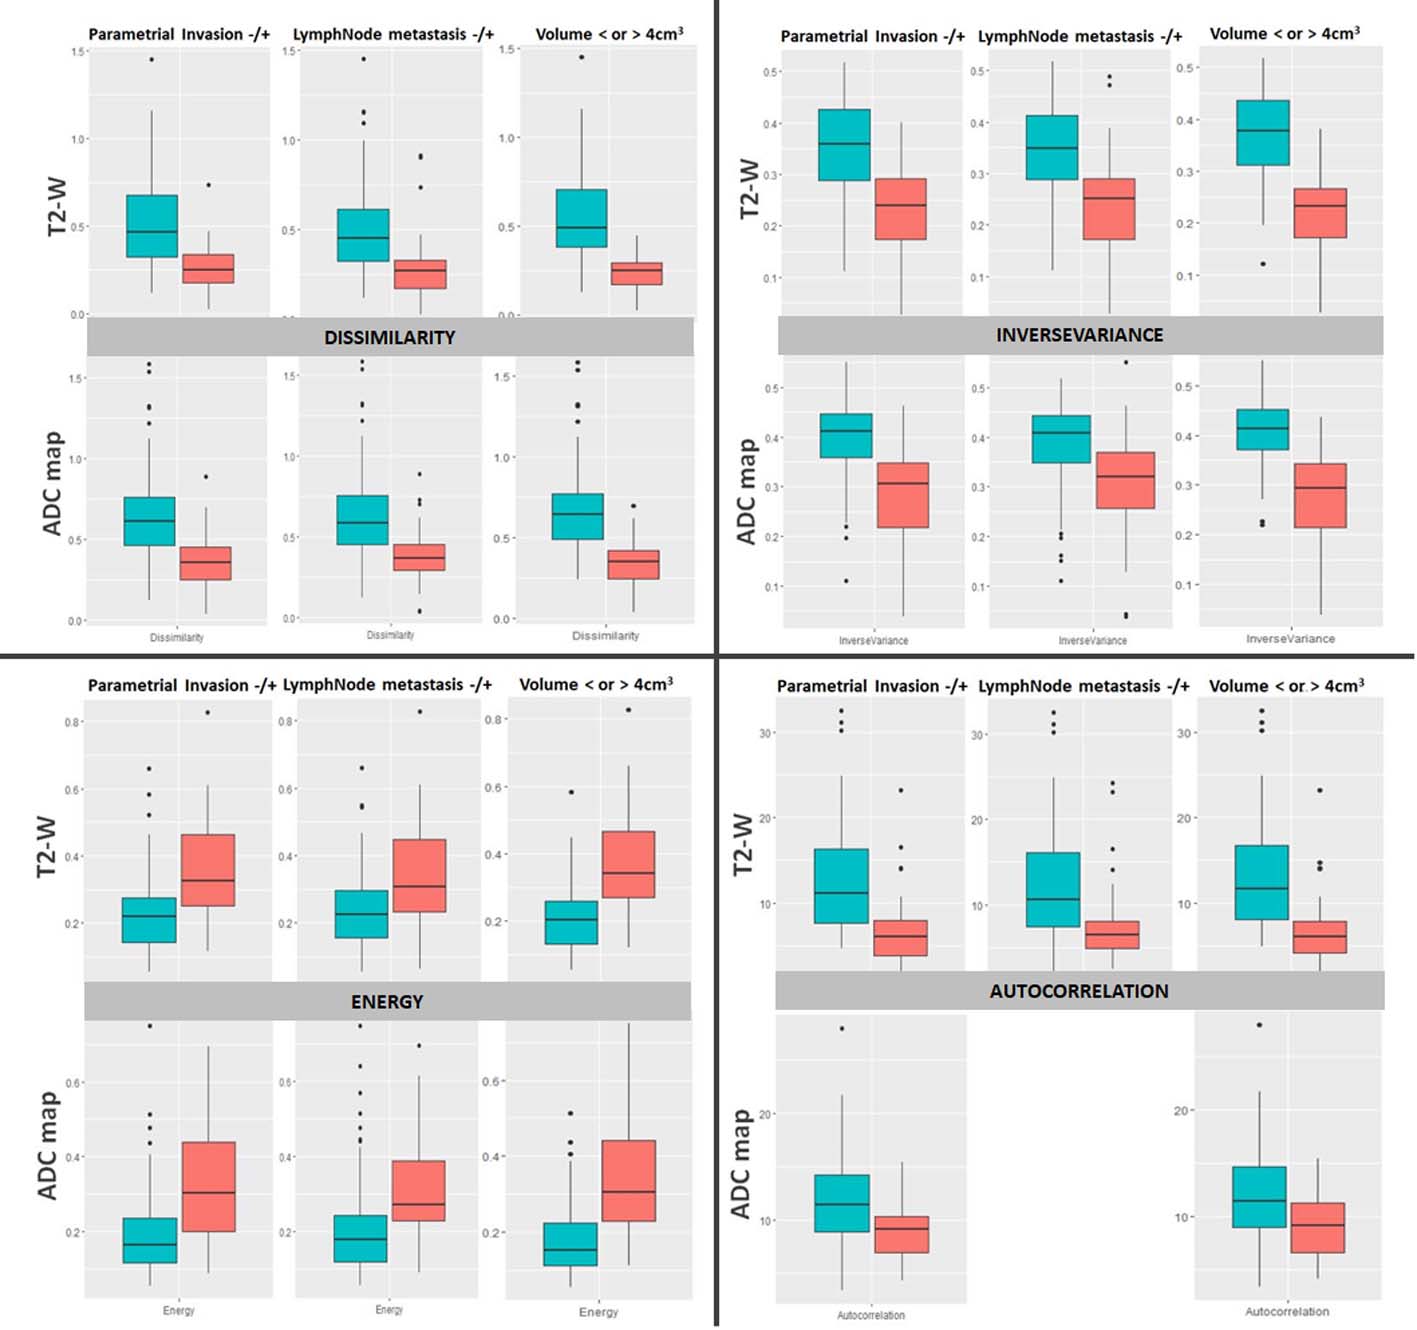
Of 22 Haralick texture features, 14 were removed due to correlation leaving 8 features for analysis. These were, Dissimilarity, Energy, InverseVariance, ClusterProminence, ClusterShade, Autocorrelation, InformationalMeasureCorrelation2 and Correlation. After Bonferroni correction, 7 texture features on T2-W images and 6 features on ADC maps remained significant for volume, whereas for parametrial invasion and lymph node metastasis 5 texture features remained significant (Table 1).Dissimilarity, Energy and InverseVariance showed best separation of these groups (Figure 2).
For tumors <4.19 cm3, linear regression fits of feature values of Dissimilarity, InverseVariance and Energy with volume showed a weak correlation (T2-W Dissimilarity r2=0.41, InverseVariance r2=0.42, Energy r2=0.22, p<0.0001 for all; ADC Dissimilarity r2=0.30, InverseVariance r2=0.31, Energy r2=0.21, p<0.0001 for all). Using the 1 standard deviation value from the good prognosis group as a threshold for discriminating likely spread/metastasis indicated that in tumors <4.19 cm3, radiomic features of poor prognosis from T2-W images were evident at 1.8±0.2 cm3 (1.6 cm3 [Dissimilarity], 2.0 cm3 [InverseVariance], 1.8 cm3 [Energy]) and from ADC maps at 1.8±0.06 cm3 (1.8 cm3 [Dissimilarity], 1.8 cm3 [InverseVariance], 1.7 cm3 [Energy]).
Discussion and Conclusions
Key radiomic features that distinguish tumors with poor clinical features (volume, parametrial invasion lymph node metastasis) were common to all 3 clinical scenarios as expected, as increasing tumor volume risks parametrial invasion and lymph node metastasis. However, this data confirms that these specific radiomic features are important as tumors grow, spread locally and metastasise. For low volume tumors <2cm diameter (4.19 cm3) considered eligible for trachelectomy, however, this also indicates that textural features tend towards a phenotype that is likely to spread and metastasize when tumours are ~1.8 cm3, which is lower than the cut-off normally considered for this fertility-sparing procedure. It may well be that above a surgically assessed diameter of 1.5 cm (equivalent to a volume of 1.8 cm3), it is particularly important to consider other factors- pathological, clinical and social- when making a decision/ counselling a patient for trachelectomy.Acknowledgements
CRUK and EPSRC support to the Cancer Imaging Centre at ICR and RMH in association with MRC and Department of Health C1060/A10334, C1060/A16464 and NHS funding to the NIHR Biomedical Research Centre and the Clinical Research Facility in Imaging.References
1. Cibula D, Pötter R, Planchamp F et al (2018) The European Society of Gynaecological Oncology/European Society for Radiotherapy and Oncology/European Society of Pathology guidelines for the management of patients with cervical cancer. Radiotherapy and Oncology 127:404-416
2. Roh HJ, Kim KB, Lee JH, Kim HJ, Kwon YS, Lee SH (2018) Early Cervical Cancer: Predictive Relevance of Preoperative 3-Tesla Multiparametric Magnetic Resonance Imaging. Int J Surg Oncol 2018:9120753
3. Hou Z, Li S, Ren W, Liu J, Yan J, Wan S (2018) Radiomic analysis in T2W and SPAIR T2W MRI: predict treatment response to chemoradiotherapy in esophageal squamous cell carcinoma. J Thorac Dis 10:2256-2267
4. Wang Q, Li Q, Mi R et al (2019) Radiomics Nomogram Building From Multiparametric MRI to Predict Grade in Patients With Glioma: A Cohort Study. J Magn Reson Imaging 49:825-833
5. Wormald BW, Doran S, D’Arcy et al Characterising early stage cervical cancer using radiomic features derived from T2- and diffusion-weighted images: a potential prognostic tool in surgical management? Proc ISMRM 2019 #2363
6. Wormald BW, Doran SJ, Ind TEJ Ind, D’Arcy J, Petts J, deSouza NM. Radiomic features of cervical cancer on T2- and diffusion-weighted MRI: Prognostic value in low-volume tumors suitable for trachelectomy. Gyn Onc (in press)
Figures