0264
Proof-of-principle for endogenous signal classification towards voxel-wise tumor detection using statistical machine learning1Department of Neuroradiology, Heidelberg University Hospital, Heidelberg, Germany, 2Department of Physics and Astronomy, University of Heidelberg, Heidelberg, Germany, 3Molecular Mechanisms of Tumor Invasion (V077), German Cancer Research Center (DKFZ), Heidelberg, Germany, 4Department of Neurology, Heidelberg University Hospital, Heidelberg, Germany, 5Department of Radiology (E010), German Cancer Research Center (DKFZ), Heidelberg, Germany, 6Clinical Cooperation Unit Neuroimmunology and Brain Tumor Immunology, German Cancer Research Center (DKFZ), Heidelberg, Germany
Synopsis
Based on the microvasculature of entire healthy and tumor-bearing mouse brains, imaged with high-resolution fluorescence microscopy, the transverse relaxation process within virtual MRI voxels was simulated. Extended parametrizations of the non-Lorentzian signal decay were used to train support vector machine and random forest classifiers to differentiate healthy brain and tumor voxel signals. A proof-of-principle is presented with U87 and GL261 glioblastoma at different SNR levels. This automated workflow enables the in-silico development of specialized MRI sequences to maximize classification accuracy with minimal NMR measurements for experimental analogies.
Introduction
Intravascular deoxyhemoglobin naturally causes microscopic field inhomogeneities in an external magnetic field that lead to deviations of the transverse relaxation process with T2 and T2* from linear exponential decay1. MR signal decay properties in biological tissue are therefore influenced by the microvascular architecture, which can be used to describe vascular remodeling in glioblastoma multiforme (GBM)2. We now present a software framework that trains statistical classifiers to interpret signals for single-voxel tumor detection using simulated MR signal decays. We demonstrate the feasibility of learning endogenous contrasts to classify microvascular pathologies.Methods
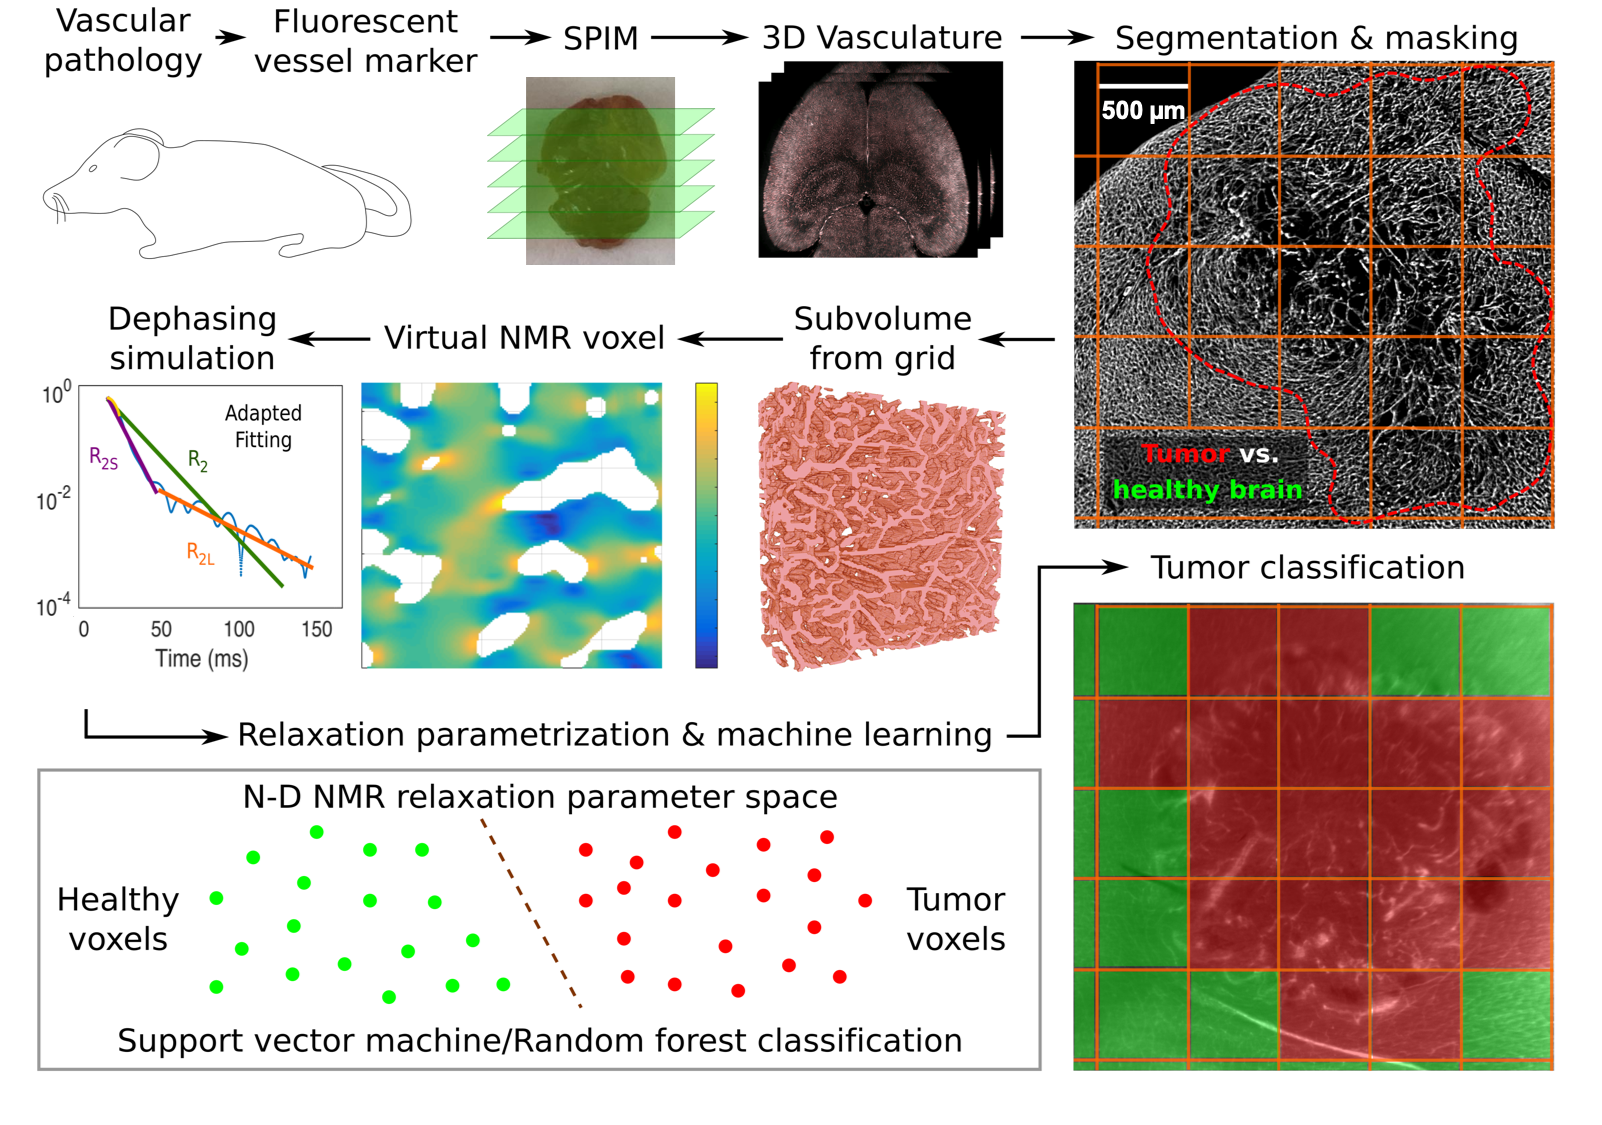
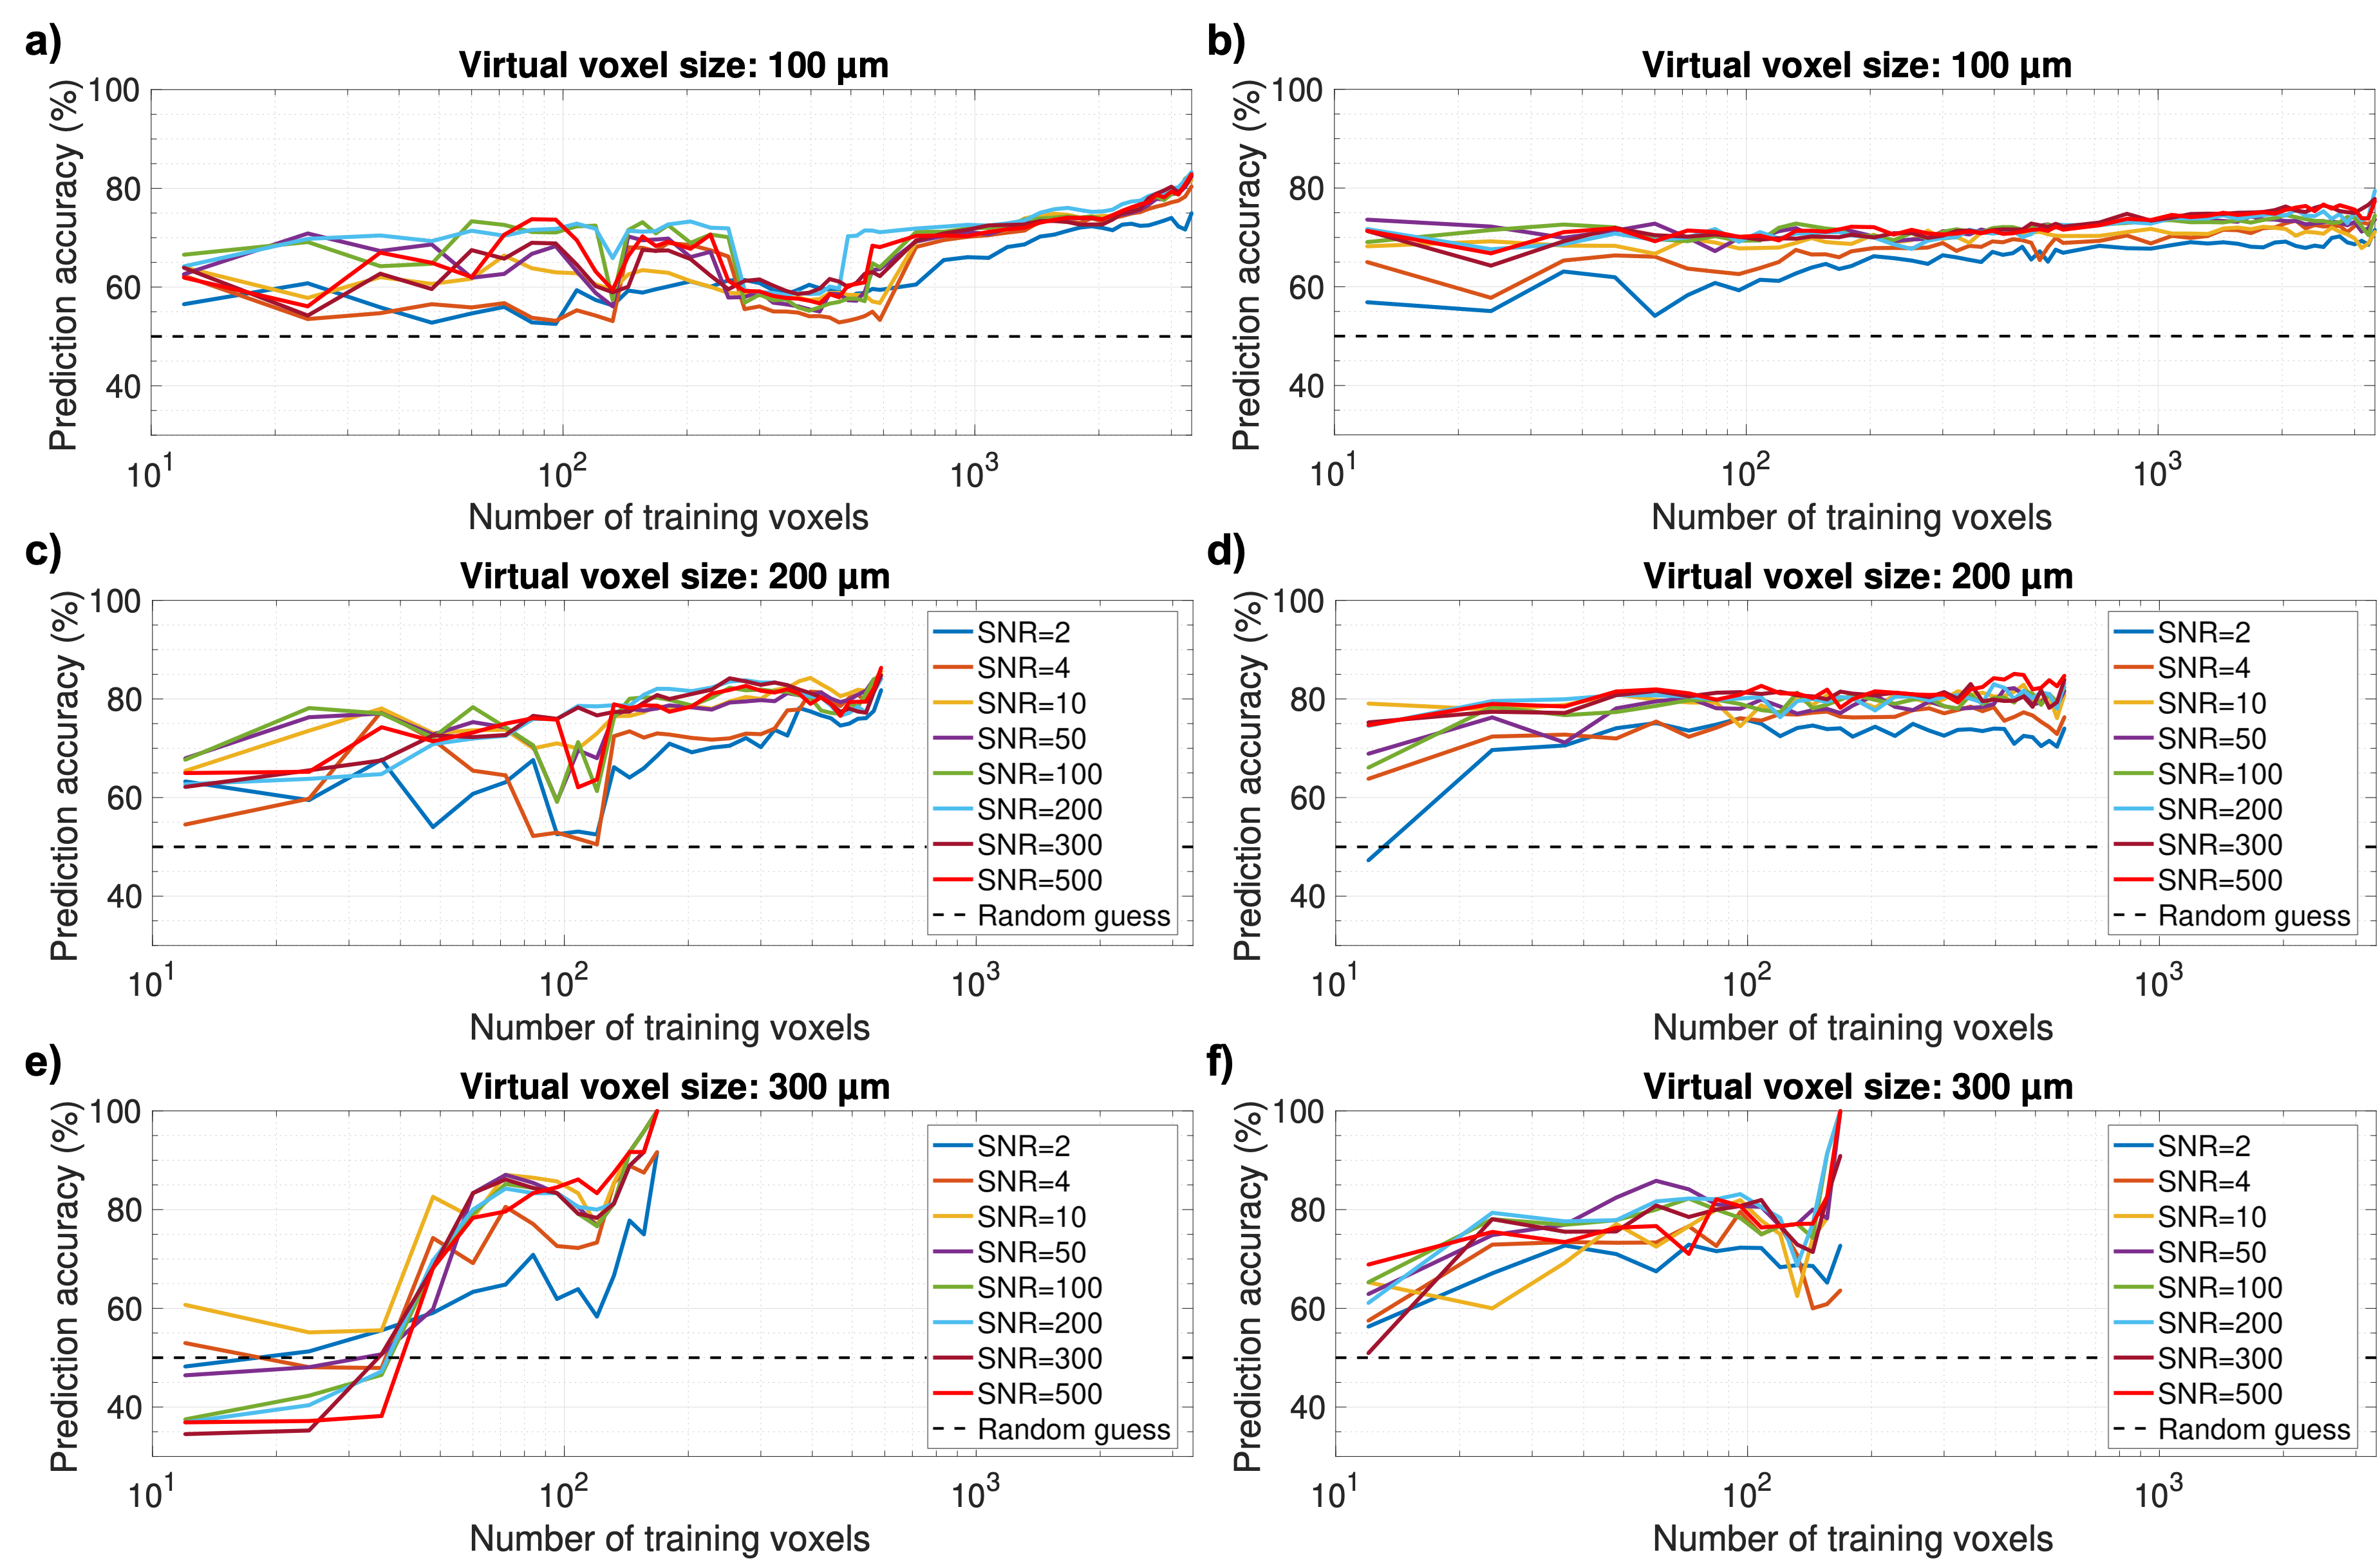
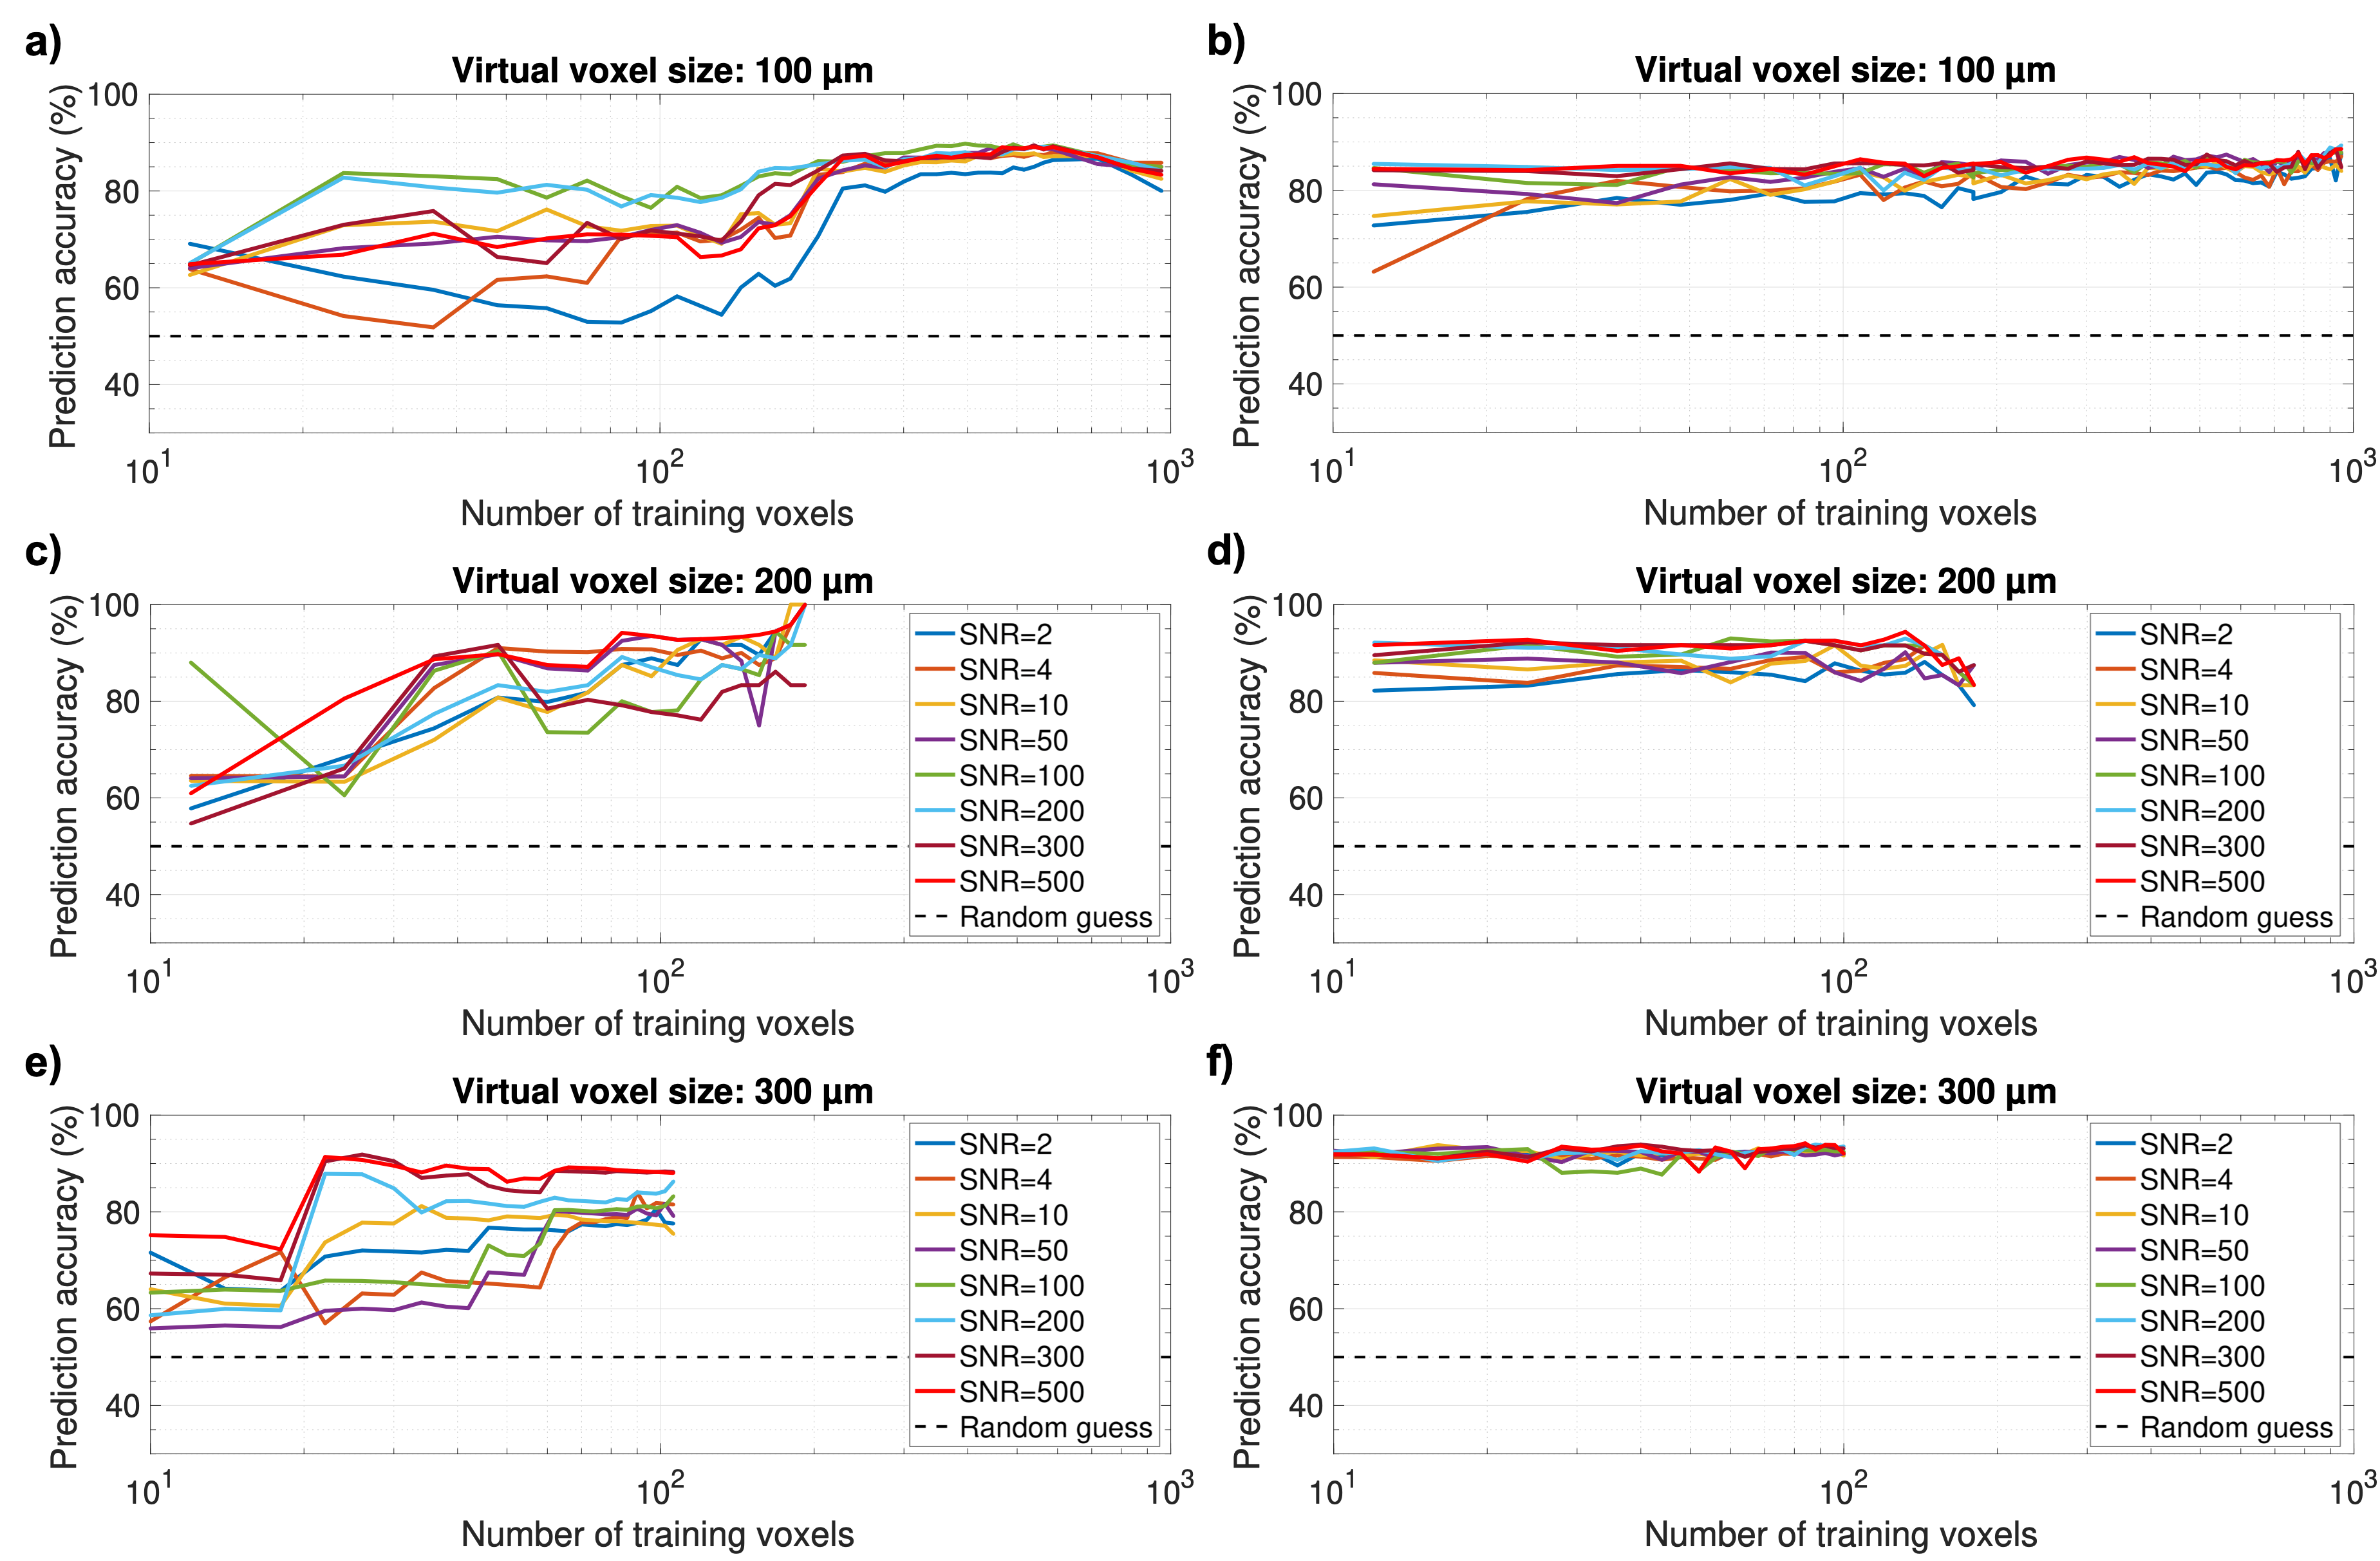
The brain vasculature of n=3 healthy NMRI nu/nu mice, as well as, respectively, n=6 U87 GBM- and GL261 GBM-bearing mice was imaged using single plane illumination microscopy (SPIM) upon fluorescent endothelial marking through Lectin-FITC injection and successful tissue clearing at an in-plane resolution of 3.25 µm and 5 µm between planes3. Vessel segmentation was performed in 3D using ilastik4, noise removal was applied in Matlab R2018b (Mathworks, Natick, MA, USA), and manually drawn masks delineated tumor tissue. An MPI-parallelized program in Python 3 automatically processed cubic subvolumes as virtual MRI voxels (100, 200, and 300 µm side length after 60% volume shrinkage from clearing): sub-voxel field inhomogeneities from paramagnetic blood susceptibility were calculated by a 3D dipole convolution with the vasculature5, assuming constant blood oxygenation Y=60% and hematocrit Hct=0.4 at B0=3 Tesla6, and spin dephasing during free induction decay was simulated in C++11 with OpenMP parallelization, considering water diffusion (D=1 µm2/ms) in the extravascular space, with time steps dt=0.1 ms up to t=1 s. The resulting signal attenuation was parametrized with linear least squares fits to the logarithm of the magnetization magnitude, assuming Lorentzian (t), Gaussian (t2), and monomial (tb) time dependence for the full time range, as well as separately for the short- and long-time regimes (before and after t=200 ms). For each virtual voxel signal, the fit parameters and respective sum of squared residuals were saved as measurable features to characterize the transverse decay. These scalar features were used to train support vector machine (SVM) and random forest classifiers, using open-source software from the LibSVM library7 and Scikit-Learn8, to differentiate healthy brain from tumor voxel signals (see Fig. 1 for a workflow summary). The model parameters for classification were optimized in quick 3-fold cross validation grid searches on the respective training signals. Different training set sizes were used to predict U87 and GL261 tumor tissue on previously unused voxels, also from previously blinded mice, with Rician noise added to the magnitude signal at signal to noise ratios (SNR) between 2 and 500, defined using the first signal time point at t=0.1 ms.Results
All training scenarios showed that stable classification accuracies around 75-80% could be attained for the U87 GBM model with feasible training set sizes on the order of 102 (Fig. 2). For the GL261 tumor model, stable accuracies above 90% could be maintained with very little training data on the order of 10 signals (Fig. 3), especially with random forests. While SVM classification suffered at SNR≤4 for small training sets, predictions improved even with very bad SNR at higher training numbers and random forests performed very robustly under SNR variation in all cases. Our results also show that the T2*-effects of tumor-induced vessel remodeling are more pronounced in larger MRI voxels (Figs. 2-3).Discussion
In all cases, stable peak prediction accuracies were quasi identical using SVM and random forest classifiers, which is indicative of the valuable information within the dephasing process, which can be parametrized through diversified fitting. Random forest classifiers performed better in our initial, fully reproducible tests, reaching stable prediction accuracies with less training data and showing higher resilience to strong SNR variations. While our simulations were performed with simplified constant blood oxygenation, these results strongly motivate experimental analogies and modeling extensions to the numerical framework to include more physiological aspects.Conclusion
Extended sampling of the T2* relaxation process and adequate fitting shows the potential to facilitate machine-aided voxel-wise interpretations of the MRI signal without a need for exogenous contrast agents. Through prior training with transverse relaxation signals and correlated ground-truth measurements of tumor tissue, the T2* evolution may serve as an abstract, learnable contrast to classify vascular pathology. In experimental analogies, hypercapnic and hyperoxic conditions may help emphasize the vascular influence on the signal decay9. With the developed software framework, suited MRI sequences and oxygenation manipulations can be explored in silico to optimize experimental design numerically.Acknowledgements
The authors gratefully acknowledge support with computational resources through the HPC-research cluster bwForCluster MLS&WISO by the state of Baden-Württemberg through bwHPC and the bwHPC-C5 project, as well as the German Research Foundation (DFG) through grant INST 35/1134-1 FUGG, as well as the data storage service SDS@hd, supported by the Ministry of Science, Research and the Arts Baden-Württemberg (MWK) and the DFG through grant INST 35/1314-1 FUGG and INST 35/1503-1 FUGG.
References
1. Dickson JD, Ash TWJ, Williams GB, et al. Quantitative phenomenological model of the BOLD contrast mechanism. J Magn Reson. 2011;212:17-25.
2. Hahn A, Kruewel T, Bode J, et al. Vascular-induced spin dephasing in real vascular networks reveals useful decay characteristics to differentiate glioblastoma from healthy brain tissue. Proc Int Soc Magn Reson Imaging. 2018; Abstract 1548.
3. Breckwoldt MO, Bode J, Sahm F, et al. Correlated MRI and Ultramicroscopy (MR-UM) of Brain Tumors Reveals Vast Heterogeneity of Tumor Infiltration and Neoangiogenesis in Preclinical Models and Human Disease. Front Neurosci. 2019;12:1004.
4. Sommer C, Straehle C, Koethe U, Hamprecht FA. ilastik: Interactive Learning and Segmentation Toolkit. In: Proc IEEE Int Symp Biomed Imaging. 2011:230-233.
5. Pathak AP, Ward BD, Schmainda KM. A novel technique for modeling susceptibility-based contrast mechanisms for arbitrary microvascular geometries: The finite perturber method. Neuroimage. 2008;40:1130-1143.
6. Spees WM, Yablonskiy DA, Oswood MC, Ackerman JJ. Water proton MR properties of human blood at 1.5 Tesla: magnetic susceptibility, T1, T2, T2*, and non-Lorentzian signal behavior. Magn Reson Med 2001;45:533-542.
7. Chang C-C, Lin C-J. LIBSVM: A library for support vector machines. ACM Trans Intell Syst Technol. 2011;2:27:1-27:27.
8. Pedregosa F, Varoquaux G, Gramfort A, et al. Scikit-learn: Machine Learning in Python. J Mach Learn Res. 2011;12:2825-2830.
9. Jochimsen TH, Möller HE. Increasing specificity in functional magnetic resonance imaging by estimation of vessel size based on changes in blood oxygenation. Neuroimage. 2008;40(1):228-236.
Figures