0262
Accelerated T2 Mapping of the Lumbar Intervertebral Discs: Robust Quantification in Clinically Feasible Acquisition Times1High Field MR Centre, Department of Biomedical Imaging and Image-guided Therapy, Medical University of Vienna, Vienna, Austria, 2Department of Orthopedics and Trauma Srugery, Medical University of Vienna, Vienna, Austria, 3Advanced Clinical Imaging Technology, Siemens Healthcare, Lausanne, Switzerland, 4Department of Radiology, Lausanne University Hospital and University of Lausanne, Lausanne, Switzerland, 5LTS5, Ecole Polytechnique Fédérale de Lausanne (EPFL), Lausanne, Switzerland, 6Department of Radiology, University Hospital and University of Lausanne, Lausanne, Switzerland, 7Department of Biomedical Imaging and Image-guided Therapy, Medical University of Vienna, Vienna, Austria
Synopsis
The physiological biochemical state of the intervertebral disc (IVD) allows for passive water-storing capabilities because of a high concentration of glycosaminoglycans (GAG) and an inherent structural integrity. T2 mapping can quantitatively assess the IVD’s water content and GAG concentration, but a typical 2D multi echo spin echo (MESE) sequence suffers from clinically prohibitive scan times. To resolve this, we compared the MESE sequence against GRAPPATINI, an accelerated sequence combining parallel imaging and a model-based reconstruction for T2 quantification which uses undersampling to shorten the scan time from 13:18 to 2:27 minutes.
Introduction
Conventional T2 mapping of the lumbar spine is usually performed using a 2D MESE sequence sampling multiple contrasts at consecutive, equally spaced echo times (TE).1 The reconstruction fits a mono-exponential signal decay in each voxel to calculate T2 values. With desired in-plane resolutions higher than 1x1 mm, limiting specific absorption rate (SAR) restrictions due to the repeated 180° refocusing pulses, and with the repetition times (TR) having to be long to mitigate T1 effects, the acquisition times become too long for clinical routine. In their physiological state, intervertebral discs contain a very high amount of water due to a high concentration of GAGs in the nucleus pulposus while consisting only of dense fibers in the outer regions of the annulus fibrosus. With ongoing degeneration (e.g. annular fissures or disc herniation), this integrity decays. Changes in the early stage of the disease progression remain invisible on morphological sequences, however, may be detectable using quantitative imaging. This renders T2 mapping of the IVD a desirable biomarker in clinical routine.2,3 We investigated GRAPPATINI4, a T2 mapping sequence combining undersampling, model-based reconstruction and parallel imaging to offer clinically feasible scan times and compare the results with conventional MESE in 58 individuals. Additionally, we compared the T2 values in a phantom experiment using a single spin echo acquisition.Methods and Materials
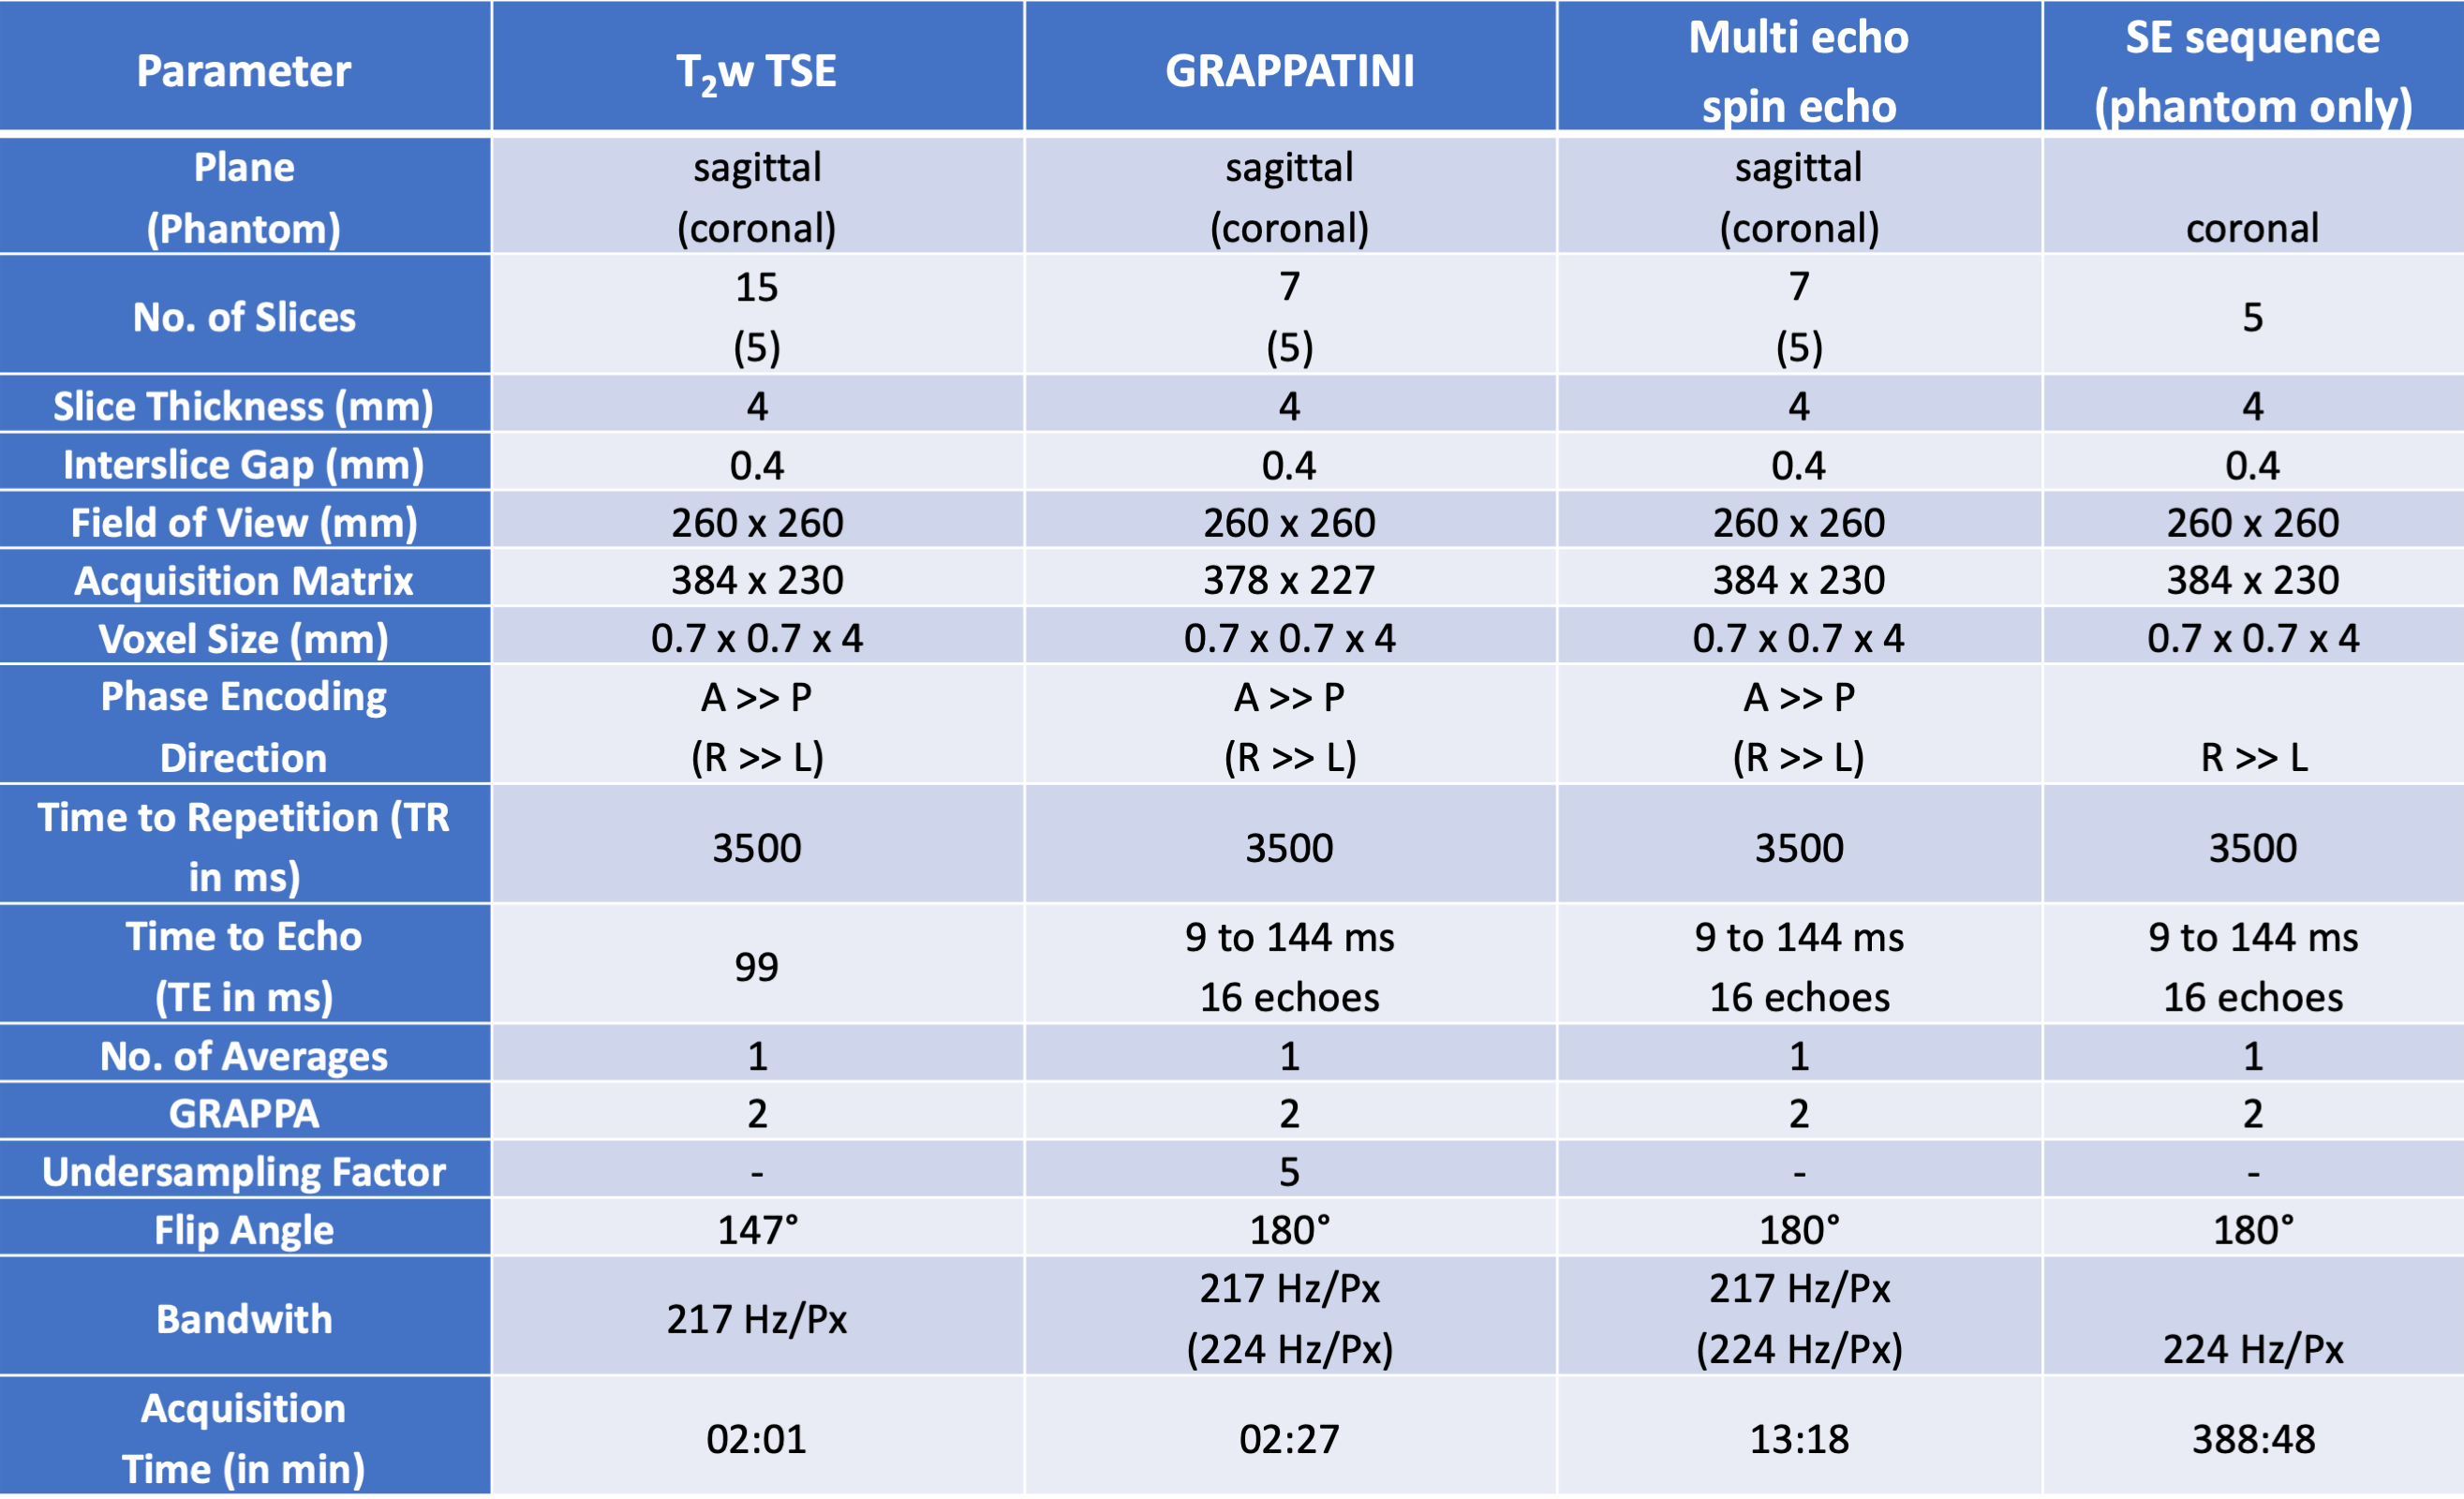
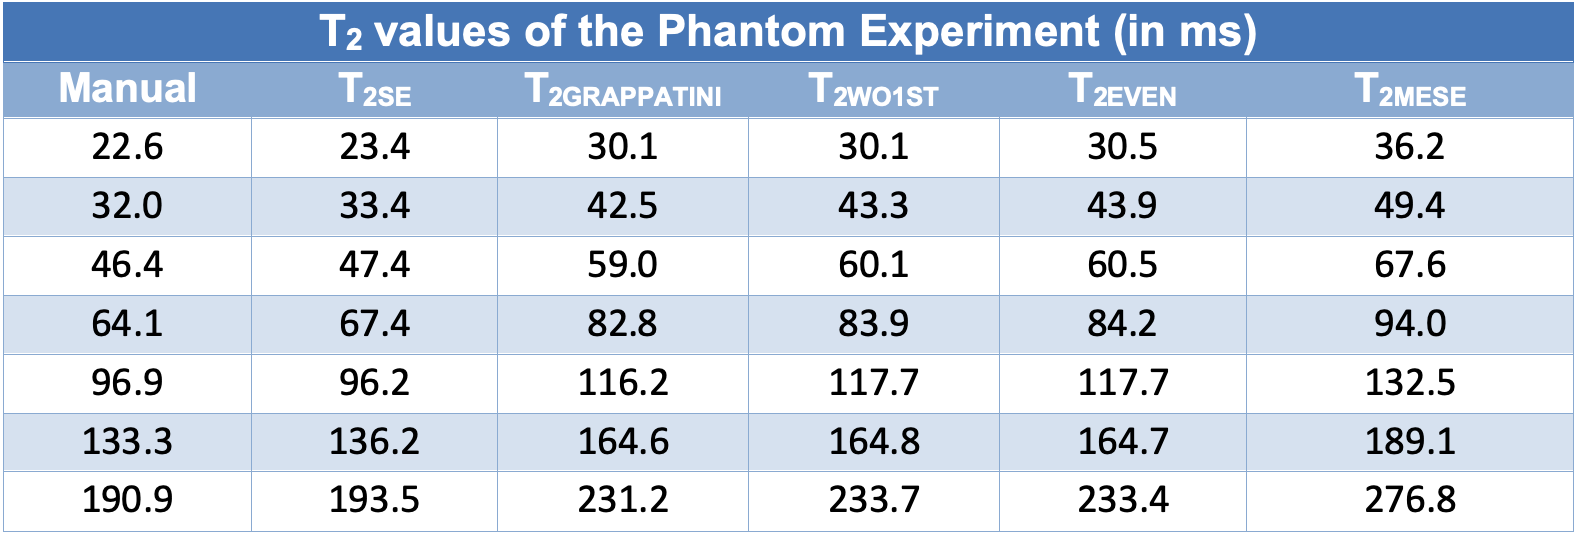
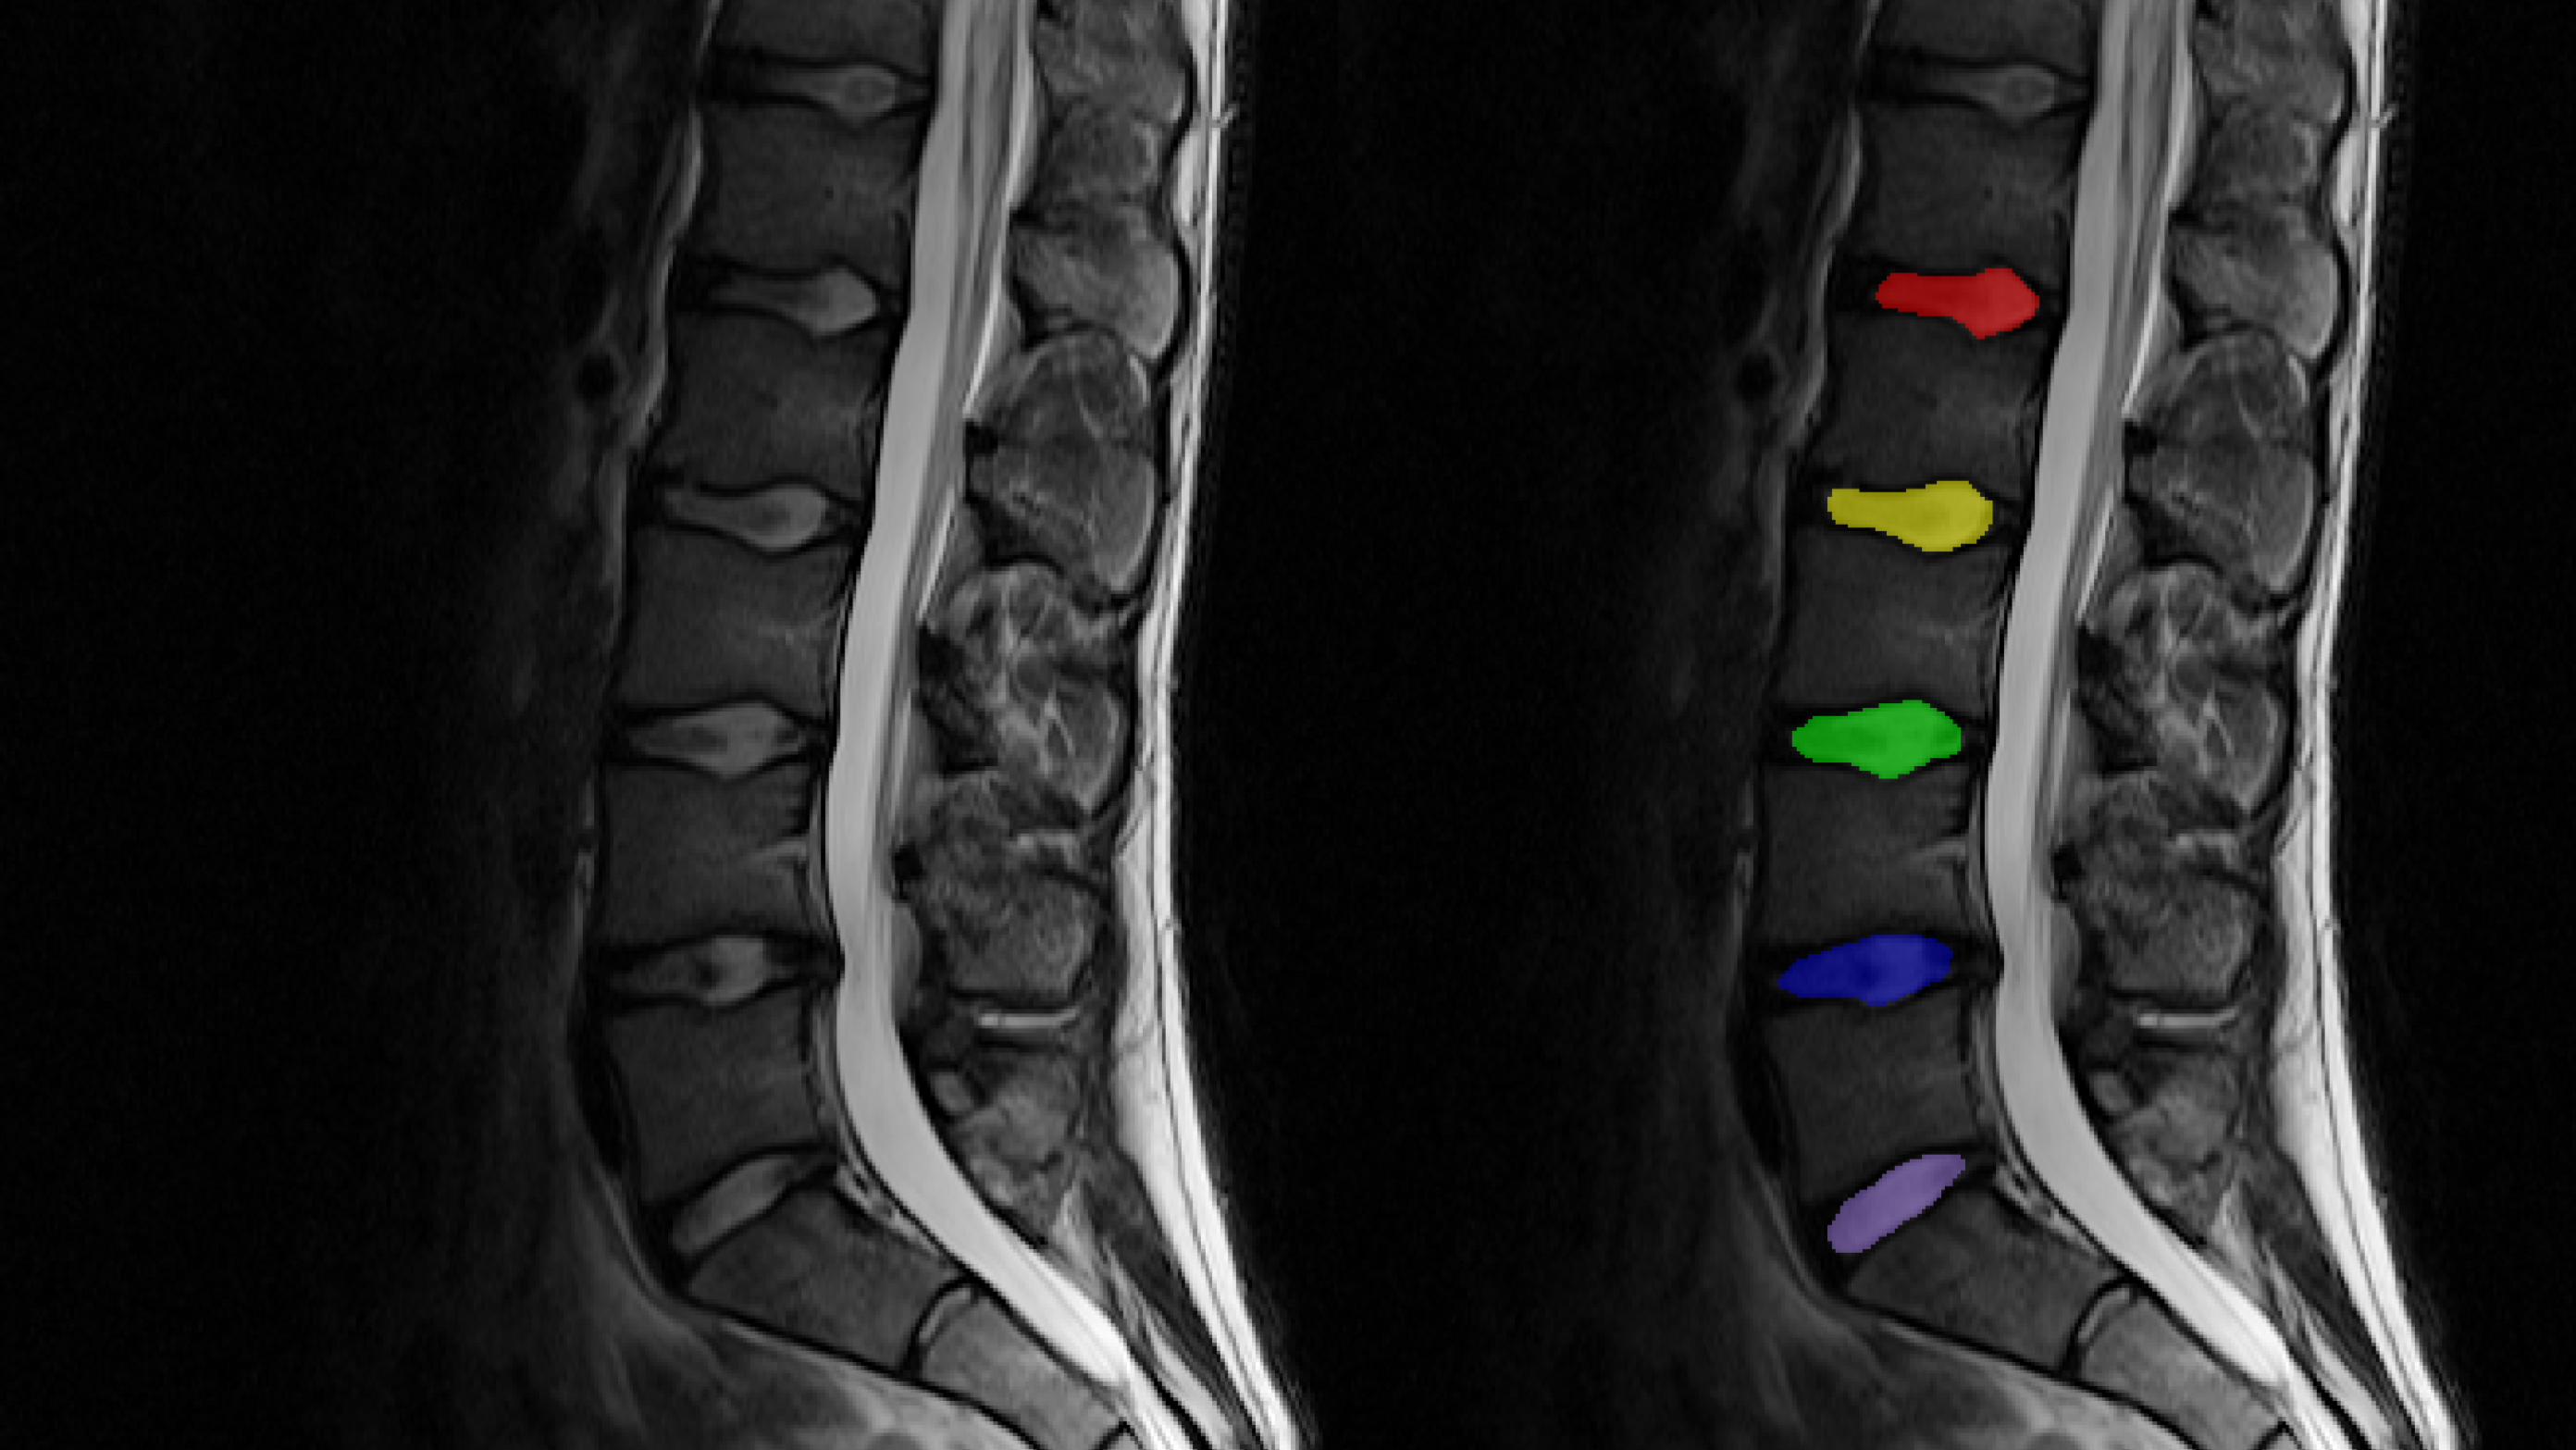
After written and informed consent was obtained, 58 individuals (25 female, mean age 23.3±8.0 years) were examined at 3T (MAGNETOM Prismafit, Siemens Healthcare, Erlangen, Germany) using a 32-channel spine coil. After a morphological imaging protocol and at least 30 minutes of resting time, sagittal T2 maps were acquired with the MESE sequence (13:18 min) and the GRAPPATINI prototype sequence (2:27 min) in direct succession with equal parameters but with ten-fold undersampling for GRAPPATINI. The same experiment was repeated in a qMRI NIST phantom (High Precision Devices, Inc., Colorado, USA). Additionally, a standard single echo spin echo sequence was acquired with matching TEs to compute reference T2 maps. The parameters are listed in Table1. Additionally, the MESE data was used to compute T2 maps after discarding the first echo (WO1ST) and only using even echoes (EVEN) to investigate the amount of overestimation which is caused when the first echo is used in the fit and to assess the impact of stimulated echoes in this experiment. GRAPPATINI was conducted with an undersampling factor of five and an additional two-fold GRAPPA undersampling, effectively resulting in ten-fold undersampled k-space data. After filling the skipped lines using the GRAPPA kernels, the model-based reconstruction calculated T2 maps as previously reported.5 The phantom experiment was evaluated in regions of interest (ROI) which were manually segmented on a morphological T2 contrast. The ROIs were copied to the obtained T2 maps. A comparison of T2 values can be found in Table2 taking into account the value ranges of interest (20-200ms T2). A manual segmentation was done on four central slices of a sagittal T2-weighted Turbo Spin Echo (TSE) using ITK-SNAP, labeling the nucleus pulposus of every lumbar IVD with an individual label.6 After successful co-registration of the TSE to the MESE and GRAPPATINI sequences, the same transformation was applied to the saved segmentations in order to apply them in the native space of the respective T2 maps. An example segmentation is illustrated in Figure1. Paired t-tests and a Pearson’s correlation coefficient analysis were conducted using SPSS version 25 for macOS (IBM, NY, USA).Results
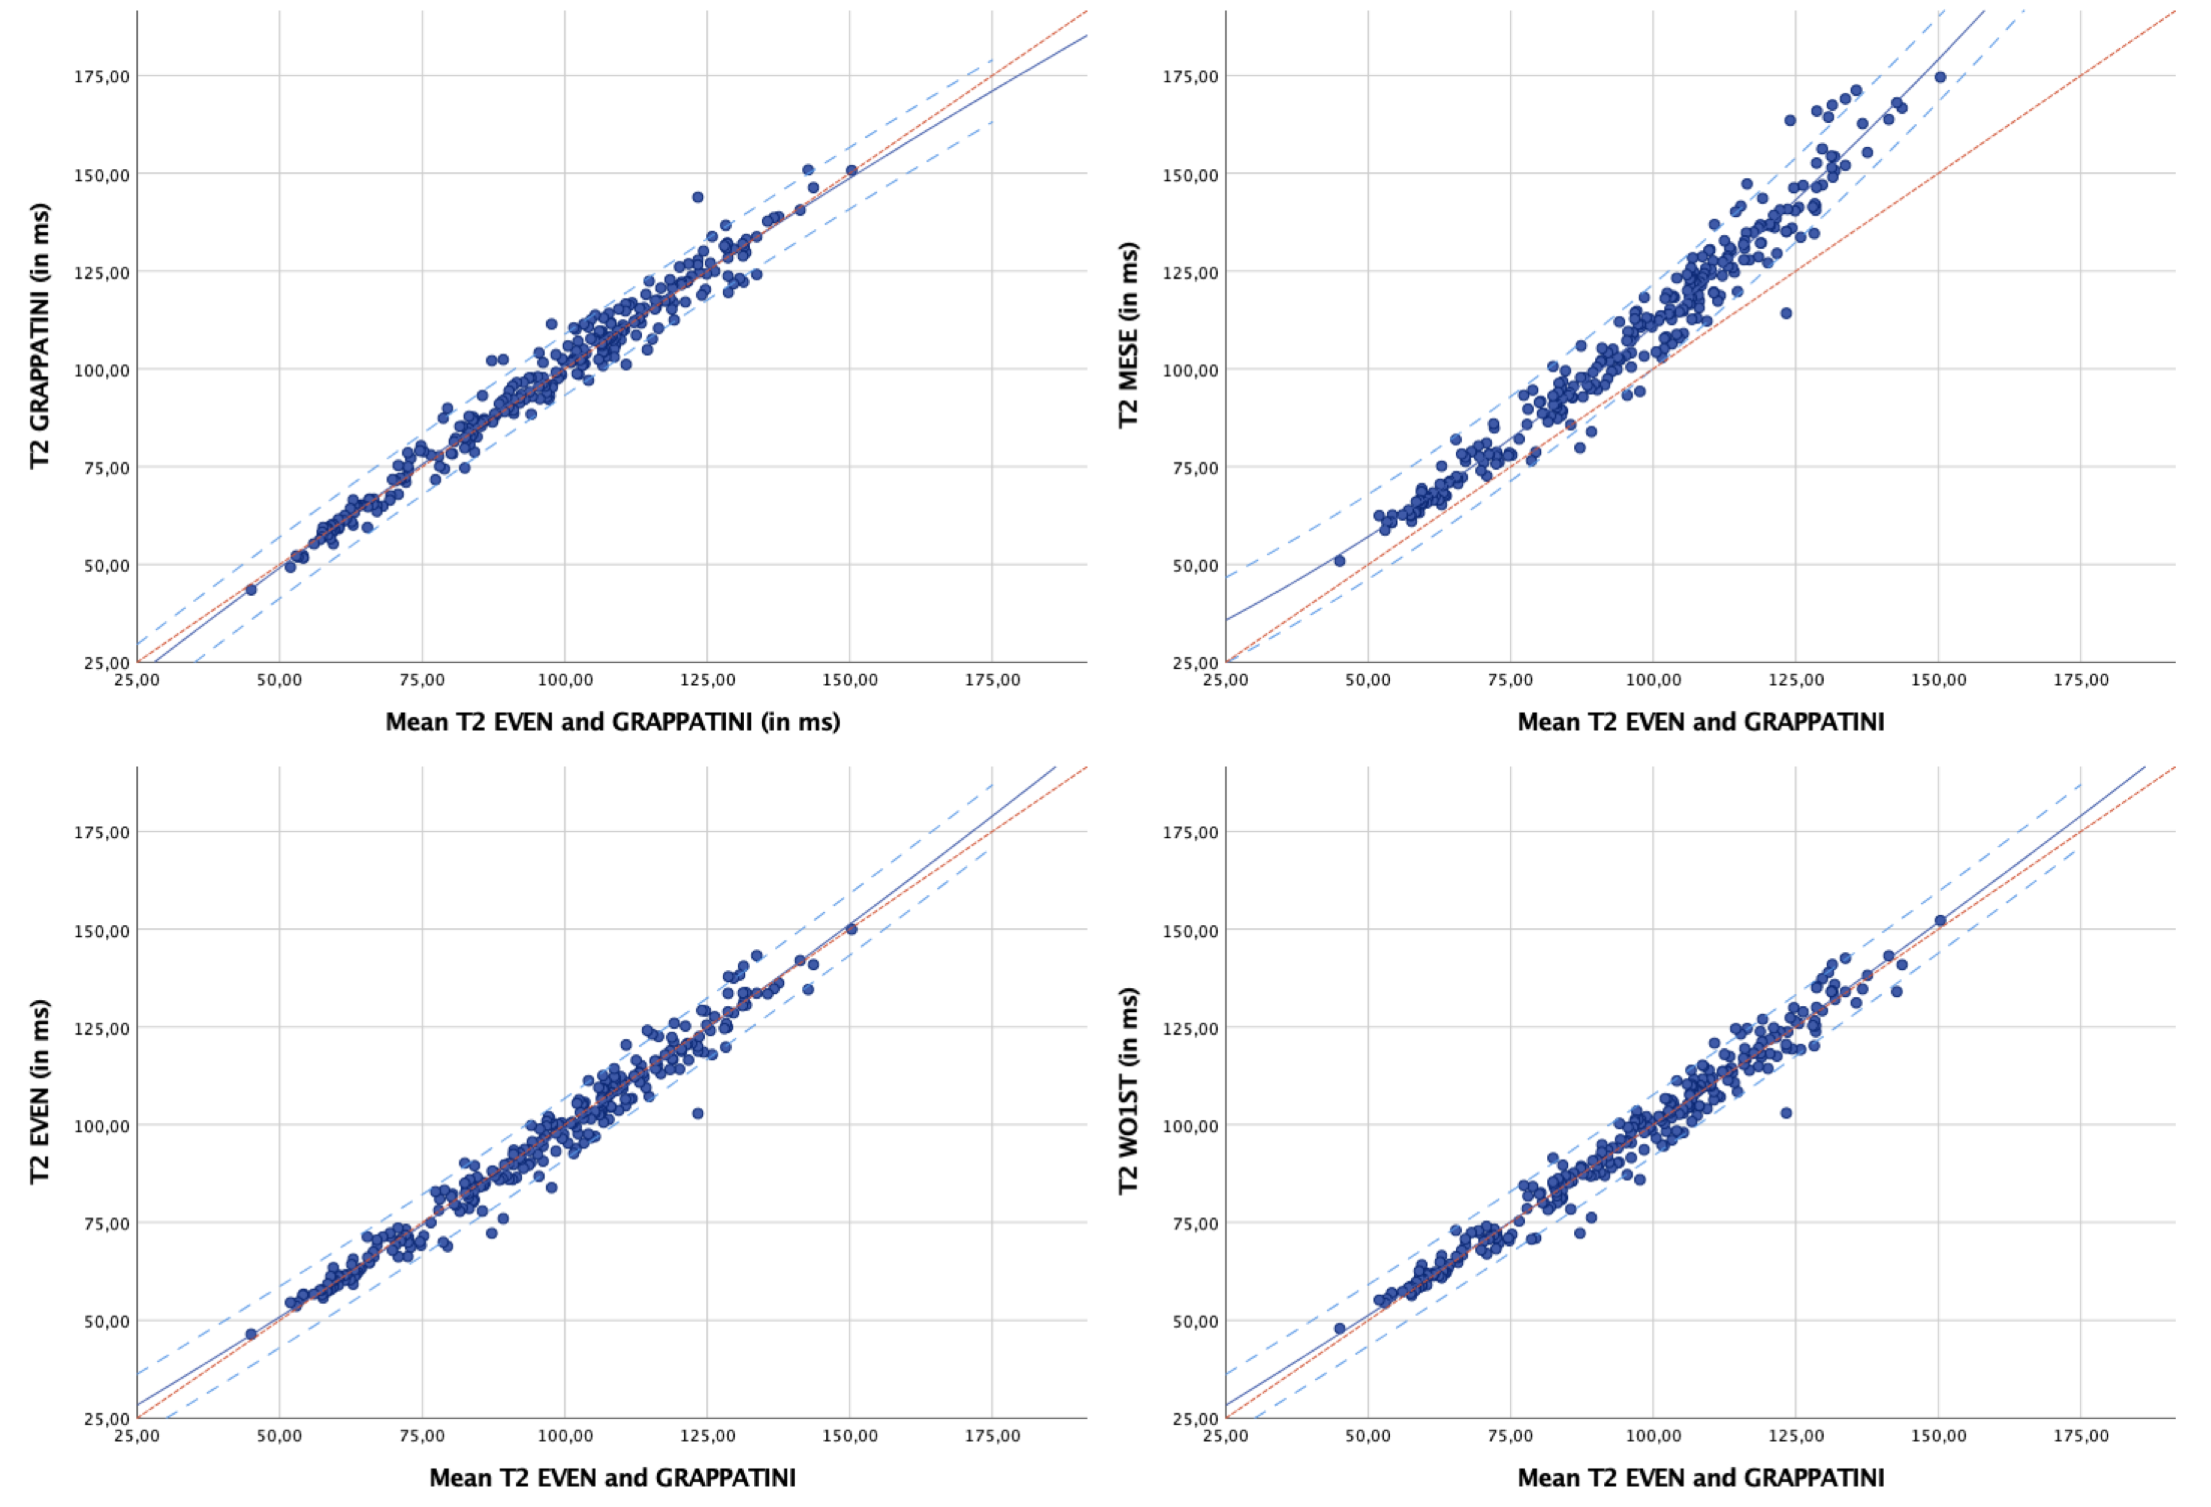
In the phantom experiment, compared to the single echo spin echo sequence, the most similar T2 measurements were achieved with the T2GRAPPATINI with a median absolute deviation (MAD) from the SE reference values of 15.3ms. T2WO1ST showed a MAD of 16.5ms, followed by T2EVEN with 16.7ms. T2MESE showed the highest MAD with 26.5ms. Comparing the mean T2 values of the NP in the assessed individuals, mean T2GRAPPATINI was 96.2±23.4ms differing significantly from T2EVEN with 94.9±23.1ms and T2MESE (both p<0.001) with 107.0±27.8ms, but not T2WO1ST with 95.7±23.2ms (p=0.375). T2MESE had a higher difference to T2EVEN (12.1ms; 95%CI 11.4-12.7) and T2WO1ST (10.9ms; 95%CI 9.7-12.0), than T2EVEN and T2GRAPPATINI (1.2ms; 95%CI 0.3-2.1) or T2WO1ST and T2GRAPPATINI (0.4 ms, 95%CI -0.5-1.3), especially in higher values. T2MESE correlated with the other sequences as follows: T2EVEN (rsp=0.995,p<0.001), T2WO1ST (rsp=0.994,p<0.001) and T2GRAPPATINI (rsp=0.934,p<0.001). Figure2 illustrates this graphically with the respective T2 values plotted against the mean of T2EVEN and T2GRAPPATINI, with increasing overestimation of T2MESE.Discussion
This analysis shows that GRAPPATINI offers a feasible way to shorten the acquisition time for reliable T2 mapping in clinical routine from 13:18 to 2:27 without compromising T2 accuracy. In the illustrated phantom experiment, GRAPPATINI even showed the best agreement with the gold standard SE sequence in the T2 value range of the nucleus pulposus. Of note, the main contribution to the MAD originates from a systematic bias caused by stimulated echoes. In the analysis of 58 individuals the difference between T2EVEN and T2GRAPPATINI was smaller than between T2EVEN and T2MESE, with the latter being calculated from the same k-space data.Conclusion
GRAPPATINI enables accurate T2 mapping in clinically feasible acquisition times for the nucleus pulposus of the lumbar intervertebral disc. Clinical application in the early assessment of degenerative disc might complement routine examinations at 3T.Acknowledgements
No acknowledgement found.References
1. Carr, H. Y. & Purcell, E. M. Effects of diffusion on free precession in nuclear magnetic resonance experiments. Phys. Rev. (1954). doi:10.1103/PhysRev.94.630
2. Blumenkrantz, G. et al. In vivo 3.0-tesla magnetic resonance T1rho and T2 relaxation mapping in subjects with intervertebral disc degeneration and clinical symptoms. Magn Reson Med 63, 1193–1200 (2010).
3. Marinelli, N. L., Haughton, V. M., Munoz, A. & Anderson, P. A. T2 relaxation times of intervertebral disc tissue correlated with water content and proteoglycan content. Spine (Phila Pa 1976) 34, 520–524 (2009).
4. Sumpf, T. J., Uecker, M., Boretius, S. & Frahm, J. Model-based nonlinear inverse reconstruction for T2 mapping using highly undersampled spin-echo MRI. J. Magn. Reson. Imaging 34, 420–428 (2011).
5. Hilbert, T. et al. Accelerated T2 mapping combining parallel MRI and model‐based reconstruction: GRAPPATINI. J. Magn. Reson. Imaging (2018).
6. Yushkevich, P. A. et al. User-guided 3D active contour segmentation of anatomical structures: Significantly improved efficiency and reliability. Neuroimage (2006). doi:10.1016/j.neuroimage.2006.01.015
Figures