0261
Can Tumor T1 Serve as Early Response Imaging Biomarker for Neoadjuvant Chemotherapy in Osteosarcoma? A Preliminary Study1Centre for Biomedical Engineering, Indian Institute of Technology, Delhi, New Delhi, India, 2Department of Medical Oncology, Dr. B.R. Ambedkar Institute-Rotary Cancer Hospital (IRCH), All India Institute of Medical Sciences, New Delhi, New Delhi, India, 3Radio Diagnosis, All India Institute of Medical Sciences, New Delhi, New Delhi, India, 4Department of Biomedical engineering, All India Institute of Medical Sciences, New Delhi, New Delhi, India
Synopsis
Histopathological examination is the current gold standard for evaluating tumor response to anti-cancer therapy; though it is possible only after surgery. Non-invasive imaging biomarkers of tumor response to therapy may be useful in optimizing existing treatments improving overall outcome. The spin-lattice relaxation time of water protons (T1) reflects therapeutic changes in tumor and is thus a generic marker of tumor response to therapy. Experimental results showed T1 relaxation time reduces upon successful chemotherapy and thus, a change in tumor T1 may be a non-invasive imaging marker of chemo-sensitivity and chemotherapy response.
Purpose
Histopathological examination is the current gold standard for evaluating tumor response to chemotherapy; though it is possible only after surgery. Early biomarkers of tumor response to therapy are useful in optimizing existing treatments improving overall outcome. The spin-lattice relaxation time of water protons (T1) is an intrinsic tissue property1. Studies have suggested that a decrease in T1 reflects tumor hypocellularity and is thus a generic marker of tumor response to therapy that should be an important aid to oncological evaluation2,3. Purpose of the study was to evaluate the role of changes in T1 values in the course of chemotherapy in evaluating response in Osteosarcoma with correlation to histopathological response.Methods
Dataset: Total thirty-two patients (N=14, Male:Female=8:4, Age=17.8±4.3 years; Metastatic:localized=5:7) with biopsy proven Osteosarcoma were analysed retrospectively. MRI acquisitions were performed using a 1.5T Philips Achieva®MR scanner before neoadjuvant chemotherapy(NACT) (baseline) and after NACT completion(follow-up). Conventional T1-weighted(T1W), T2-weighted(T2W) in axial, sagittal and coronal planes were acquired using Turbo-Spin-Echo sequence with TR/TE=528/10msec and matrix-size=512×512, 384×384 respectively. 3D spoiled gradient recalled echo (SPGR) images were acquired with varying flip angles at 50,100,200&300 with fixed TR=4.1msec and TE=1.9msec, and depending upon tumor sizes, matrix-size was varied from 224×224 to 448×448 and number-of-slices was varied from 152 to 256. All patient undergone surgery after completing NACT. Histopathological necrosis of surgical specimen served as the gold standard for response to NACT;<50% of histological necrosis was considered as chemotherapy No-response (NRes) and ≥50% necrosis was considered as Response (Res).Image Analysis: SPGR signal intensity (SSPGR) is a function of the longitudinal relaxation time T1, repetition time TR, flip angle α, and a factor that is proportional to the equilibrium longitudinal magnetisation M0 and can be described as1,4:
SSPGR = M0(1-K1)Sinα/(1-K1Cosα), where K1 = exp(–TR/T1) [1]
Keeping TR fixed and incrementally increasing flip angle α, T1 values were estimated at baseline and follow-up by non-linear least-square fitting of Equ.[1].
Region of interest(ROI) for tumor at baseline and follow-up and for healthy tissue at baseline were demarcated manually on the evaluated T1 maps with refence to corresponding structural T2-weighted images. Figure1 shows example T2W image, SPGR images at multi-flip angles and estimated T1 map with demarcated ROIs for tumor and healthy tissue from a representative patient. Average T1 was calculated in tumor and healthy tissue and relative percentage change of T1 in tumor from baseline to follow-up (ΔT1) was calculated for each patient.
Statistical Analysis: Average T1 values in tumor and heathy tissue were compared using Nonparametric two-sample Kolmogorov-Smirnov(KS) test. Inter-group statistical significance(p<0.05) of T1 and ΔT1in tumor was tested using KS test and Mann-Whitney-Wilcoxon(MWW) test respectively. Intra-group significant(p<0.05) changes of T1 values from baseline to follow-up were tested using paired t-test. Receiver operating characteristics (ROC) curve analysis was performed evaluating sensitivity(Sn) and Specificity(Sp) of average T1 and ΔT1in identifying Res group.
Image analysis and statistical calculations were performed using an in-house built toolbox in MATLAB® (MathWorksInc.,v2017,Philedelphia,USA)
Results
At baseline, average T1 in tumor and healthy tissue were 824.7±117.3msec and 702.9±51.6msec respectively among all patients and were significantly different (p=0.008). According to Histopathological examination Responder:Non-responder ratio was 7:7. Box and whisker plots in Figure2 showing the distribution of T1 values among Res and NRes groups at baseline and follow-up. Average T1 values in tumor at baseline and follow-up and ΔT1 among both the response groups are presented in Table1. At baseline, average T1 in tumor was significantly higher than healthy tissue (886.5±128.7 versus 699.6±22.8;p=0.03) among Res group; whereas there was no difference in T1 between tumor and healthy tissue (752.6±39.9 versus 706.7±75.6;p=0.3) in NRes group. At baseline, Res group had significantly higher T1 in tumor than the NRes group (886.5±128.7 versus 752.6±39.9;p=0.006). After completion of chemotherapy T1 significantly (p=0.02) reduced among Res group showing significantly higher average ΔT1=16±12%(p=0.01) than that of NRes group (ΔT1=3±3%;p=0.23).Figure3 depicts the estimated T1 maps of a representative patient each from the two response groups at baseline and follow-up. A comparatively higher reduction of T1 in tumor can be observed after chemotherapy for the patient from Res group than that of NRes. Using ROC curve analysis, T1 at baseline and ΔT1 at follow-up individually produced Sn=86%,100%; Sp=100%,83% and AUC=0.86,0.95 at threshold of ≥797msec and ≥5% respectively and jointly showed Sn=100%; Sp=83% and AUC=0.89 in identifying the Response(Res) group among all patients.Discussion
Earlier studies showed that T1 was inversely related to intracellular water volumes and the T1 of experimental tumors was greater than in healthy tissue2,5. Similarly, comparatively higher T1 (16±14%) was observed in Osteosarcoma than healthy tissue due to hyper-cellularity and lower intracellular water volume in tumor. Successful cytotoxic chemotherapy cause cell death and increase in extracellular space that lowered the tumor T12,3,6. Therefore, among Responders, a higher reduction in tumor T1 were observed than Non-responders (ΔT1:6–37% versus 2–7%). Possible reason might be chemo-resistance of tumor due to hypoxia6 among Non-responders.Conclusion
Noninvasive functional MRI to quantify spin-lattice relaxation time of water protons (T1) is an intrinsic tissue property and may have potential to characterize therapeutic changes in tumor. Thus, a change in T1 may be a non-invasive imaging marker of chemo-sensitivity and chemotherapy response.Acknowledgements
No acknowledgement found.References
- Johnson GA. Rapid calculation of T1 using variable flip angle gradient refocused imaging. 1987;(February). doi:10.1016/0730-725X(87)90021-X
- McSheehy PMJ, Weidensteiner C, Cannet C, et al. Quantified tumor T1 is a generic early-response imaging biomarker for chemotherapy reflecting cell viability. Clin Cancer Res. 2010;16(1):212-225. doi:10.1158/1078-0432.CCR-09-0686
- Suh JS, Yun MJ, Jeong EK, Shin KH, Yang WI. Osteosarcoma: Correlation of T1 Map and Histology Map. J Korean Radiol Soc. 1999;41(3):577-583. doi:org/10.3348/jkrs.1999.41.3.577
- Cheng HLM, Wright GA. Rapid high-rsolution T1 mapping by variable flip angles: Accurate and precise measurements in the presence of radiofrequency field inhomogeneity. Magn Reson Med. 2006;55(3):566-574. doi:10.1002/mrm.20791
- Braunschweiger PG, Schiffer LM, Furmanski P. 1H-NMR relaxation times and water compartmentalization in experimental tumor models. Magn Reson Imaging. 1986;4(4):335-342. doi:10.1016/0730-725X(86)91043-X
- Rofstad EK, Steinsland E, Kaalhus O, Chang YB, Høvik B, Lyng H. Magnetic resonance imaging of human melanoma xenografts in vivo: Proton spin-lattice and spin-spin relaxation times versus fractional tumour water content and fraction of necrotic tumour tissue. Int J Radiat Biol. 1994;65(3):387-401. doi:10.1080/09553009414550451
Figures
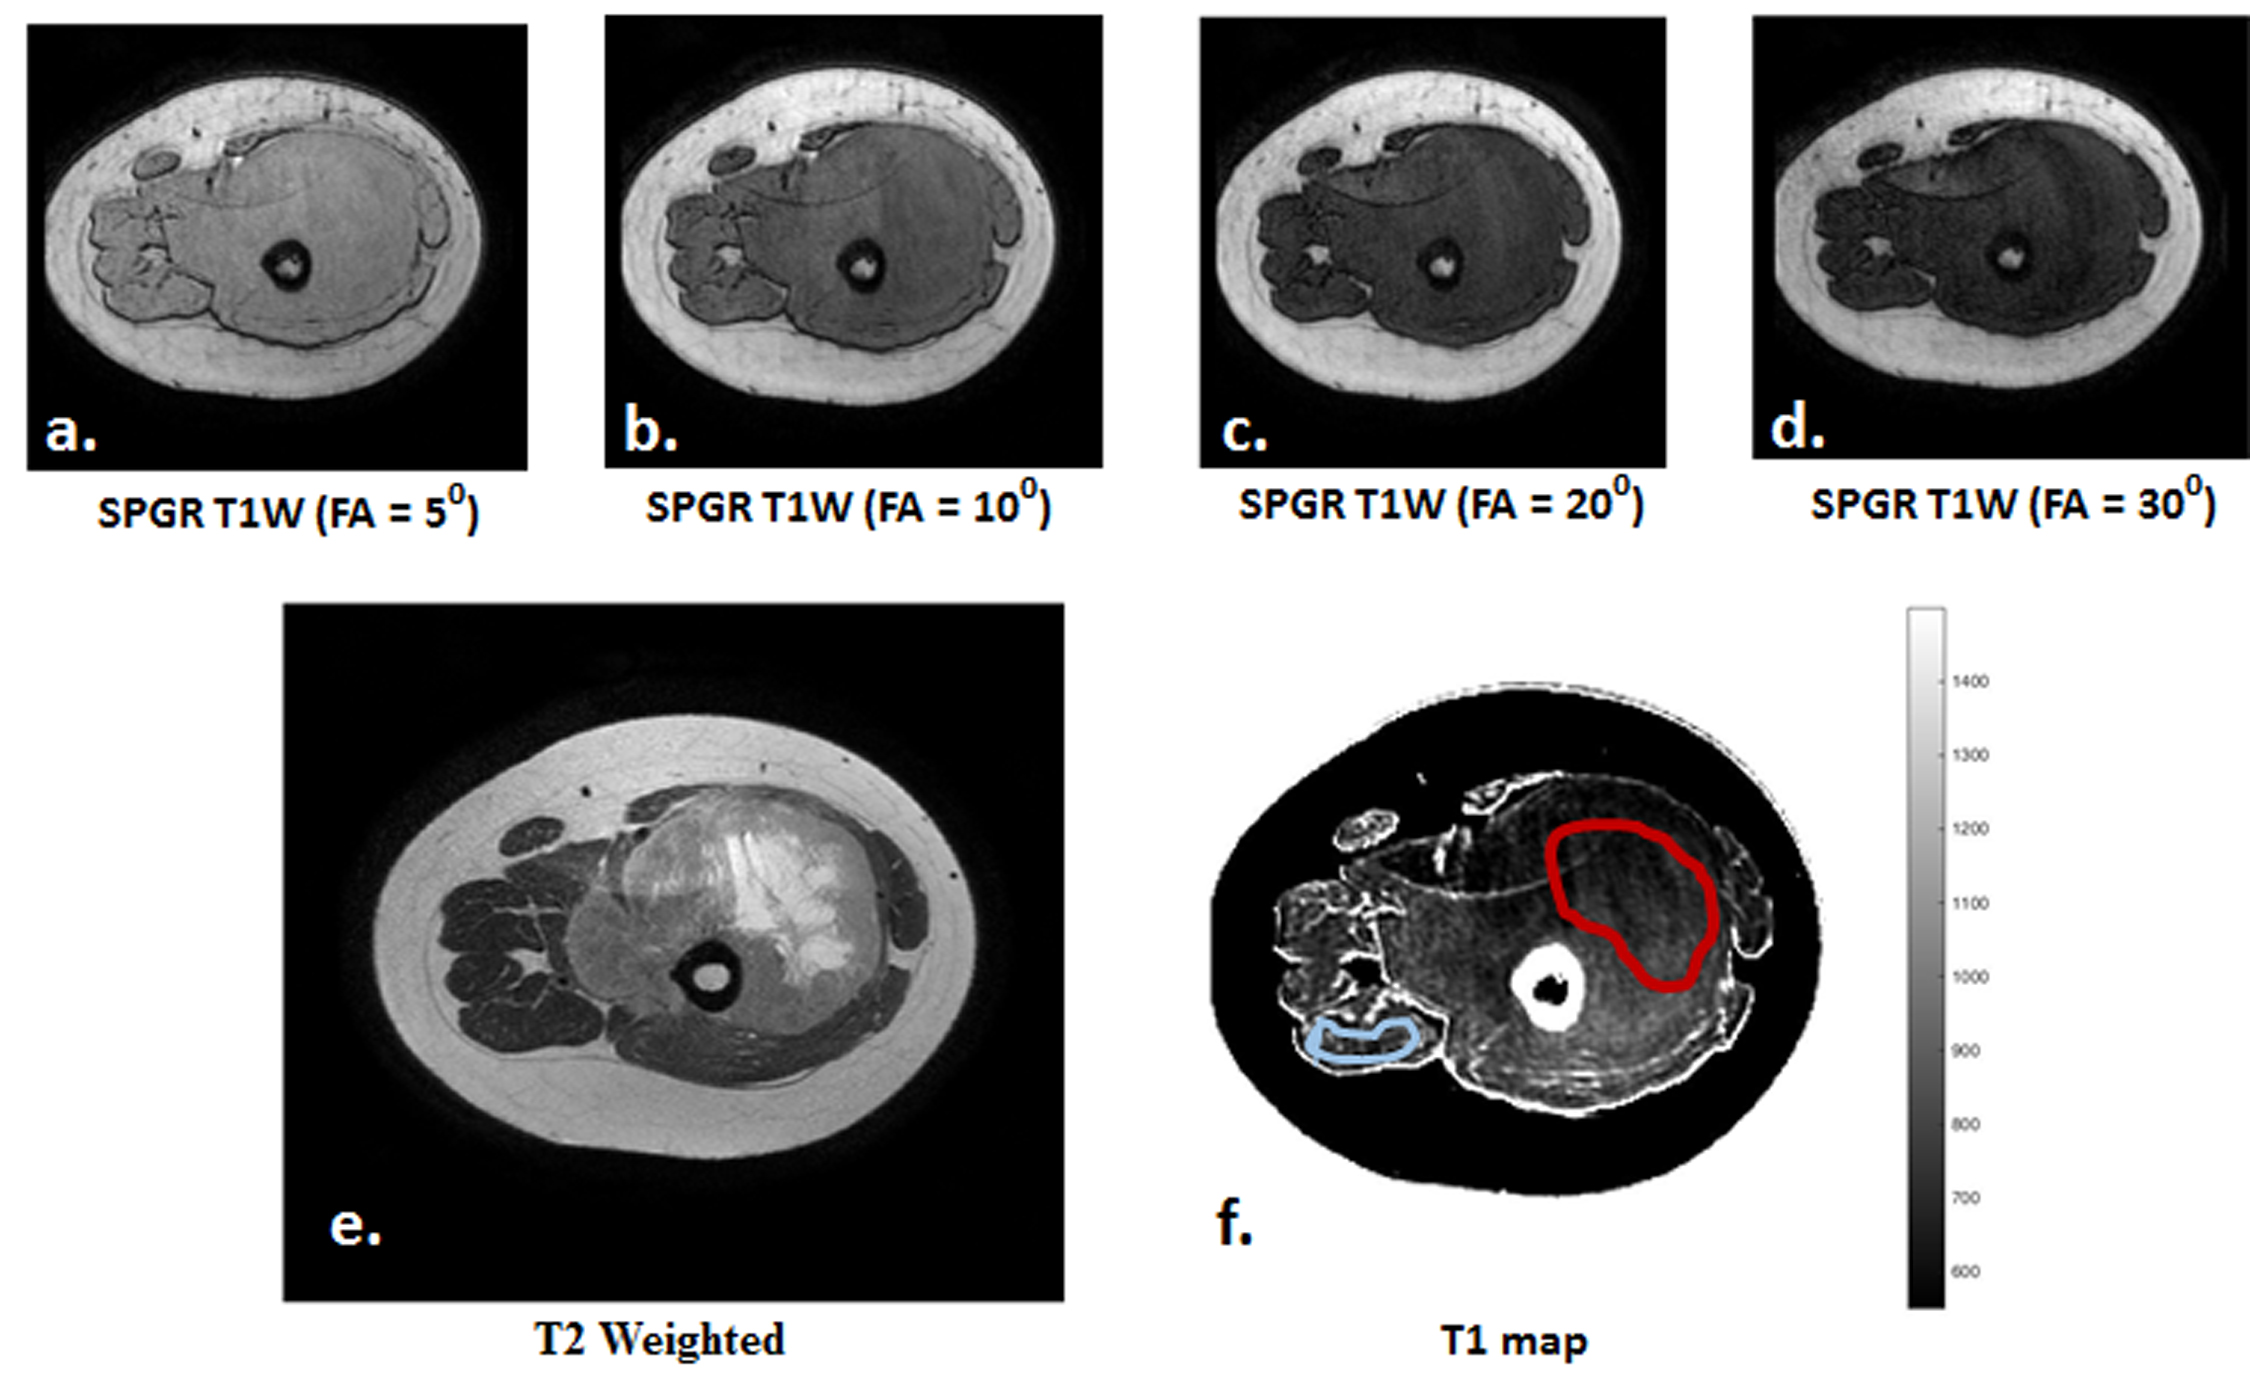
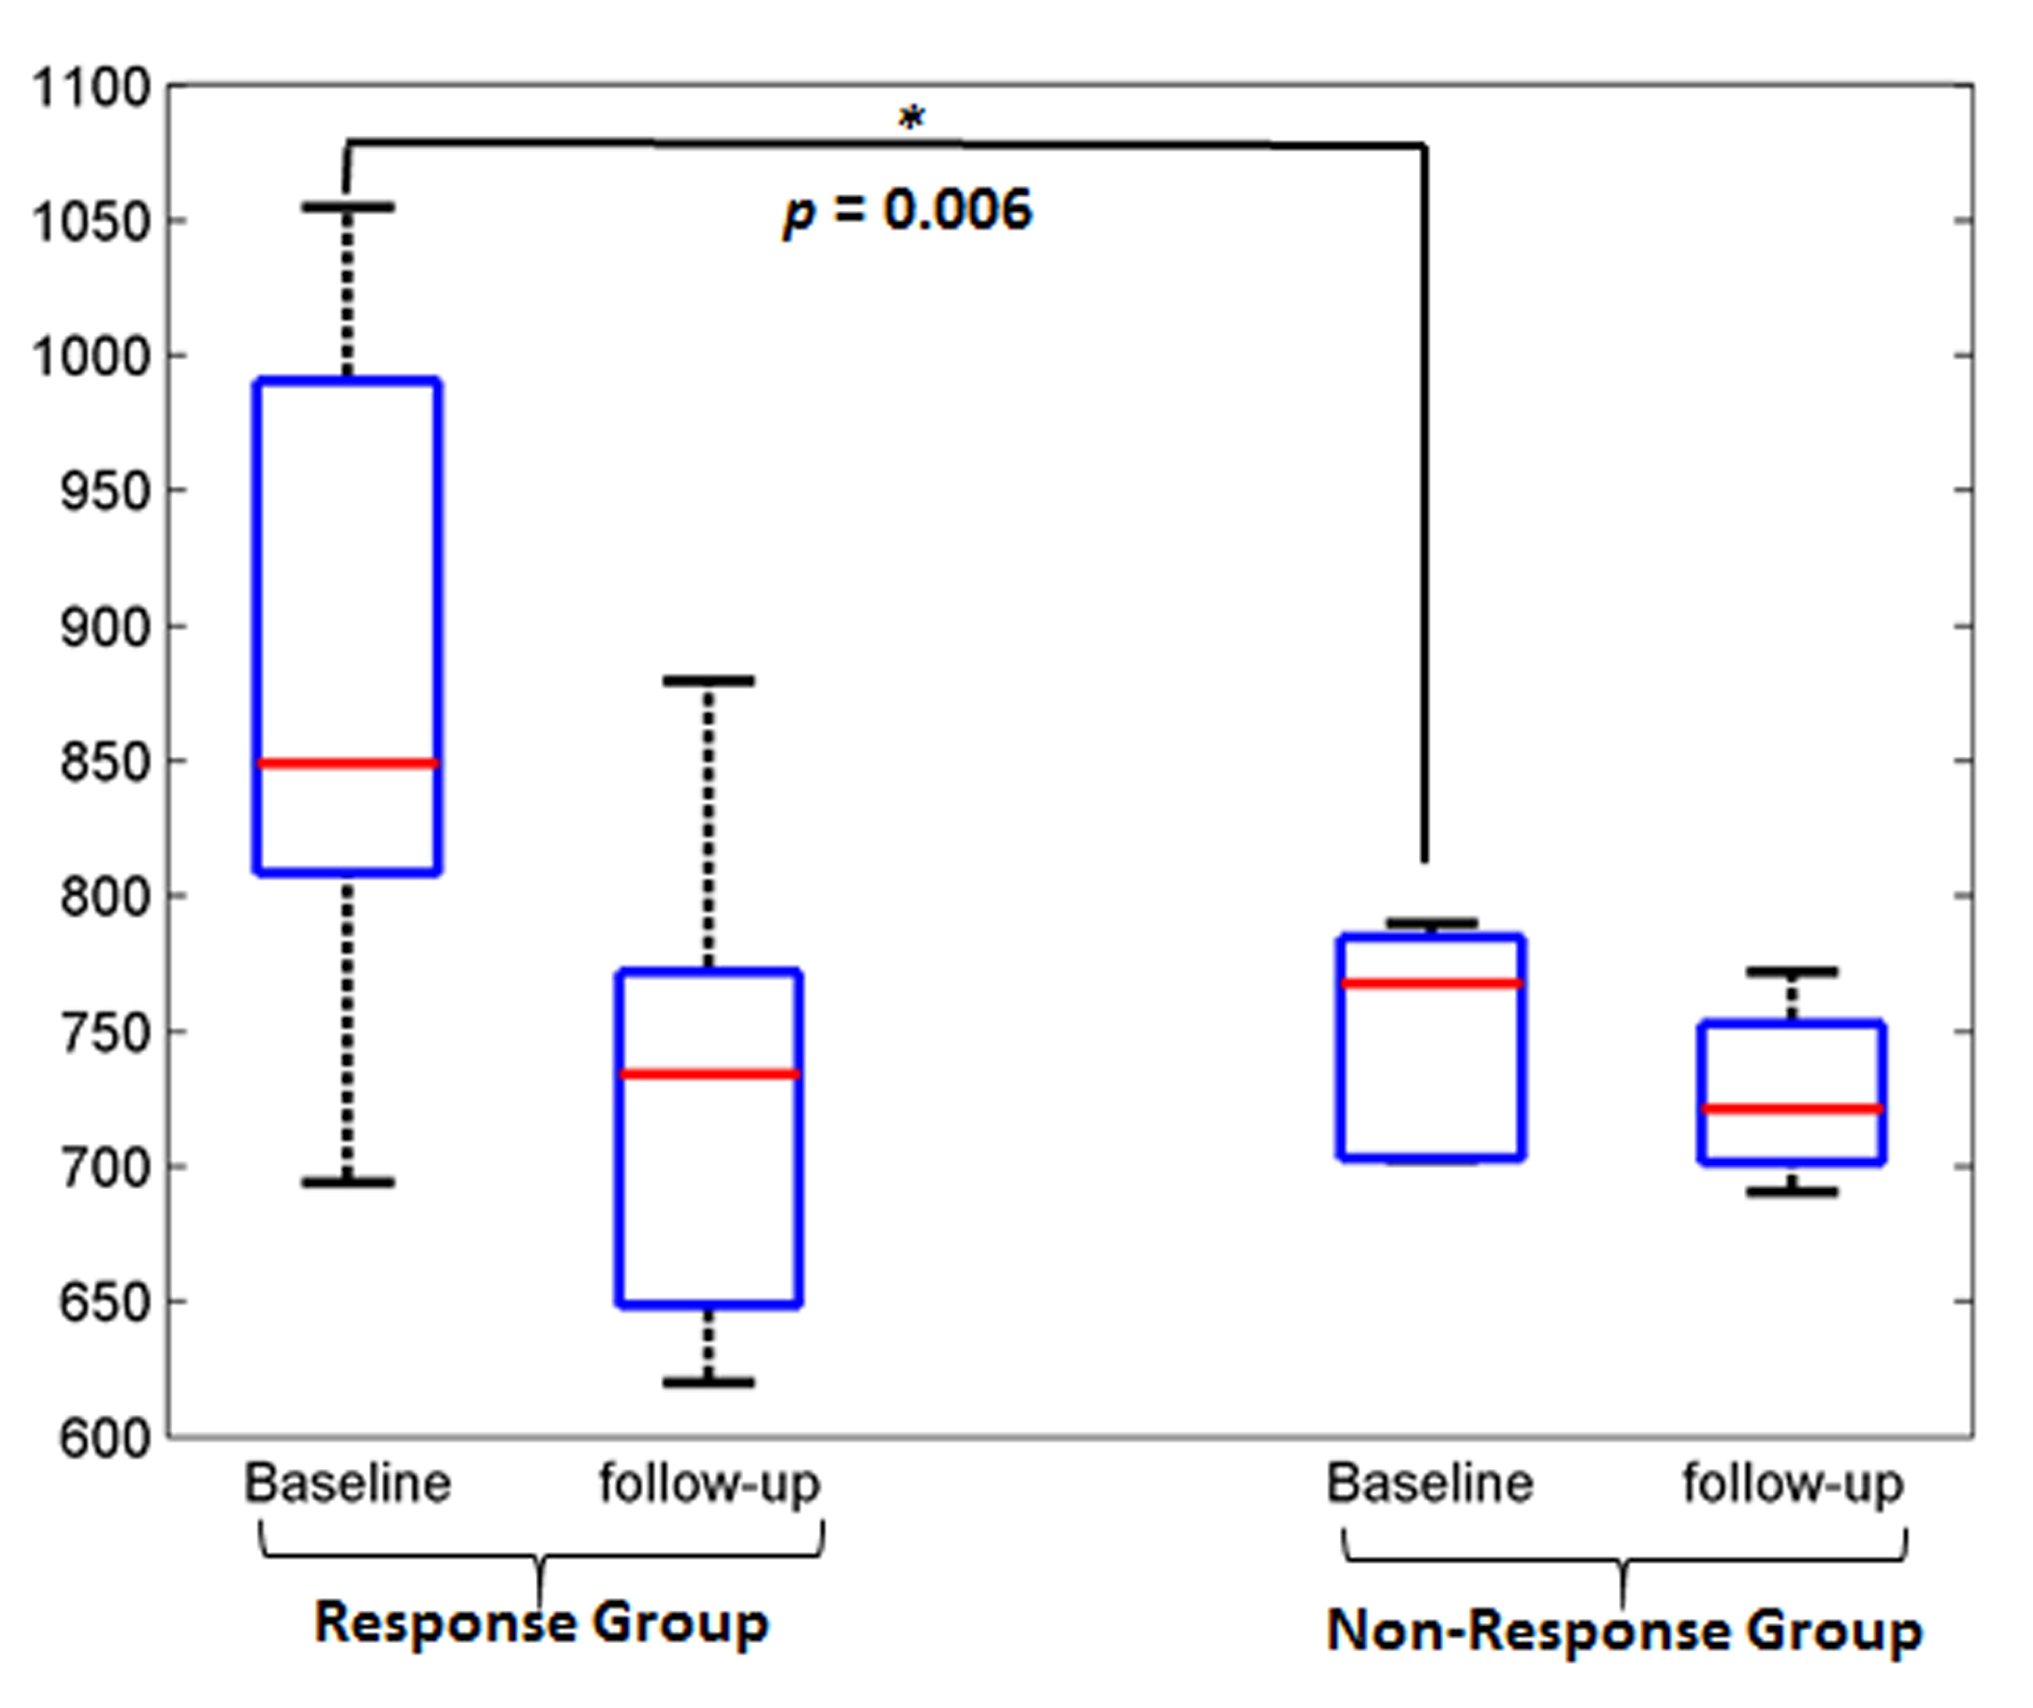
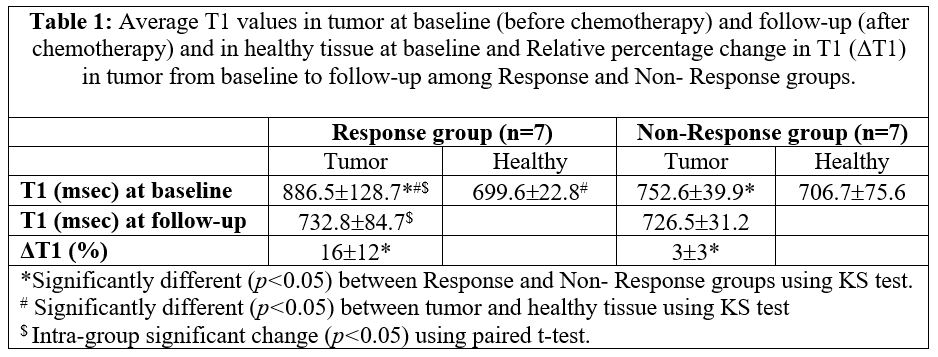
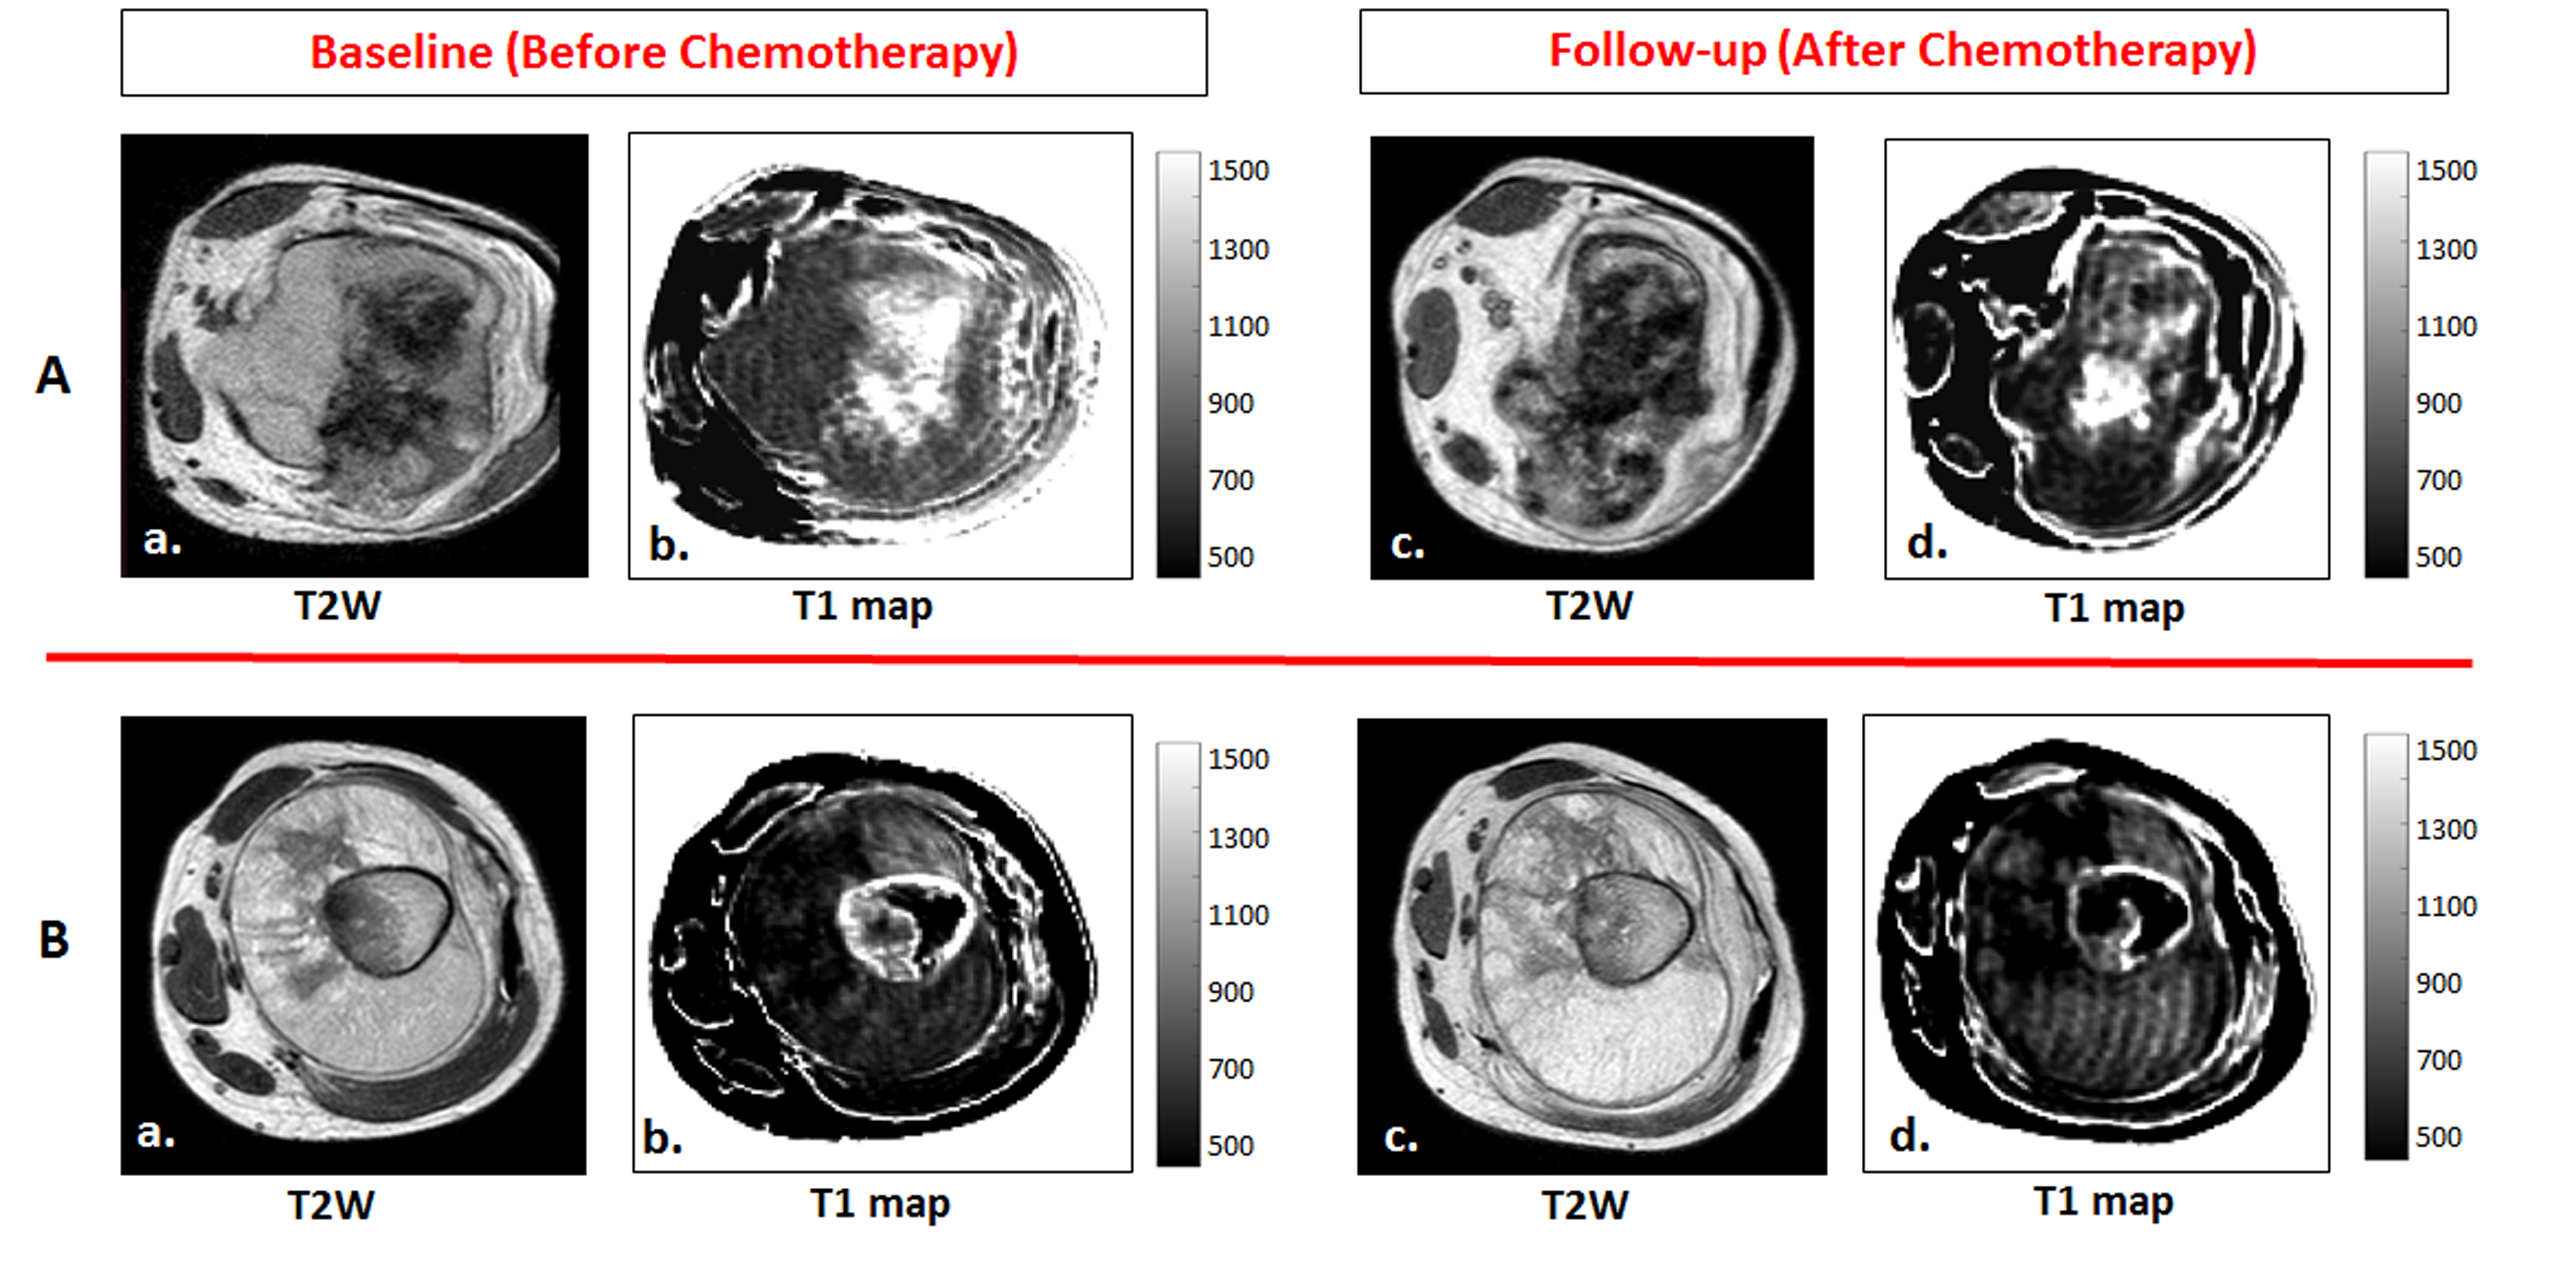
Figure 3: Images are from A. a representative patients (M, 18 years) from Response group with Osteosarcoma in right femur. B. a representative patients (M, 15 years) from Non-Response group with Osteosarcoma in right femur.
For A and B: a, c) T2-weighted images and b, d) estimated T1 maps at baseline and follow-up respectively. A comparatively higher reduction of T1 in tumor can be observed after chemotherapy for the patient from Response group than that of Non-Response group.