0260
Quantitative Measurements of Bone Water and 31P in Postmenopausal Women: A Preliminary Study1Radiology, University of Pennsylvania, Philadelphia, PA, United States, 2Medicine, University of Pennsylvania, Philadelphia, PA, United States
Synopsis
Seven osteoporotic treatment-naïve and 13 non-osteoporotic postmenopausal women have been examined in an ongoing MRI study to evaluate cortical bone properties. 1H dual-echo UTE and 1H IR-prepared rapid-UTE sequences were used for evaluation of pore and bound water concentrations in the tibial cortex, and a 31P PETRA-ZTE sequence for quantification of cortical bone mineralization. Elevated total water and pore water were found in the osteoporotic group (p=0.036, p=0.032), whereas 31P and bound water concentrations were not significantly different. Since pore water is a known surrogate of bone porosity, our preliminary results suggest it may be useful in evaluating bone health.
INTRODUCTION
Clinical diagnosis of osteoporosis is determined from radiographic evaluation of bone mineral density (BMD) via dual-energy X-ray absorptiometry (DXA)[1]. Although DXA is inexpensive and widely available, it is susceptible to errors from heterogenous absorption of non-osseous tissue and is generally a poor predictor of osteoporotic fracture[2-4]. Moreover, DXA is unable to assess the microstructure or the degree of mineralization of bone[5], which, along with macroscopic morphology and total mineral content, are the major determinants of bone strength[6]. Cortical bone constitutes 80% of total bone mass[7] and sustains half of the loads in the femoral neck[8], the clinically most relevant site. While there is currently no way of fully resolving intracortical pores in vivo, ultrashort echo-time (UTE) MRI derived biomarkers have previously been shown to be useful surrogates of cortical bone microarchitecture. UTE-derived pore water (PW) and bound water (BW) were both correlated with µCT-derived porosity[9-11] and mechanical properties[12-14]. Additionally, improvements in zero echo-time (ZTE) pulse sequences have enabled imaging of bone 31P in vivo[15, 16]. Our group recently reported a clinically feasible protocol for comprehensive evaluation of cortical bone quality, which includes both 1H water evaluation of bone microstructure as well as the first in vivo MRI quantification of 31P bone-matrix mineralization[17]. Leveraging this protocol, we present preliminary results of the first study designed to evaluate the feasibility of quantifying metrics of bone quality by 1H and 31P solid-state MRI in subjects with low bone density.METHODS
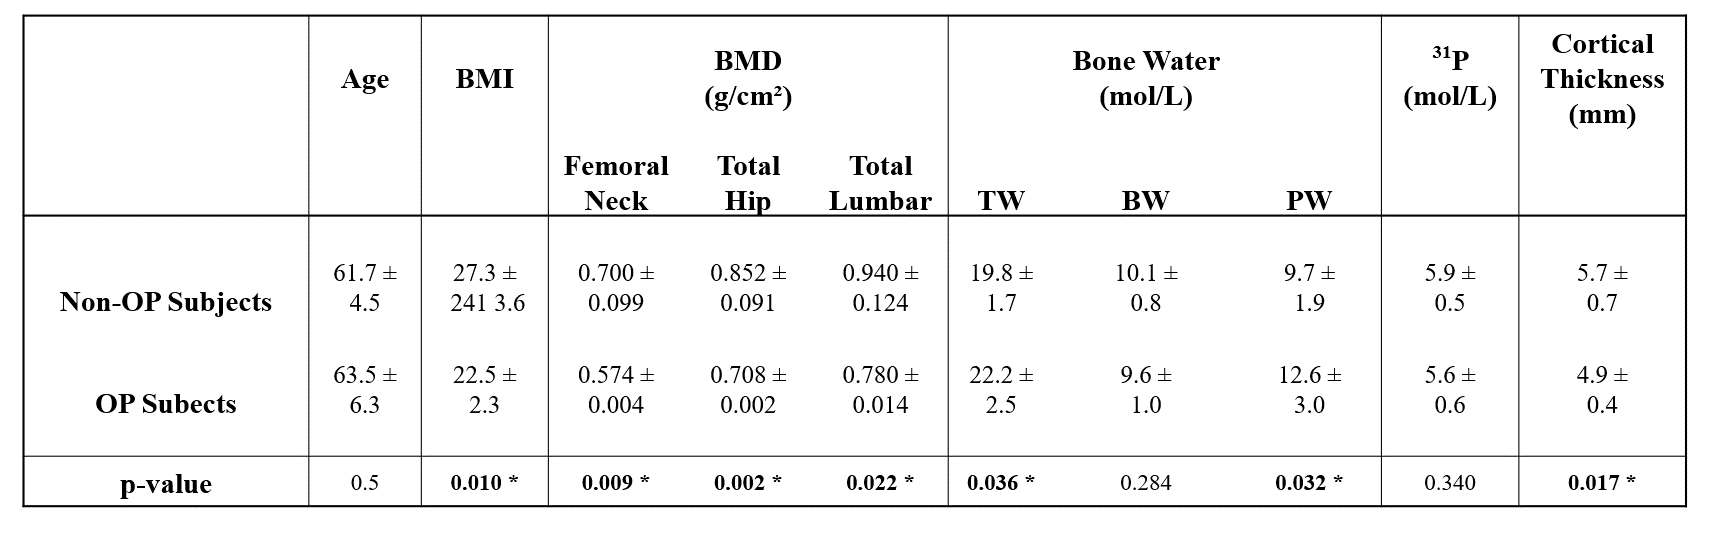
We have so far recruited seven treatment-naïve-osteoporotic and 13 age-matched non-osteoporotic postmenopausal women for this study in compliance with IRB protocols. Subjects are part of an ongoing, larger, longitudinal study in which the osteoporotic group will be treated with bisphosphonates following a baseline evaluation.BMD was measured at three locations (lumbar spine, femoral neck, and hip) using DXA, and the corresponding T-scores were used to determine the presence of osteoporosis (any T-score≤-2.5).
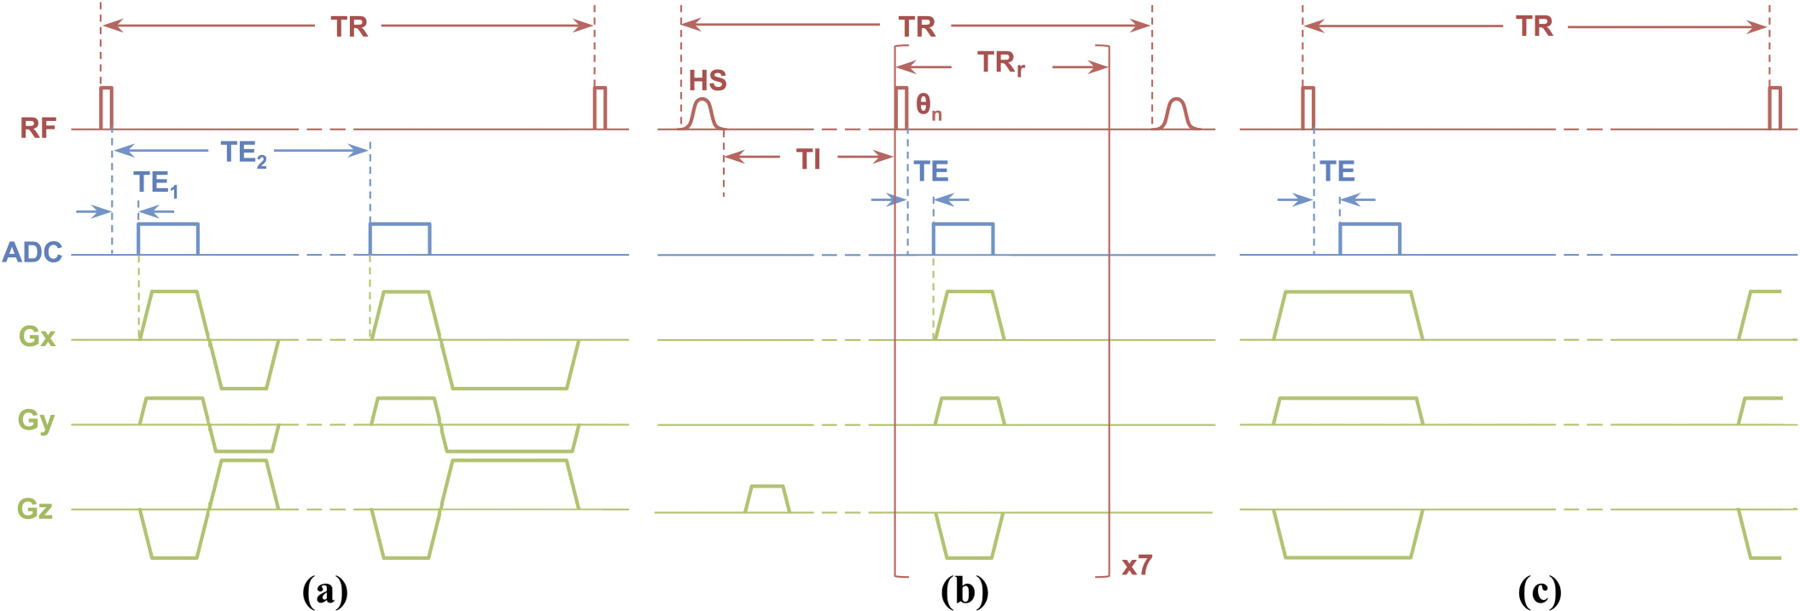
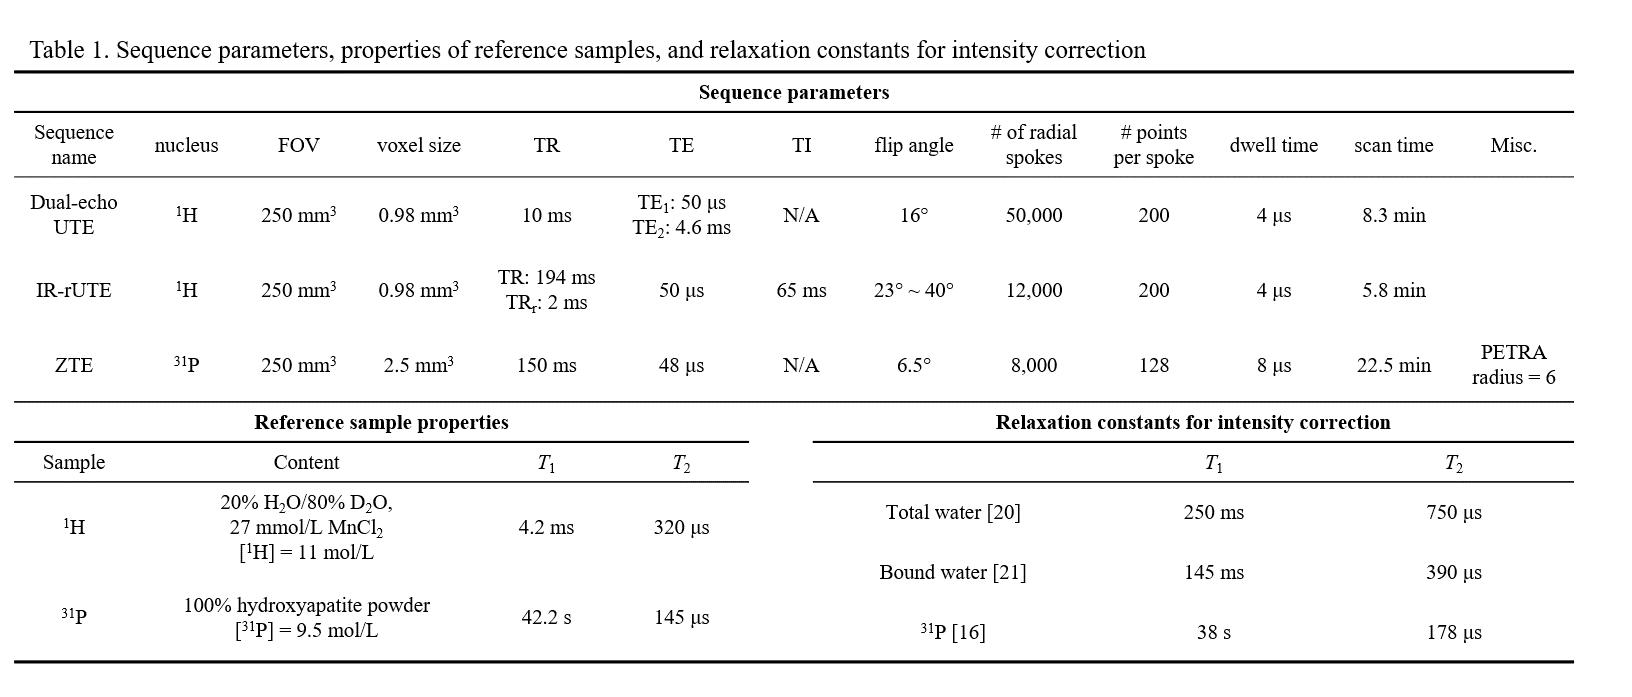
All participants were scanned at 3.0T (TIM Trio, Siemens, Erlangen, Germany) with a custom-built dual-tuned, transmit/receive 31P/1H birdcage calf coil (Rapid Biomedical, Rimpar, Germany). Three customized MR pulse sequences developed previously (Table 1)[17-19] were used to quantify concentrations of bone water and 31P density: (1) 1H dual-echo radial-UTE sequence was employed for measuring total bone water (TW), (2) BW was quantified with 1H IR-prepared rapid radial-UTE (IR-rUTE) sequence, and (3) 31P was imaged with a custom-designed ZTE-PETRA[19] sequence (Figures 1A-C). Reference samples of 1H and 31P (Table 1) were placed adjacent to the tibia during MRI scans to calculate absolute concentrations. Signal intensity correction was performed based on relaxation constants[16, 20, 21] before using the following equation for quantification:
$$\rho_{bone} = \rho_{ref}\frac{I_{bone} \times F_{ref}}{I_{ref} \times F_{bone}} \times e^{-TE (\frac{1}{T_{2,ref}^*} - \frac{1}{T_{2,bone}^*}) }$$
where ρ, I, and F represent density, image voxel intensity, and magnetization fraction, respectively. PW was then calculated by subtracting BW from TW. Given the small sample size of this study, Wilcoxon rank-sum test was used to evaluate differences between two groups. Manual contouring was performed on the second echo-image and cortical thicknesses were calculated based on previously established methods[22].
RESULTS
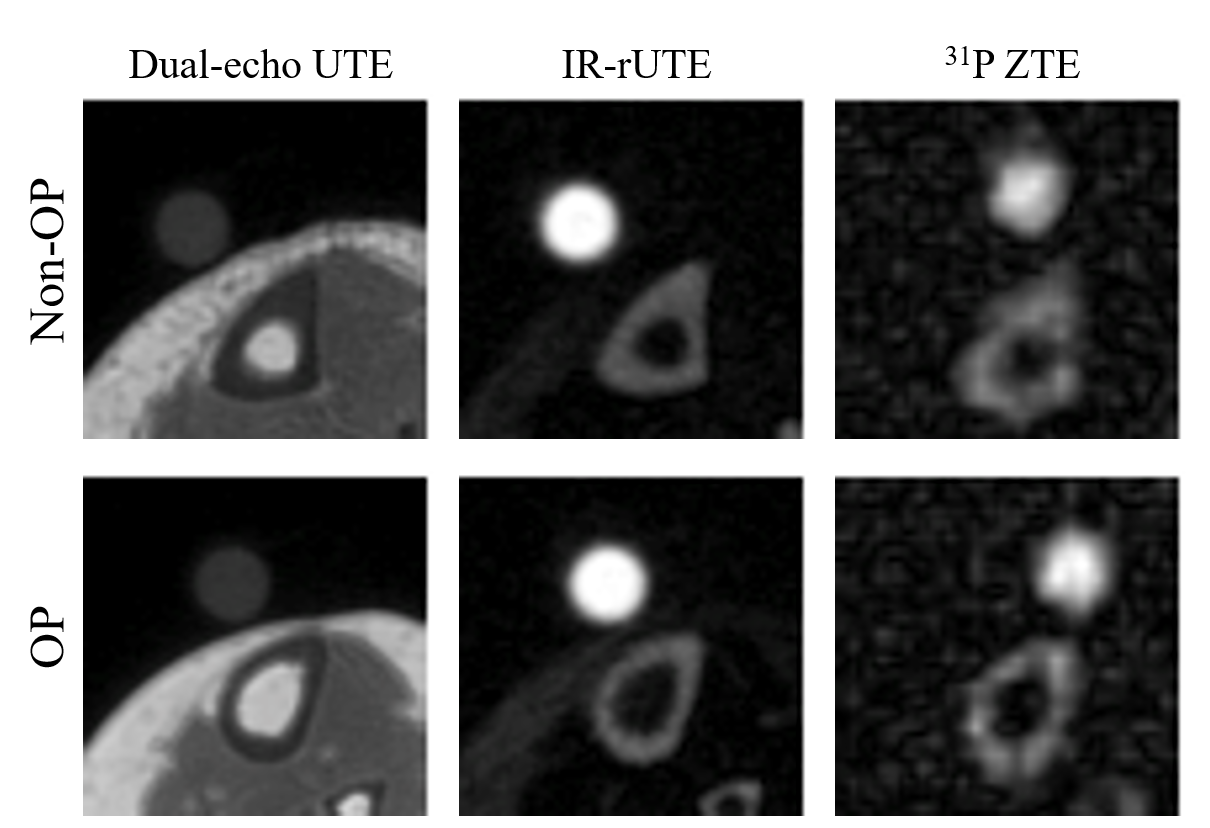
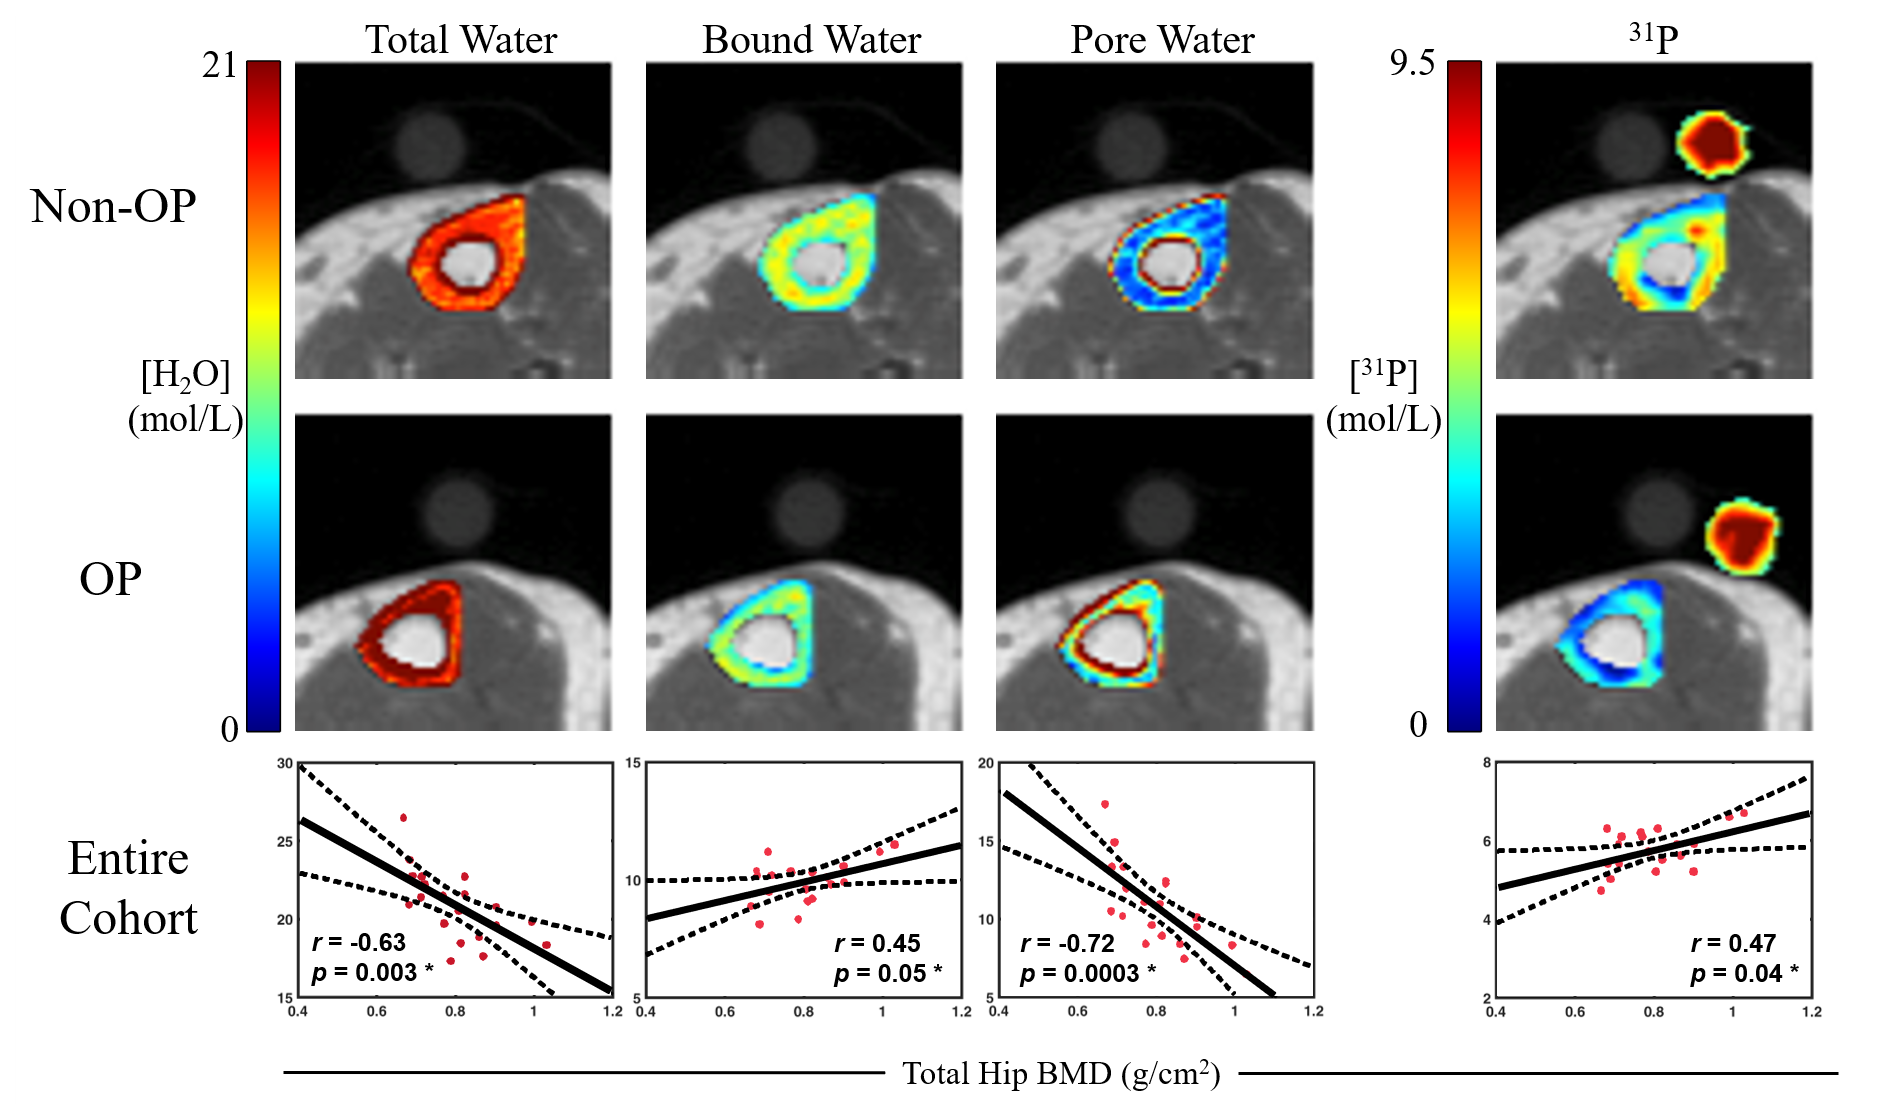
Figure 2 shows representative images for each customized pulse sequence in non-OP and OP participants. Thinner cortical bone was observed for the OP group (p=0.017). In Figure 3, quantitative maps of TW, BW, PW and 31P are overlaid on top of dual-echo UTE images. Table 2 summarizes all quantitative results and statistical analyses, including subject age, BMI, BMD, T-Scores, and MRI-derived parameters. TW and PW were significantly higher in the OP than in non-OP group (19.8±1.7 vs. 22.2±2.5 mol/L, p=0.036; 9.7±1.9 vs. 12.6±3.0 mol/L, p=0.032). Lower 31P and BW concentrations were found in OP subjects, but the results did not reach statistical significance. As shown in Figure 3, TW, PW, and 31P were significantly correlated to total hip BMD (p=0.003, p=0.0003, p=0.04), whereas BW was only marginally significant (p=0.05). However, total lumbar BMD was only correlated to PW (p=0.03) whereas TW, 31P, and BW were not (p=0.06, p=0.12, p=0.35).DISCUSSION
The data presented constitute preliminary results of the first study to evaluate cortical bone microstructural and mineralization MR biomarkers to gain insight into the ultrastructural implications of degenerative bone disease. We found that osteoporosis is associated with an increase in PW content, in agreement with previous findings that PW is negatively correlated with bone strength[12]. Additionally, OP subjects tended to have lower BW and 31P density than their non-OP peers, again in agreement with previous findings[9, 10], although the trend was not significant. It is important to note that, although no differences were found in BW, significant differences in TW and PW content were found between groups, suggesting that intracortical remodeling in osteoporosis may initially be dominated by increase in pore size, likely as a result of the widening of Haversian and Volkmann canals[23]. Cortical biomarkers had higher correlations with hip than with lumbar BMD, likely because the hip has a greater proportion of cortical bone, whereas lumbar vertebrae are highly trabecularized.CONCLUSION
Cortical bone MR biomarkers could be used to non-invasively assess bone quality in vivo. Ongoing work will assess these biomarkers in a larger cohort, as well as investigate if longitudinal changes can be detected in cortical bone following bisphosphonate treatment.Acknowledgements
NIH R01-AR50068 and T32-EB020087References
1. Sweet, M.G., J.M. Sweet, M.P. Jeremiah, and S.S. Galazka, Diagnosis and treatment of osteoporosis. Am Fam Physician, 2009. 79(3): p. 193-200.
2. Marshall, D., O. Johnell, and H. Wedel, Meta-analysis of how well measures of bone mineral density predict occurrence of osteoporotic fractures. Bmj, 1996. 312(7041): p. 1254-9.
3. Bolotin, H.H., The significant effects of bone structure on inherent patient-specific DXA in vivo bone mineral density measurement inaccuracies. Med Phys, 2004. 31(4): p. 774-88.
4. Bolotin, H.H., DXA in vivo BMD methodology: an erroneous and misleading research and clinical gauge of bone mineral status, bone fragility, and bone remodelling. Bone, 2007. 41(1): p. 138-54.
5. Ruppel, M.E., L.M. Miller, and D.B. Burr, The effect of the microscopic and nanoscale structure on bone fragility. Osteoporosis International, 2008. 19(9): p. 1251-1265.
6. Boskey, A.L., Bone composition: relationship to bone fragility and antiosteoporotic drug effects. Bonekey Rep, 2013. 2: p. 447.
7. Stevenson, J.C., L.M. Banks, T.J. Spinks, C. Freemantle, I. MacIntyre, R. Hesp, G. Lane, J.A. Endacott, M. Padwick, and M.I. Whitehead, Regional and total skeletal measurements in the early postmenopause. The Journal of clinical investigation, 1987. 80(1): p. 258-262.
8. Manske, S.L., T. Liu-Ambrose, D.M. Cooper, S. Kontulainen, P. Guy, B.B. Forster, and H.A. McKay, Cortical and trabecular bone in the femoral neck both contribute to proximal femur failure load prediction. Osteoporos Int, 2009. 20(3): p. 445-53.
9. Seifert, A.C., C. Li, C.S. Rajapakse, M. Bashoor-Zadeh, Y.A. Bhagat, A.C. Wright, B.S. Zemel, A. Zavaliangos, and F.W. Wehrli, Bone mineral (31)P and matrix-bound water densities measured by solid-state (31)P and (1)H MRI. NMR Biomed, 2014. 27(7): p. 739-48.
10. Seifert, A.C., C. Li, S.L. Wehrli, and F.W. Wehrli, A Surrogate Measure of Cortical Bone Matrix Density by Long T2 -Suppressed MRI. J Bone Miner Res, 2015. 30(12): p. 2229-38.
11. Chen, J., S.P. Grogan, H. Shao, D. D'Lima, G.M. Bydder, Z. Wu, and J. Du, Evaluation of bound and pore water in cortical bone using ultrashort-TE MRI. NMR in biomedicine, 2015. 28(12): p. 1754-1762.
12. Horch, R.A., D.F. Gochberg, J.S. Nyman, and M.D. Does, Non-invasive predictors of human cortical bone mechanical properties: T(2)-discriminated H NMR compared with high resolution X-ray. PLoS One, 2011. 6(1): p. e16359.
13. Fernandez-Seara, M.A., S.L. Wehrli, M. Takahashi, and F.W. Wehrli, Water content measured by proton-deuteron exchange NMR predicts bone mineral density and mechanical properties. J Bone Miner Res, 2004. 19(2): p. 289-96.
14. Bae, W.C., P.C. Chen, C.B. Chung, K. Masuda, D. D'Lima, and J. Du, Quantitative ultrashort echo time (UTE) MRI of human cortical bone: correlation with porosity and biomechanical properties. J Bone Miner Res, 2012. 27(4): p. 848-57.
15. Robson, M.D., P.D. Gatehouse, G.M. Bydder, and S. Neubauer, Human imaging of phosphorus in cortical and trabecular bone in vivo. Magnetic Resonance in Medicine, 2004. 51(5): p. 888-892.
16. Wu, Y., T.G. Reese, H. Cao, M.I. Hrovat, S.P. Toddes, R.A. Lemdiasov, and J.L. Ackerman, Bone mineral imaged in vivo by 31P solid state MRI of human wrists. J Magn Reson Imaging, 2011. 34(3): p. 623-33.
17. Zhao, X., H.K. Song, A.C. Seifert, C. Li, and F.W. Wehrli, Feasibility of assessing bone matrix and mineral properties in vivo by combined solid-state 1H and 31P MRI. PLoS One, 2017. 12(3): p. e0173995.
18. Li, C., J.F. Magland, H.S. Rad, H.K. Song, and F.W. Wehrli, Comparison of optimized soft-tissue suppression schemes for ultrashort echo time MRI. Magn Reson Med, 2012. 68(3): p. 680-9.
19. Li, C., J.F. Magland, X. Zhao, A.C. Seifert, and F.W. Wehrli, Selective in vivo bone imaging with long-T2 suppressed PETRA MRI. Magn Reson Med, 2017. 77(3): p. 989-997.
20. Rad, H.S., S.C. Lam, J.F. Magland, H. Ong, C. Li, H.K. Song, J. Love, and F.W. Wehrli, Quantifying cortical bone water in vivo by three-dimensional ultra-short echo-time MRI. NMR Biomed, 2011. 24(7): p. 855-64.
21. Seifert, A.C., S.L. Wehrli, and F.W. Wehrli, Bi-component T2 * analysis of bound and pore bone water fractions fails at high field strengths. NMR Biomed, 2015. 28(7): p. 861-72.
22. Rajapakse, C.S., M.B. Leonard, Y.A. Bhagat, W. Sun, J.F. Magland, and F.W. Wehrli, Micro-MR imaging-based computational biomechanics demonstrates reduction in cortical and trabecular bone strength after renal transplantation. Radiology, 2012. 262(3): p. 912-20.
23. Osterhoff, G., E.F. Morgan, S.J. Shefelbine, L. Karim, L.M. McNamara, and P. Augat, Bone mechanical properties and changes with osteoporosis. Injury, 2016. 47: p. S11-S20.
Figures