0259
Evaluating the Relationship Between Dynamic [18F]-Sodium Fluoride Uptake Parameters and MRI Knee Osteoarthritic Findings1Bioengineering, Stanford University, Stanford, CA, United States, 2Radiology, University of East Anglia, Norwich, United Kingdom, 3Radiology, University of Cambridge, Cambridge, United Kingdom, 4Department of Clinical Physiology, Nuclear Medicine and PET, Copenhagen University Hospital, København, Denmark, 5Radiology, Stanford University, Stanford, CA, United States, 6Mechanical Engineering, Stanford University, Stanford, CA, United States
Synopsis
Abnormal bone physiology is a potential mechanism for the progression of knee osteoarthritis. Molecular information derived from PET imaging has shown promise in early detection of bone metabolic abnormalities. Here we investigated kinetic parameters of PET tracer ([18F]-NaF) uptake in subjects with knee osteoarthritis and evaluated the relationship between kinetic tracer uptake parameters and structural MRI findings. The kinetic parameters for [18F]-NaF delivery and uptake to regions of bone containing osteophytes, bone marrow lesions, and adjacent to cartilage lesions identified on MRI were significantly different compared to normal-appearing bone, suggesting strong spatial relationships between structural damage and bone metabolic abnormalities.
Introduction
Abnormal bone physiology is a potential mechanism for the progression of knee osteoarthritis (OA), a disease marked by degradation and loss of soft tissues like cartilage and the development of bone marrow lesions (BML) and osteophytes. While MRI is a useful tool to evaluate structural changes to cartilage and bone, functional imaging of bone remains a challenge. Molecular information derived from [18F]-sodium fluoride ([18F]-NaF) PET imaging has shown promise as a marker of bone metabolism in a variety of bone and joint disorders1,2. In particular, kinetic modeling of [18F]-NaF uptake into subchondral bone enables quantitative analysis of bone physiological parameters3 that may be altered in the presence of OA features. In this work, we evaluate the relationship between observed structural changes in bone and cartilage observed on MRI and quantitative subchondral bone metabolic parameters using hybrid PET/MRI imaging.Methods
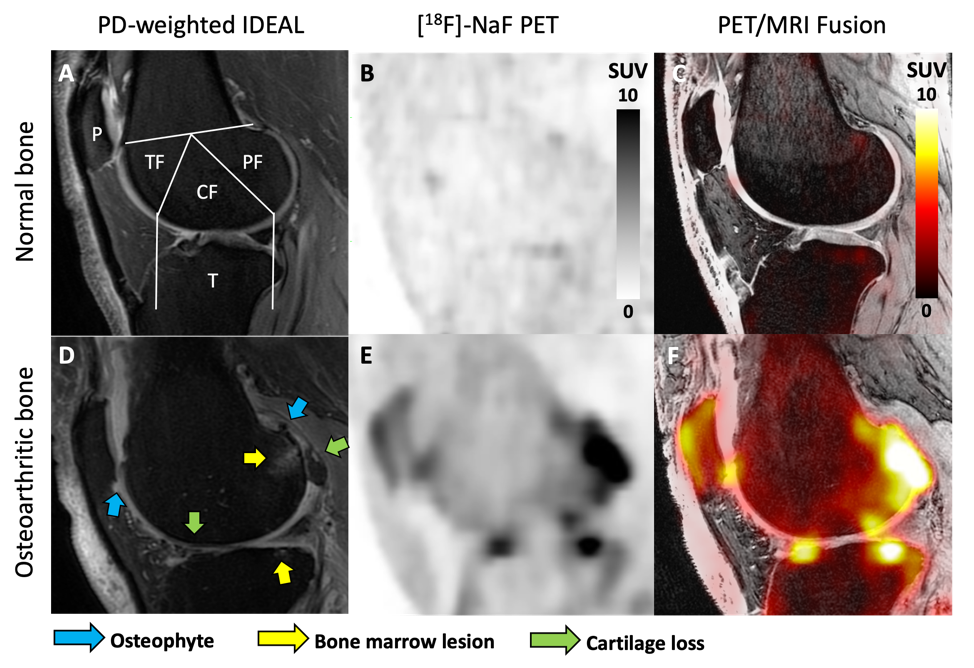
Both knees of eleven subjects with knee osteoarthritis (55.4 ± 8.9 years; BMI 27.6 ± 5.1; 8 female) were scanned using a 3T whole-body hybrid PET/MRI system with two flexible 16-channel coils under an approved IRB protocol. Upon injection of a 2.5 mCi dose of [18F]-NaF, dynamic PET and bilateral MRI data were obtained over 50 minutes. MRI Osteoarthritis Knee Score (MOAKS)4 assessment of each knee was performed by a trained musculoskeletal radiologist using sagittal proton-density-weighted IDEAL and coronal T2-weighted fat-saturated images. Dynamic PET data were fit to a two-tissue kinetic model to calculate the rates of bone perfusion (K1), tissue clearance (k2), and mineralization (k3), as well as tracer extraction fraction (k3/[k2+k3]) and bone [18F] total uptake rate (Ki = K1*extraction fraction). Kinetic fitting was performed for regions of interest representing the subchondral bone of the patella; medial and lateral tibia; and anterior, central, and posterior regions of the medial and lateral femur (Figure 1A). The mean and maximum standardized uptake values (SUV) and kinetic parameters within each bone region were compared to corresponding MOAKS scores for BML and osteophyte size, as well as cartilage loss within a region using a general linear model with Bonferroni post-hoc correction (α = 0.05).Results
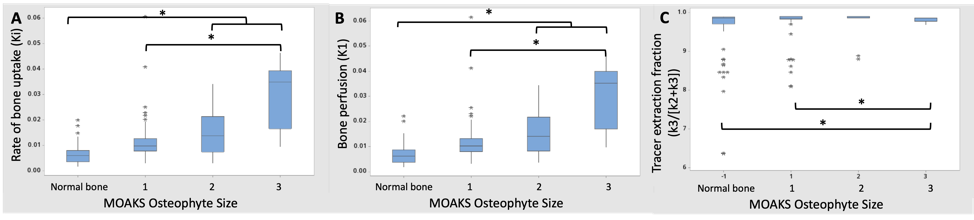
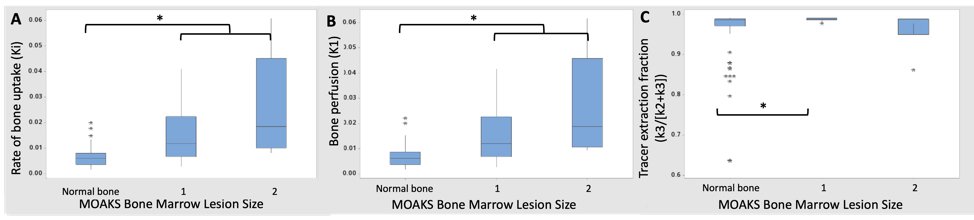
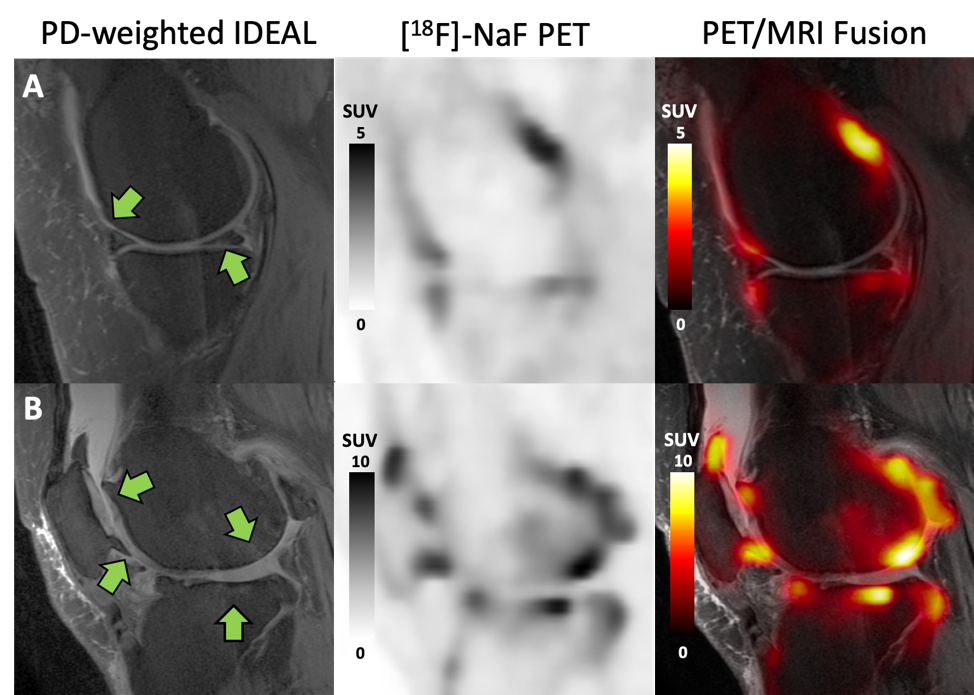
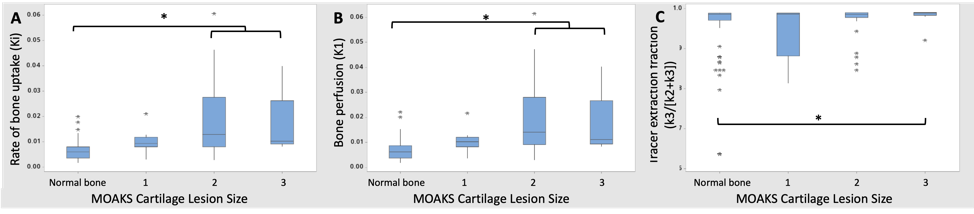
In the 22 knees studied, there were two knees without any MOAKS findings and a total of 81 bone regions with no MOAKS findings (“normal-appearing bone”). Within regions where there were one or more MOAKS findings, there were 54 regions with cartilage loss, 35 regions with BMLs, and 76 regions with osteophytes. Fifty-one of these regions had a single feature, while 26 had two features and 18 had all three features. There were no regions with size 3 bone marrow lesions. Representative PET/MRI fusion images are shown in Figure 1. Average and maximum SUV, bone perfusion, tissue clearance, extraction fraction, and total bone uptake rates of the PET tracer were significantly increased in regions with larger osteophytes [MOAKS 2/3] (p < 0.01, Figure 2); these and mineralization rates were significantly altered in BMLs (p < 0.01, Figure 3). Elevations in SUV and total bone uptake rates were driven by increased bone perfusion rates compared to other kinetic parameters. Additionally, subchondral bone uptake was significantly elevated in regions with adjacent cartilage lesions (Figures 4-5) compared to areas of normal-appearing bone and cartilage.Discussion
Kinetic parameters of [18F]-NaF uptake suggest that observed elevated tracer uptake in regions of subchondral bone with osteophytes and BMLs is driven by large increases in bone perfusion rates and smaller changes in bone extraction fraction rates. Additionally, cartilage lesion size was associated with altered metabolic parameters in adjacent subchondral bone, suggesting strong spatial relationships between subchondral bone metabolic abnormalities and changes in overlying cartilage. Kinetic parameters of [18F]-NaF uptake in subchondral bone are objective measures of bone metabolism with potential to provide functional information that complements assessments of structural abnormalities observed on MRI. Results suggest that the abnormal bone metabolism observed as elevated SUV in regions with bone marrow lesions and osteophytes, found here and in prior work2, is a result of significantly greater bone perfusion rates in these regions when compared to bone that appears normal on MRI. Bone perfusion rate is a principal mechanism of total bone uptake at rest; however, other kinetic parameters may have a larger role in the functional response of bone to stress3. Kinetic parameters of bone metabolism have potential to improve the ability of PET/MRI to evaluate the impact of specific bone and cartilage features and the relationships between them in the progression of OA.Conclusion
Kinetic parameters of the delivery and uptake of [18F]-NaF to bone regions with osteophytes, bone marrow lesions, and adjacent cartilage lesions were significantly different than to regions of normal bone. Understanding the mechanisms of bone metabolic abnormalities detected using hybrid PET/MRI imaging will further our understanding of the impact of MRI findings in the progression of OA.Acknowledgements
The authors would like to thank Dawn Holley and Mehdi Khalighi for their assistance with PET/MRI scans. We received research support from GE Healthcare, NIH grants R01-AR074492-01 and R00 EB022634.References
1. Blau, Magler, Bender. Fluorine-18: a new isotope for bone scanning. Journal of Nuclear Medicine: official publication, Society of Nuclear Medicine, 1962; 3:332-334.
2. Kogan, Fan, McWalter, Oei, Quon, Gold. PET/MR Imaging of Metabolic Activity in Osteoarthritis: A Feasibility Study. Journal of Magnetic Resonance Imaging, 2017; 45(6):1736-1745.
3. Haddock, Fan, Uhlrich, Jorgensen, Suetta, Gold, Kogan. Assessment of acute bone loading in humans using [18F]NaF PET/MRI. European Journal of Nuclear Medicine and Molecular Imaging, 2019; 46(12):2452-2463.
4. Hunter, Guermazi, lo, Grainger, Conaghan, Boudreau, Roemer. Evolution of semiquantitative whole joint assessment of knee OA: MOAKS (MRI Osteoarthritis Knee Score). Osteoarthritis Cartilage, 2011; 19(8):990-1002.
Figures