0258
Principal Component Analysis of Simultaneous PET/MRI Reveals Patterns of Cartilage-Bone Interactions in Osteoarthritis1Radiology and Biomedical Imaging, University of California San Francisco, San Francisco, CA, United States
Synopsis
Osteoarthritis (OA) is a joint disorder, consisting of cartilage degeneration and metabolic bone changes, which have previously been correlated by using [18F]-NaF PET/MRI in the knee. However, these correlations were derived using averaging methods in areas of [18F] uptake in the bone and surrounding cartilage T1ρ/T2 mean values, which could miss potential multifaceted mechanisms that are not spatially correlated in the joint. The goal of this study is to find complex patterns in OA by building a cartilage-bone interface and using principal component analysis to find cartilage-bone interactions and find associations with known manifestations of OA.
Introduction
Osteoarthritis is a debilitating joint disorder characterized by cartilage destruction, subchondral bone changes, osteophytes formation, and other complex pathological changes that are not clearly understood1.[18F]-NaF PET/MRI has previously been used in the knee, hip joints to correlate biochemical cartilage changes and metabolic bone changes by calculating mean, maximum values of SUV in regions of bone abnormalities and those surrounding cartilage lesions, proving itself a feasible method to study early OA2-5. However, since the knee is a complex joint, only studying associations between bone changes and surrounding cartilage degeneration biomarkers, would miss potential, multifaceted mechanisms that are not spatially correlated in the joint. The goal of this study is to build a cartilage-bone interface, and using principal component analysis to find cartilage-bone interaction patterns (or connectome) in knee OA which are associated with known manifestations of OA.Methods
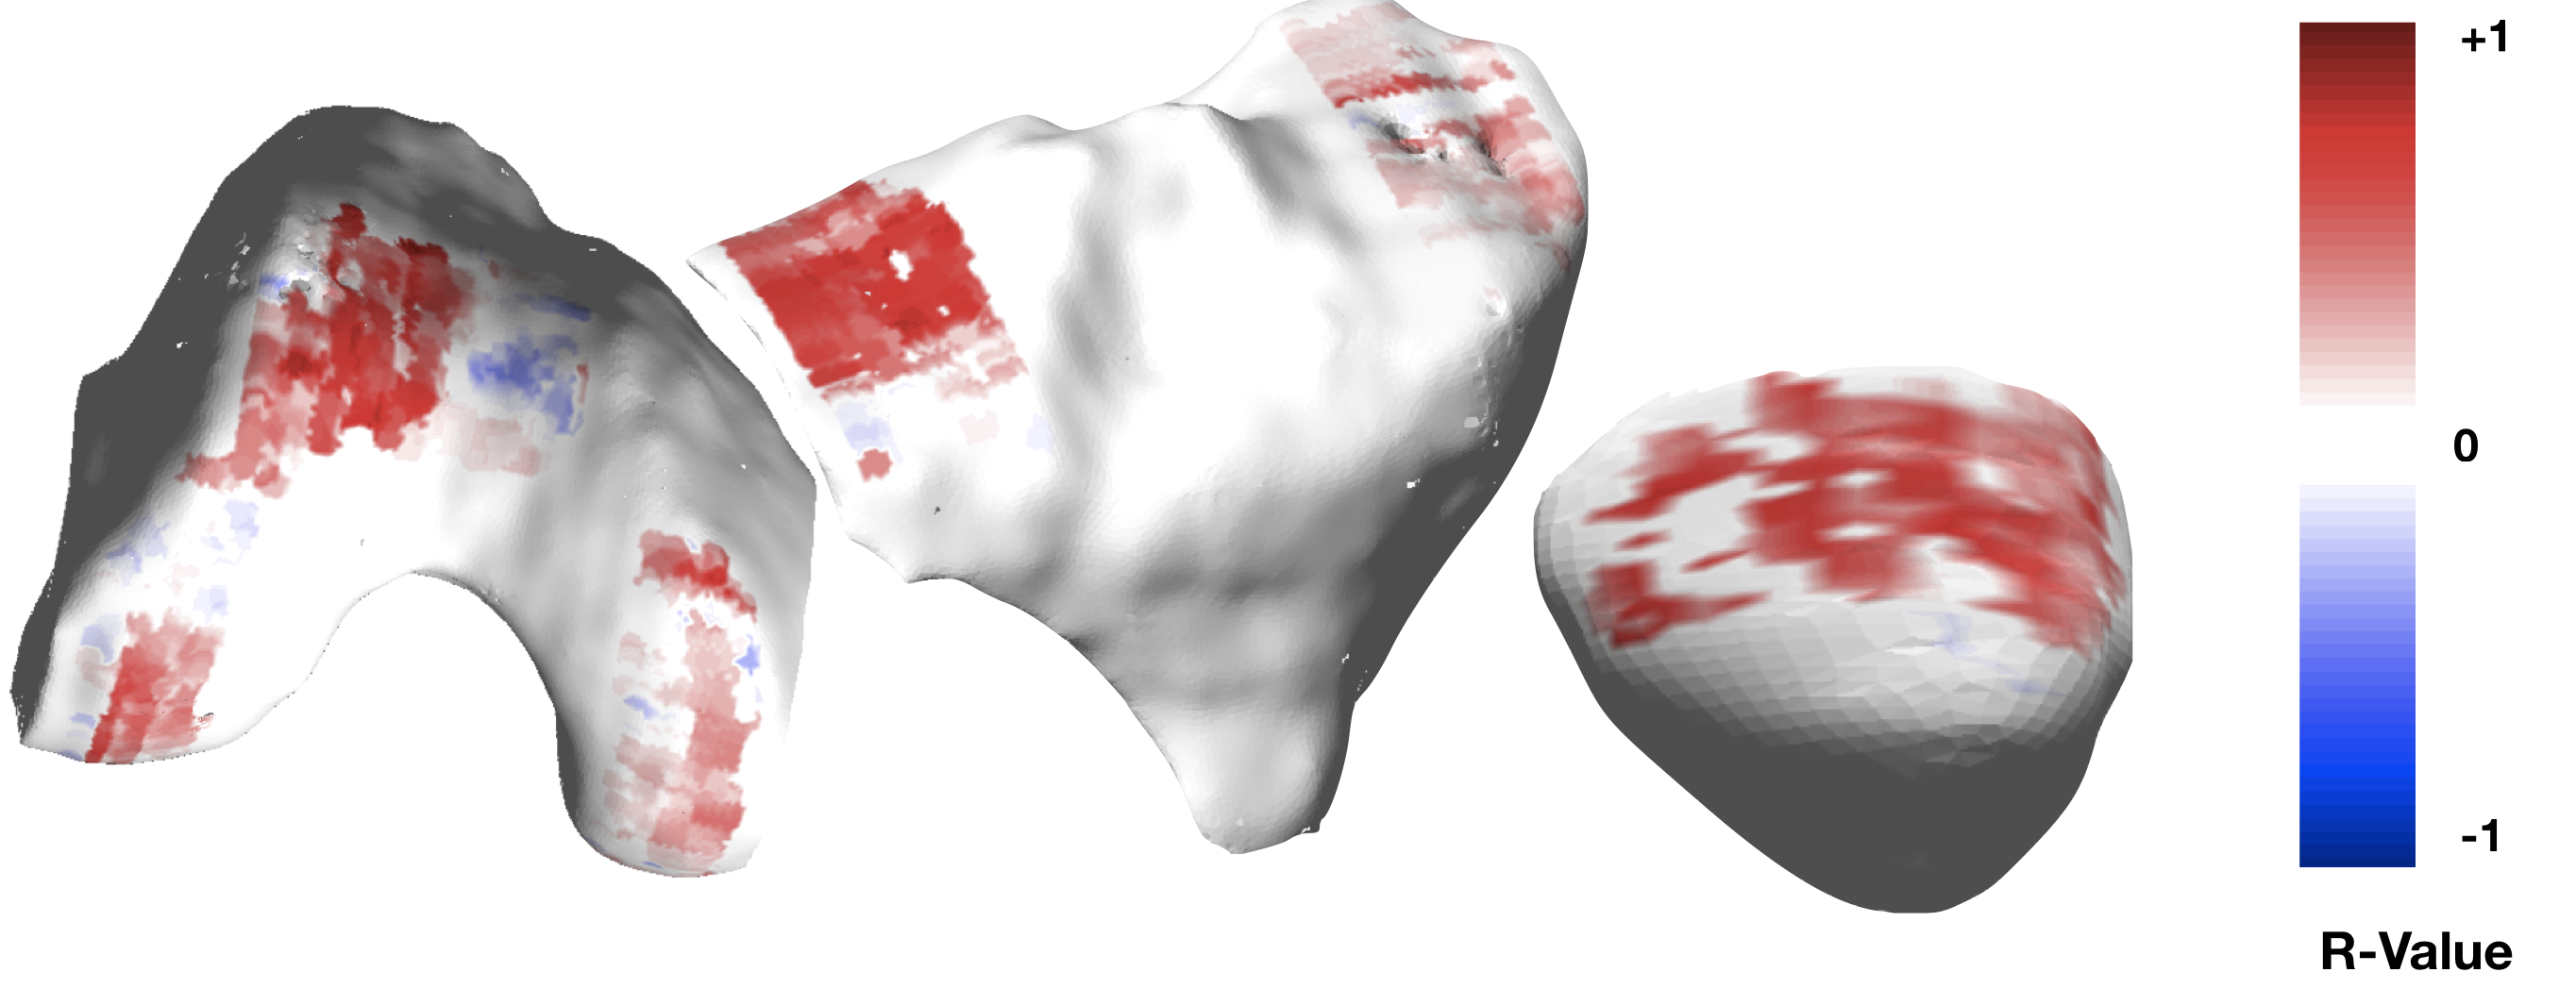
30 subjects with radiographic or symptomatic OA were recruited for this study, prepared with an intravenous catheter, positioned into a 3T TOF PET-MR scanner (GE Healthcare, Waukesha, WI). Subjects were injected with an average of 247.97 MBq [18F]-NaF for a 60 min PET scan (cylindrical size = 25cm). A Dixon fat-water sequence was acquired for MR-based attenuation correction (MRAC) of PET photons6. The MR images acquired simultaneously with PET included: (1) 3D isotropic CUBE FSE, and (2) 3D sagittal combined T1ρ/T2. MR acquisition parameters can be seen in Figure 17. All image analysis (Figure 1) was performed using an in-house program developed in MATLAB (Mathworks, Natick, MA). The 3D CUBE image was acquired in the sagittal plane, subsequently used for WORMS grading by a board-certified radiologist (M.B.)8. The sagittal T1ρ/T2 sequence was non-rigidly registered to a template (determined as a patient with average age, BMI), yielding T1ρ/T2 values in six cartilage compartments9. The static PET data was resampled to the sagittal T1ρ/T2 sequence coordinates and registered to the template. PET data was converted into SUV maps by using the patients’ weight and injected tracer activity10. MRI metrics (T1ρ,T2) were measured on the cartilage while PET metrics (SUV) were measured on the bone. Thus, T1ρ,T2 and SUV were projected onto the bone-cartilage interface: for each point along the interface, a trajectory perpendicular to it was first determined, the value of the parameter (T1ρ,T2, SUV) along this trajectory across the adjacent cartilage was then averaged and assigned to the corresponding point on the bone-cartilage interface. For bone SUV, regions of interest (ROIs) encompassing the subchondral bone were manually defined on the template for each knee compartment. The SUVs along the trajectory inside the bone and limited to the region were averaged and assigned to the corresponding point on the bone-cartilage interface. Once all the SUV, T1ρ,T2 values were projected on the same interface, a point-by-point Pearson correlation map (between T1ρ,T2 and SUV, T1ρ) was built for the femur, tibia and patella. The same data was used for a principal component analysis (PCA) to find patterns of interactions between T1ρ and SUV11. The modes of variation were explored to find these patterns. For each bone, a stepwise linear regression model was built to predict the cartilage lesion and bone abnormality (edema and cyst) scores from the first five modes of variation, while adjusting for age, gender and BMI.Results
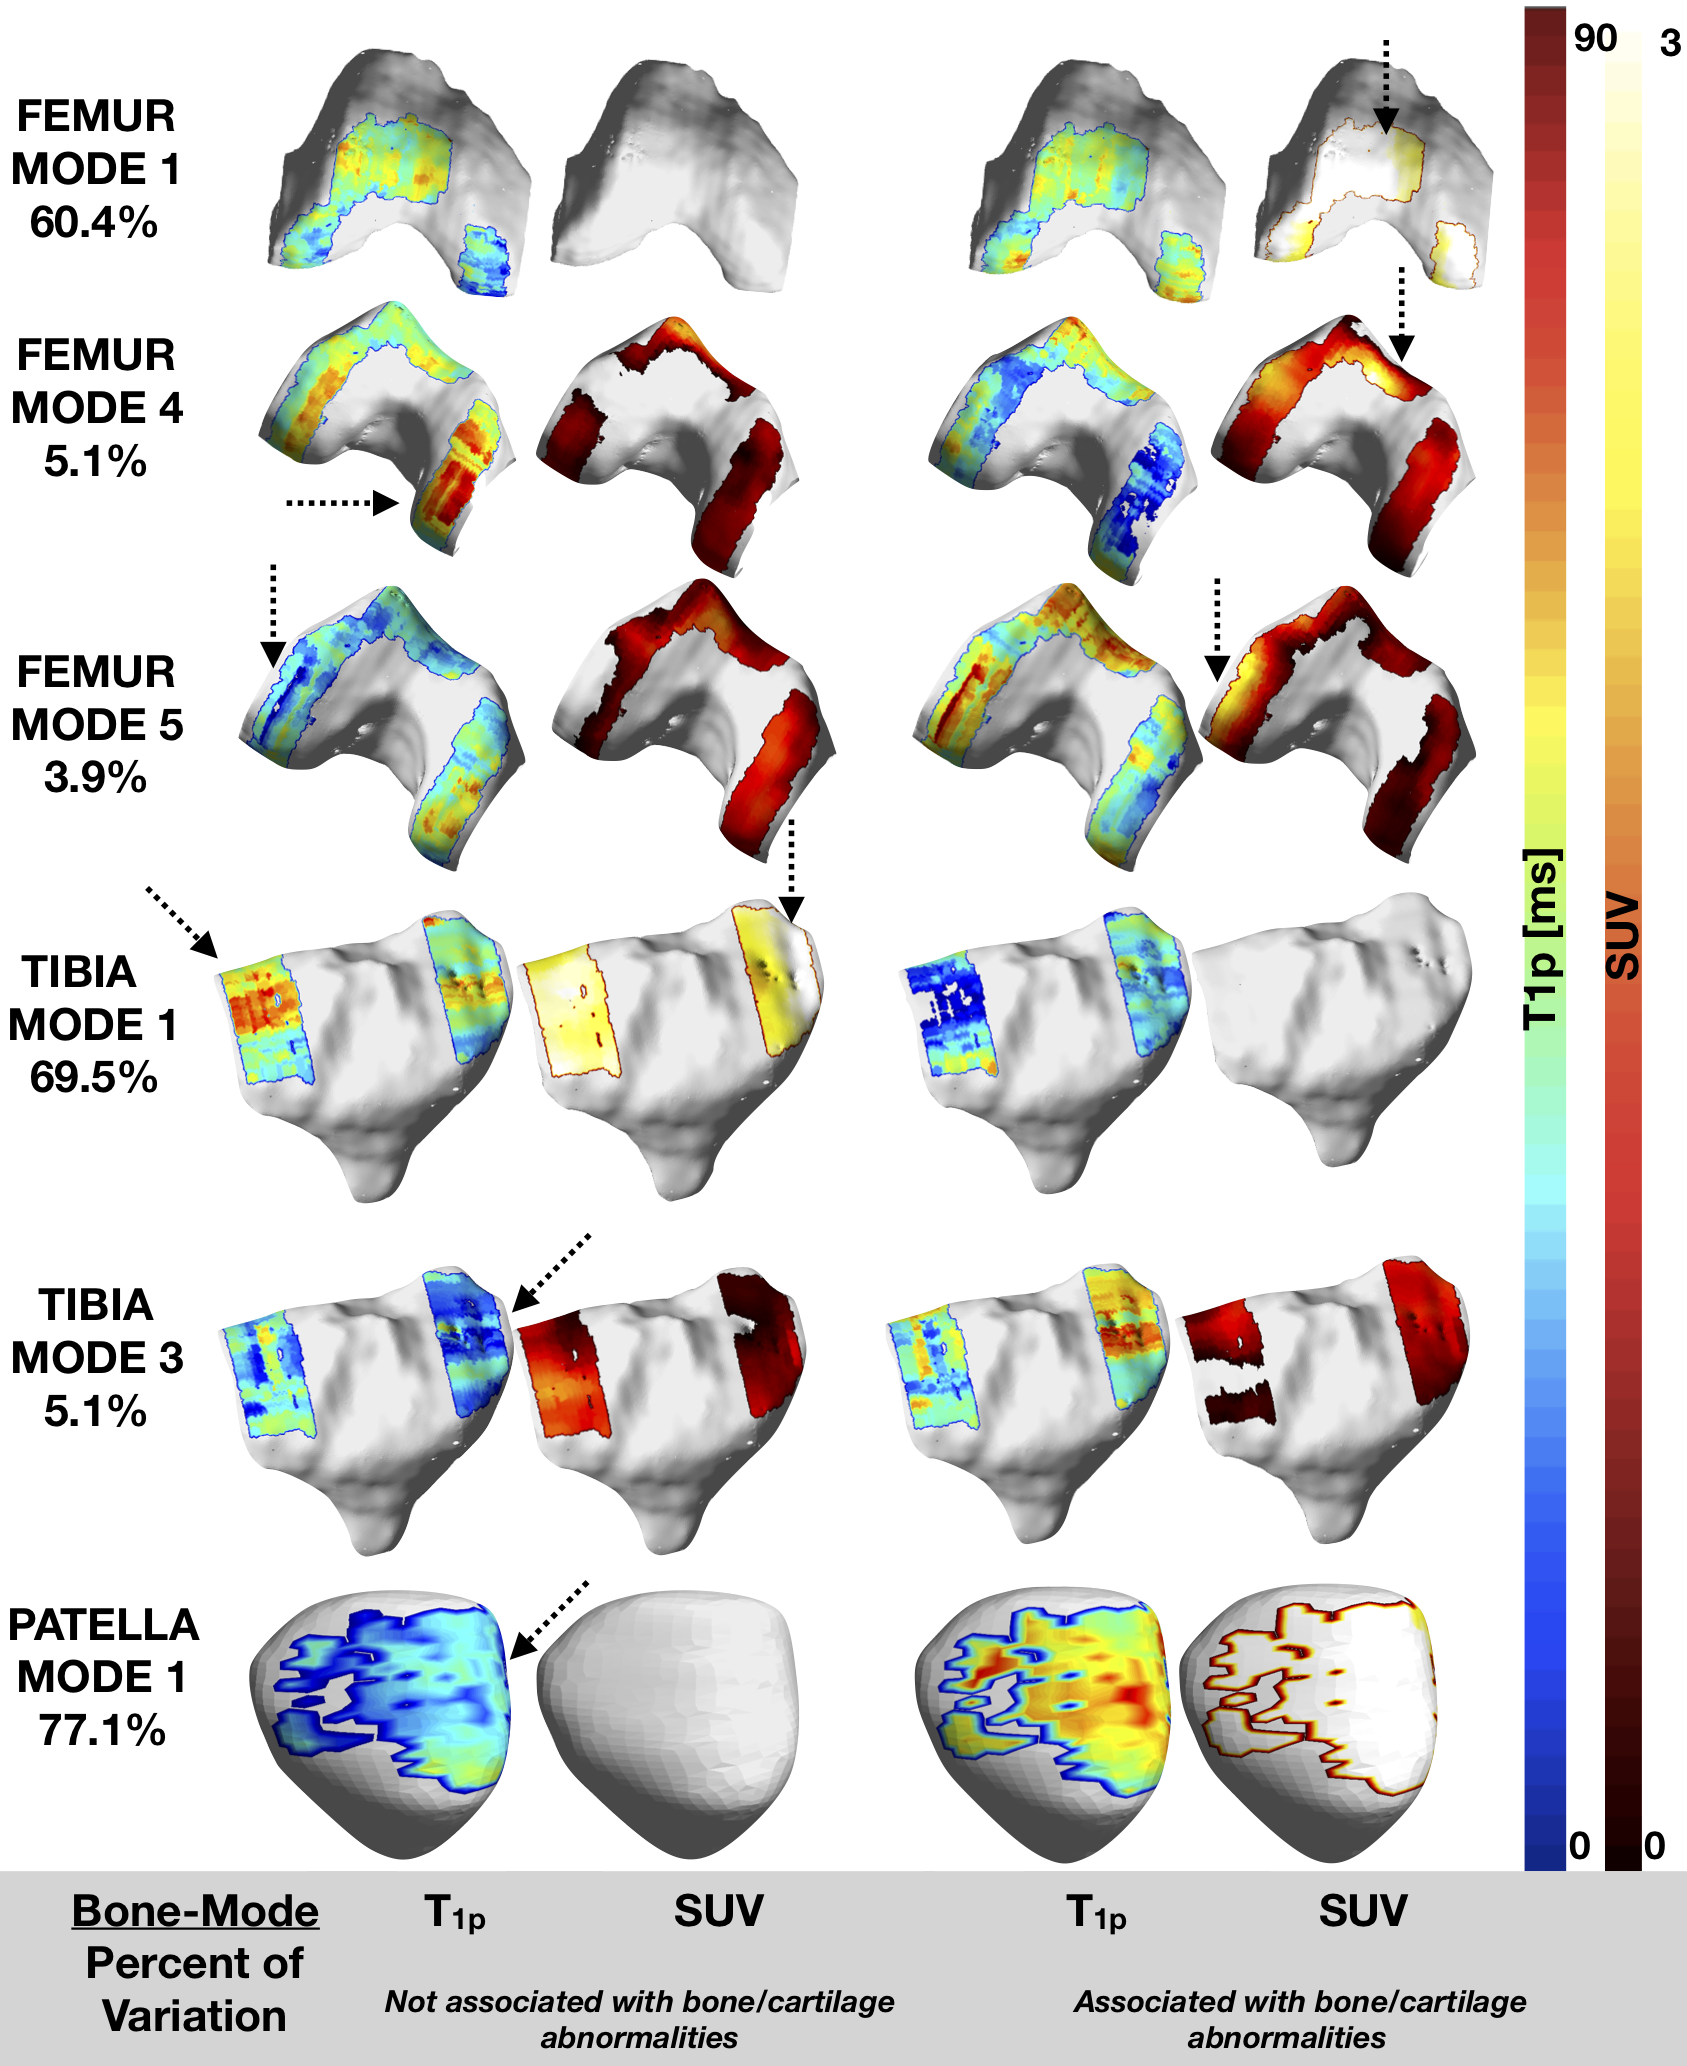
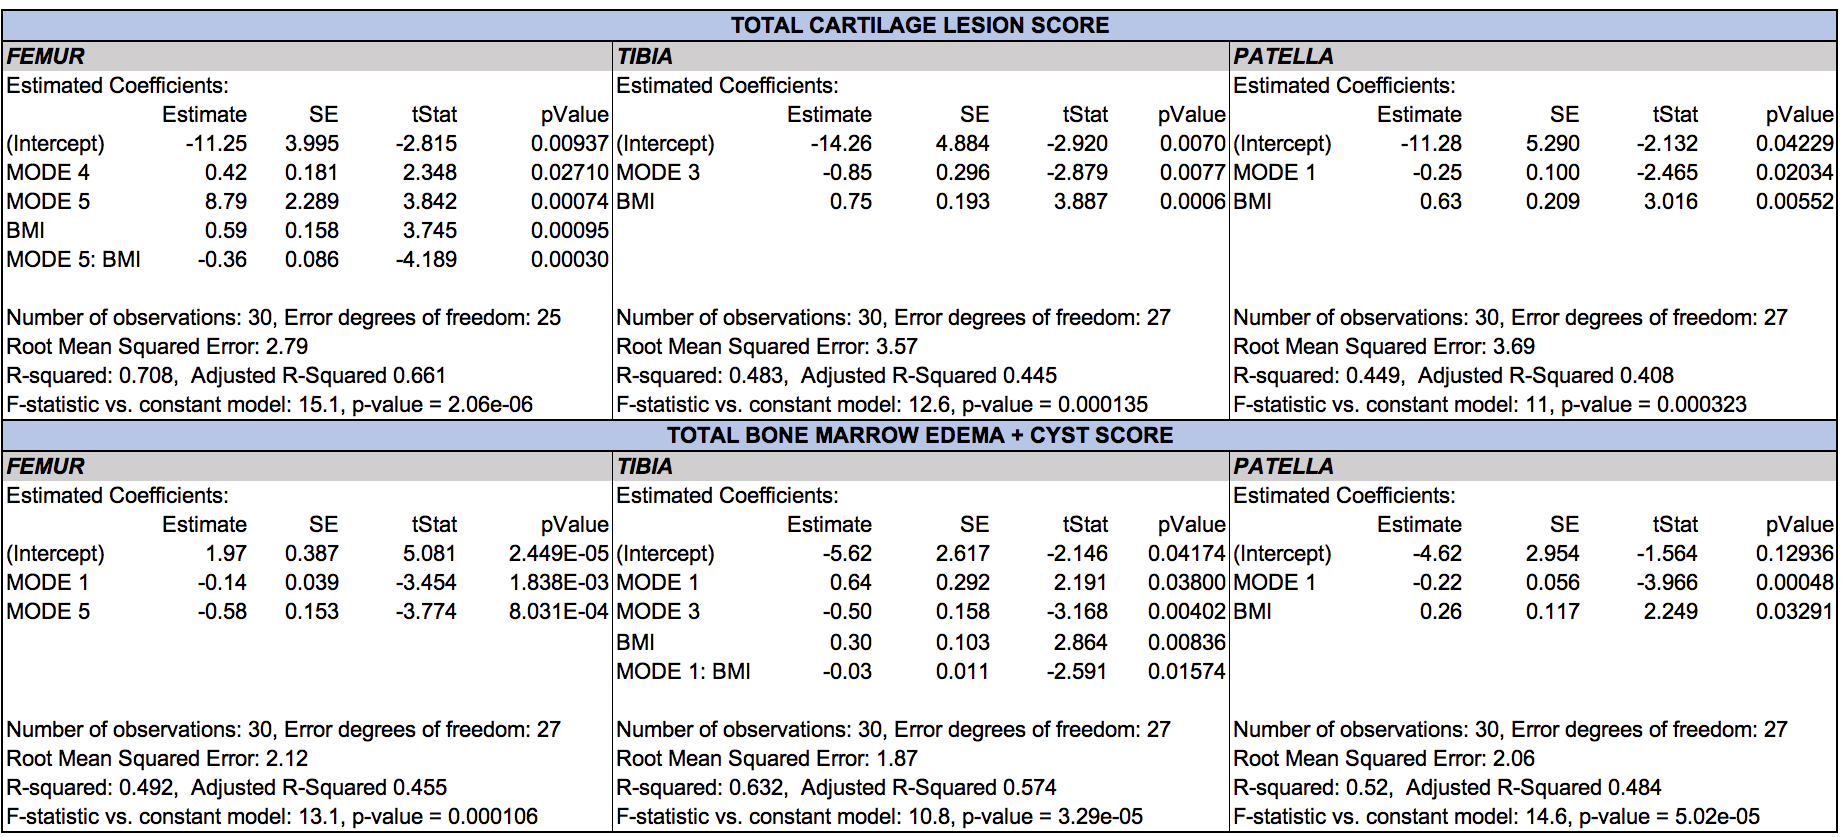
Patients recruited had age 55.90±8.60 years, BMI 25.14±3.45 Kg/m3, 33.33% females, 64% Kellgren-Lawrence (KL) 0-1, 14% KL=2 and 22% KL=312. The WORMS score showed that most lesions were in the patella and trochlea region (Figure 2), with correspondingly high mean T1ρ and SUV. Mostly positive associations were found between T1ρ and SUVs on a point-by-point basis (Figure 3). The T1ρ and T2 values were highly positively correlated, therefore T2 was not included in the PCA to avoid redundant information. The modes of variation that were retained in the regression results depicted different patterns of interaction between SUV and T1ρ, and can be visualized along with their descriptions (in caption) in Figure 4. Table 1 shows for mode 1, and an increasing SUV/T1ρ was associated with an increasing bone abnormality score in the femur (p=1.8E-03) and patella (p=0.0004), and the same trend for the tibia when interacting with BMI (p=0.01). For the cartilage lesion scores, mode 5 interacting with BMI was the most important predictor in the femur (p=0.0003), and while mode 3 and mode 1 were predictors, BMI was the most important predictor in the tibia (p=0.0006) and patella (p=0.005).Discussion and Conclusion
Principal component analysis revealed patterns of interaction between the cartilage and bone in Osteoarthritis. While mode 1 in all three bones was similar to a point-by-point correlation as expected, the other modes showed patterns which cannot be observed with a Pearson correlation. Mode 1, showing major variations throughout the bone was useful in predicting general bone abnormalities, and the smaller variation modes, showing more detailed patterns in the cartilages, were useful in predicting more specific cartilage lesions, showing that this method is able to find relevant patterns in Osteoarthritis that are not otherwise detected by averaging methods.Acknowledgements
Funding: GE Healthcare and NIH P50 AR060752References
1. Herrero-Beaumont G, Roman-Blas JA, Bruyere O, et al. Clinical settings in knee osteoarthritis: Pathophysiology guides treatment. Maturitas. 2017;96:54-57.
2. Kogan F, Fan AP, McWalter EJ, Oei EHG, Quon A, Gold GE. PET/MRI of metabolic activity in osteoarthritis: A feasibility study. J Magn Reson Imaging. 2017;45(6):1736-1745.
3. Tibrewala R, Bahroos E, Mehrabian H, et al. [(18) F]-Sodium Fluoride PET/MR Imaging for Bone-Cartilage Interactions in Hip Osteoarthritis: A Feasibility Study. J Orthop Res. 2019.
4. Savic D, Pedoia V, Seo Y, et al. Imaging Bone-Cartilage Interactions in Osteoarthritis Using [(18)F]-NaF PET-MRI. Mol Imaging. 2016;15:1-12.
5. Kobayashi N, Inaba Y, Tateishi U, et al. Comparison of 18F-fluoride positron emission tomography and magnetic resonance imaging in evaluating early-stage osteoarthritis of the hip. Nucl Med Commun. 2015;36(1):84-89.
6. Wagenknecht G, Kaiser HJ, Mottaghy FM, Herzog H. MRI for attenuation correction in PET: methods and challenges. MAGMA. 2013;26(1):99-113.
7. Li X, Han ET, Busse RF, Majumdar S. In vivo T(1rho) mapping in cartilage using 3D magnetization-prepared angle-modulated partitioned k-space spoiled gradient echo snapshots (3D MAPSS). Magn Reson Med. 2008;59(2):298-307.
8. Peterfy CG, Guermazi A, Zaim S, et al. Whole-Organ Magnetic Resonance Imaging Score (WORMS) of the knee in osteoarthritis. Osteoarthritis Cartilage. 2004;12(3):177-190.
9. Pedoia V, Li X, Su F, Calixto N, Majumdar S. Fully automatic analysis of the knee articular cartilage T1rho relaxation time using voxel-based relaxometry. J Magn Reson Imaging. 2016;43(4):970-980.
10. Kinahan PE, Doot RK, Wanner-Roybal M, et al. PET/CT Assessment of Response to Therapy: Tumor Change Measurement, Truth Data, and Error. Transl Oncol. 2009;2(4):223-230.
11. Jolliffe IT, Cadima J. Principal component analysis: a review and recent developments. Philos Trans A Math Phys Eng Sci. 2016;374(2065):20150202.
12. Kellgren JH, Lawrence JS. Radiological assessment of osteo-arthrosis. Ann Rheum Dis. 1957;16(4):494-502.
Figures