0257
Quantitative Assessment of Articular Cartilage Degeneration Using 3D Ultrashort Echo Time Cones Adiabatic T1ρ (3D UTE Cones AdiabT1ρ) Imaging1Department of Radiology, University of California, San Diego, San Diego, CA, United States, 2Department of Radiology, Guangzhou First People’s Hospital, School of Medicine, South China University of Technology, Guangzhou, China, 3Radiology Service, VA San Diego Healthcare System, San Diego, CA, United States
Synopsis
The study protocol included three-dimensional Ultrashort Echo Time Cones actual flip angle imaging (3D UTE-Cones-AFI) for T1 measurement and UTE-Cones with adiabatic T1ρ (AdiabT1ρ) preparation for AdiabT1ρ measurement. We applied the 3D UTE-Cones AdiabT1ρ sequence to healthy volunteers and patients with different degrees of OA for a systematic evaluation of its clinical performance. Results showed that the 3D UTE-Cones AdiabT1ρ sequence could be used for high resolution imaging and quantitative assessment of the knee cartilage, and that the AdiabT1ρ biomarker showed a significant positive relationship with WORMS.
Introduction
Knee osteoarthritis (OA) affects millions of people worldwide. The loss of proteoglycans (PGs) in articular cartilage is one of the most significant early changes in OA. Spin lattice relaxation in the rotating frame (T1ρ) has been proposed to probe this and other biochemical changes (1-3). However, a major confounding factor in regular continuous wave T1ρ (CW-T1ρ) imaging of articular cartilage is the magic angle effect (4-5). To address this challenge, researchers have proposed trains of adiabatic full passage (AFP) pulses to generate adiabatic T1ρ (AdiabT1ρ) relaxation (6-12). Previous studies have shown that AdiabT1ρ is less sensitive to the magic angle effect compared with CW-T1ρ relaxation in bovine cartilage (10, 11). However, the AdiabT1ρ sequence is based on conventional Cartesian data acquisition with an echo time (TE) of several milliseconds or longer, which is too long to image many knee joint tissues with short T2*s, such as the deep layers of articular cartilage, menisci, ligaments, and tendons (13-16). More recently, the combination of 3D ultrashort echo time (UTE) Cones data acquisition and adiabatic T1ρ preparation (3D UTE Cones-AdiabT1ρ) has been proposed for potentially magic angle-insensitive imaging of both short and long T2 tissues or tissue components in the knee joint. Preliminary studies of patellar cartilage show a much reduced magic angle effect as compared to CW-T1ρ and T2 (17). In this study, we aimed to apply this sequence to healthy volunteers and patients with different degrees of OA for a systematic evaluation of its clinical performance.Method
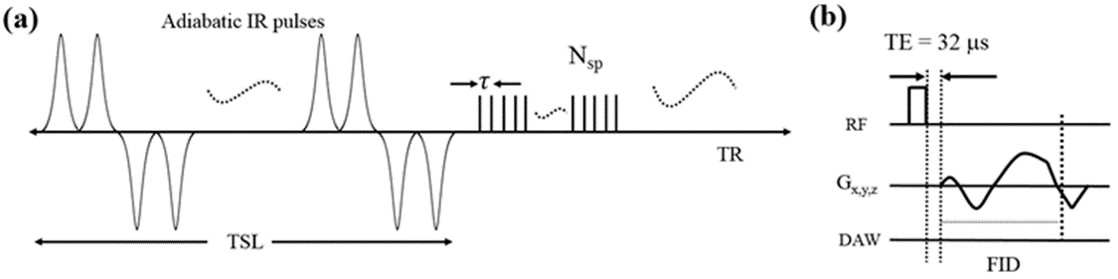
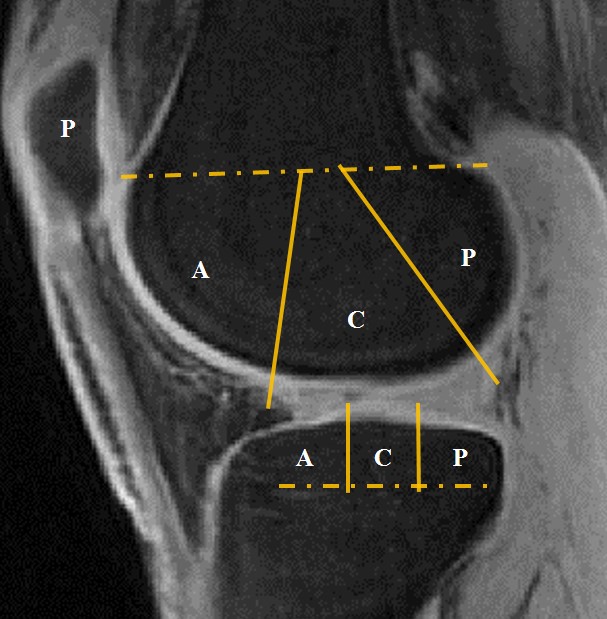
In this study a total of 65 human subjects (aged 20-88 years, mean age 54.8±16.9 years; 32males, 33 females; 28 left knees, 37 right knees) were recruited following approval from the Institutional Review Board. Written informed consent was obtained from each participant before 3D UTE Cones-AdiabT1ρ imaging (Figure 1) on a 3T clinical MR system (MR750, GE Healthcare, Milwaukee, WI). The imaging protocol included 3D UTE-Cones actual flip angle (AFI) imaging for B1 mapping, a variable flip angle (VFA) approach for T1 mapping, and AdiabT1ρ imaging (18,19). Typical imaging parameters included a field-of-view (FOV) of 15×15×10.8 cm3 and receiver bandwidth of 166 kHz. Other sequence parameters were: 1) 3D UTE-Cones AFI: TR1/TR2 = 20/100 ms, flip angle = 45°; 2) 3D VFA UTE-Cones: TR = 20 ms; flip angle = 5°, 10°, 20°, and 30°; 3) 3D AdiabT1ρ UTE-Cones with FatSat: TR = 500 ms; flip angle = 10°; number of spokes per Adiabatic preparation (Nsp) = 25; and pairs of adiabatic IR pulse (NIR) = 0, 2, 4, 6, 8, 12 and 16; corresponding to spin-locking time (TSL) of 0, 12, 24, 36, 48, 72, and 96 ms, respectively; with each sequence scan time = 2 min 34 sec (for a total scan time of 17 minutes for all seven TSLs). Radiography and clinical T2- and PD-weighted images were also obtained for morphological evaluation of cartilage degeneration. The elastix motion registration was applied before quantification. Articular cartilage was divided into 13 sub-regions (Figure 2). AdiabT1ρ values were compared with Modified Whole-Organ Magnetic Resonance Imaging Scores (MWORMS) (20) for all 65 human subjects.Results and Discussion
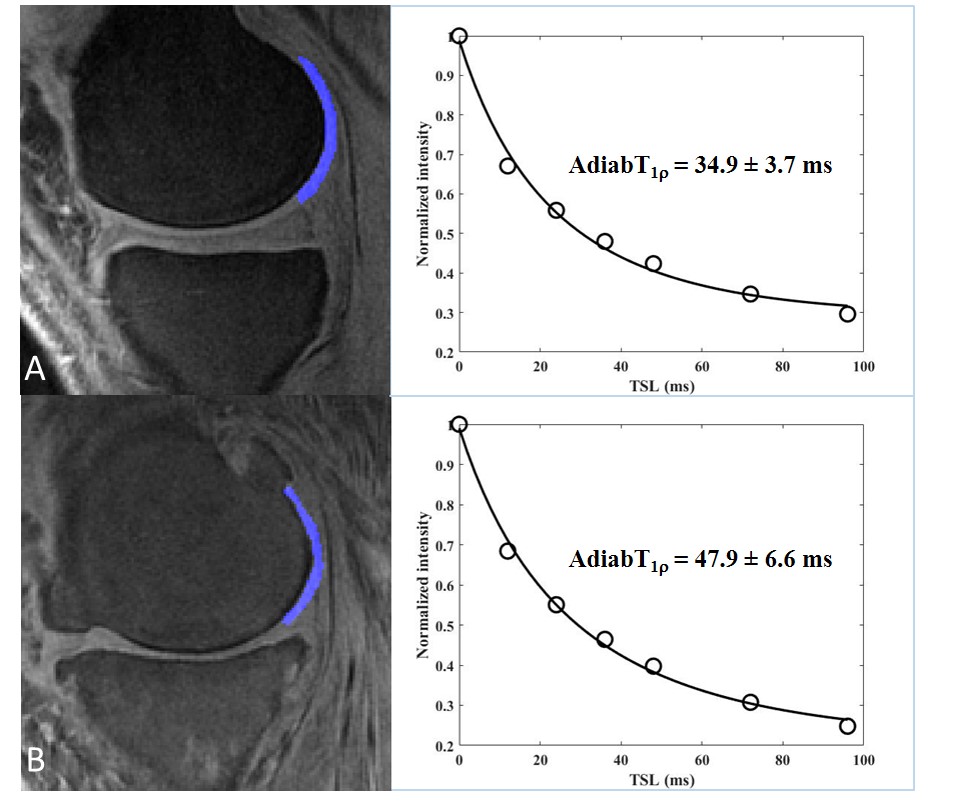
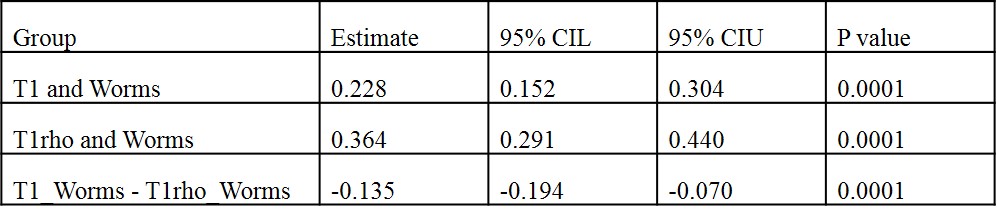
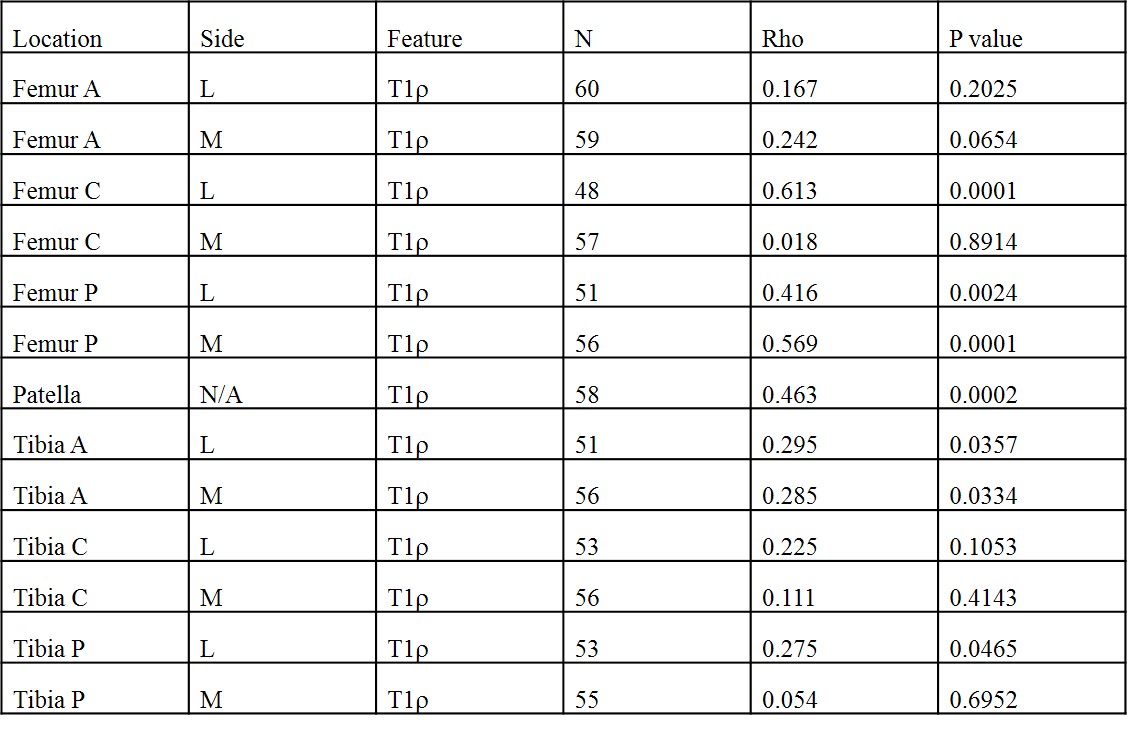
Figure 3 shows representative 3D UTE Cones-AdiabT1ρ images of the femoral articular cartilage of a normal volunteer and an OA patient, respectively. Excellent AdiabT1ρ fitting of the 3D AdiabT1ρ UTE-Cones images with different TSLs demonstrates a T1ρ of 34.9 ± 3.7 ms for the normal femoral condyle and 47.9 ± 6.6 ms for the abnormal femoral condyle, consistent with PG depletion in the latter case.All subjects were further subdivided into two groups (the extent groups include: WORMS 0 = controls, WORMS 1, 2, 2.5 = regional lesions, WORMS 3, 4, 5 = diffuse lesions; the depth groups include: WORMS 0 = controls, WORMS 1, 2, 3, 4 = partial thickness lesions, WORMS 2.5, 5 = full-thickness lesions) according to the extent and the depth of the cartilage lesions. The Spearman correlation coefficient showed a significant positive relationship between the T1ρ values, T1 values, and the WORMS (P < 0.001), as shown in Table 1. Additionally, T1ρ has a significantly higher correlation with WORMS than T1 does (Table 1). Table 2 further demonstrates the strong correlation between AdiabT1ρ values of some femur and patella sub-regions and WORMS by using a linear regression analysis (P < 0.0038).
The preliminary results from 65 human subjects demonstrate the potential of the 3D UTE-Cones AdiabT1ρ imaging sequence for quantitative evaluation of cartilage degeneration. This sequence can also be used for systematic evaluation of other knee joint tissues such as the menisci, ligaments, and tendons. A systematic evaluation of all the knee joint tissues will likely provide improved evaluation of OA. Limitations of this study are that the number of patients is relatively small and that the protocol is relatively long. However, the total scan time can be significantly reduced by using small number of TSLs, as well as more advanced image reconstruction and data processing techniques, such as parallel imaging, compressed sensing, and deep learning techniques.
Conclusion
The 3D UTE-Cones-AdiabT1ρ sequence can be used for high resolution imaging and quantitative assessment of the knee cartilage, and the AdiabT1ρ biomarker shows a significant positive relationship with WORMS.Acknowledgements
The authors are thankful for support from R01AR075825, 2R01AR062581, and 1R01AR068987.References
1. Duvvuri U, Reddy R, Patel SD, Kaufman JH, Kneeland JB, Leigh JS. T1rho-relaxation in articular cartilage: effects of enzymatic degradation. Magn Reson Med 1997; 38:863-867.
2. Regatte RR, Akella SVS, Lonner JH, Kneeland JB, Reddy R. T1ρ relaxation mapping in human osteoarthritis (OA) cartilage: comparison of T1ρ with T2. J Magn Reson Imaging 2006; 23:547-553.
3. Li X, Han ET, Ma B, Link TM, Newitt DC, Majumdar S. In vivo 3T spiral imaging based multi-slice T1ρ mapping of knee cartilage in osteoarthritis. Magn Reson Med 2005; 54:929-936.
4. Du J, Statum S, Znamirowski R, Bydder GM, Chung CB. Ultrashort TE T1ρ magic angle imaging. Magn Reson Med 2013; 1:69(3):682-687.
5. Shao H, Pauli C, Li S, Ma Y, Tadros AS, Kavanaugh A, Chang EY, Tang G, Du J. Magic angle effect plays a major role in both T1rho and T2 relaxation in articular cartilage. Osteoarthritis Cartilage 2017; 25:2022-2030.
6. Garwood M, DelaBarre L. The return of the frequency sweep: designing adiabatic pulses for contemporary NMR. J Magn Reson. 2001; 153: 155-177.
7. Michaeli S, Grohn H, Grohn O, Sorce DJ, Kauppinen R, Springer CS Jr, Uğurbil K, Garwood M. Exchange-influenced T2rho contrast in human brain images measured with adiabatic radio frequency pulses. Magn Reson Med. 2005; 53(4): 823-829.
8. Michaeli S, Sorce DJ, Springer CS Jr, Ugurbil K, Garwood M. T1rho MRI contrast in the human brain: modulation of the longitudinal rotating frame relaxation shutter-speed during an adiabatic RF pulse. J Magn Reson. 2006; 181: 135-147.
9. Casula V, Autio J, Nissi MJ, Auerbach EJ, Ellermann J, Lammentausta E, Nieminen MT. Validation and optimizationof adiabatic T1ρ and T2ρ for quantitative imaging of articular cartilage at 3 T. Magn Reson Med. 2017; 77(3): 1265-1275.
10. Nissi MJ, Mangia S, Michaeli S, Nieminen MT. Orientation anisotropy of rotating frame and T2 relaxation parameters in articular cartilage. In: Proceedings of the 21st Annual Meeting of ISMRM, Salt Lake City, UT, 2013. Abstract 3552.
11. Hänninen N, Rautiainen J, Rieppo L, Saarakkala S, Nissi MJ. Orientation anisotropy of quantitative MRI relaxation parameters in ordered tissue. Sci Rep. 2017; 7(1): 9606.
12. Zhang J, Nissi MJ, Idiyatullin D, Michaeli S, Garwood M, Ellermann J. Capturing fast relaxing spins with SWIFT adiabatic rotating frame spin–lattice relaxation (T1ρ) mapping. NMR Biomed. 2016; 29(4): 420-430.
13. Chang EY, Du J, Bae WC, Chung CB. Qualitative and quantitative ultrashort echo time imaging of musculoskeletal tissues. Semin Musculoskelet Radiol. 2015; 19(4): 375-386.
14. Du J, Carl M, Diaz E, Takahashi A, Han E, Szeverenyi NM, Chung CB, Bydder GM. Ultrashort TE T1rho (UTE T1rho) imaging of the Achilles tendon and meniscus. Magn Reson Med. 2010; 64(3): 834-842.
15. Du J, Carl M, Bae WC, Statum S, Chang EY, Bydder GM, Chung CB. Dual inversion recovery ultrashort echo time (DIR-UTE) imaging and quantification of the zone of calcified cartilage (ZCC). Osteoarthritis Cartilage. 2013; 21(1): 77-85.
16. Ma YJ, Carl M, Shao H, Tadros AS, Chang EY, Du J. Three-dimensional ultrashort echo time cones T1ρ (3D UTE-cones-T1ρ) imaging. NMR Biomed. 2017; 30(6):1-8.
17. Wu M, Ma Y, Wan L, Guo T, Jerban S, Jang H, Chang EY, Du J. Assessment of the Angular Dependence of 3D Ultrashort Echo Time Cones Adiabatic T1ρ (3D UTE-Cones-AdiabT1ρ) Imaging. In: Proceedings of the 27th Annual Meeting of ISMRM, Montreal, Canada, 2019. Program #1313.
18. Carl M, Bydder GM, Du J. UTE imaging with simultaneous water and fat signal suppression using a time-efficient multispoke inversion recovery pulse sequence. Magn Reson Med 2016; 76:577–582.
19. Ma YJ, Lu X, Carl M, Zhu Y, Szeverenyi N, Bydder GM, Chang E, Du J. Accurate T1 mapping of short T2 tissues using a three-dimensional ultrashort echo time cones actual flip angle – variable TR (3D UTE-Cones AFI-VTR) method. Magn Reson Med. 2018; 80(2):598-608.
20. Peterfy CG, Guermazi A, Zaim S, et al. Whole-Organ Magnetic Resonance Imaging Score (WORMS) of the knee in osteoarthritis. Osteoarthritis Cartilage. 2004, 12(3):177-190.
Figures