0256
Lymphatic insufficiency observed by noninvasive MR lymphangiography and multi-nuclear 23Na-MRI in patients with lymphedema and lipedema1Radiology, Vanderbilt University Medical Center, Nashville, TN, United States, 2Dayani Center for Health and Wellness, Vanderbilt University Medical Center, Nashville, TN, United States, 3Physical Medicine and Rehabilitation, Vanderbilt University Medical Center, Nashville, TN, United States, 4Cardiovascular Medicine, Vanderbilt University Medical Center, Nashville, TN, United States, 5Neurology, Vanderbilt University Medical Center, Nashville, TN, United States, 6Psychiatry, Vanderbilt University Medical Center, Nashville, TN, United States
Synopsis
The lymphatic system comprises a central component of the circulatory system, yet imaging approaches to visualize lymphatics remain underdeveloped. We utilized MR lymphangiography and sodium MRI to confirm lymphatic impairment in patients with lymphedema of known causes, and in patients with the adipose disorder lipedema of unknown etiology. We report distinct profiles on MR lymphangiography that correlate with tissue sodium and fat deposition. Results provide evidence of lymphatic involvement in lipedema that informs disease mechanisms related to swelling, and more broadly relates to lymphatic clearance dysfunction in a range of diseases where sodium and fat are implicated.
Introduction
The lymphatic system comprises a central component of the human circulatory system, functioning in immune surveillance(1), blood-pressure control(2,3), and clearance of macromolecules and tissue sodium(4). Lymphatic impairment plays a role in cancer metastasis(5), cancer treatment comorbidities including lymphedema(6), and adipose disorders(7). Yet imaging approaches to visualize lymphatics and study disease mechanisms remain substantially underdeveloped relative to their blood counterparts. Recently, MRI relaxation times were measured in human lymphoid tissue(8) and lymphatic fluid(9). These measurements enabled parameterization of long turbo-spin-echo (TSE) approaches for imaging lymphatic vasculature(10,11) which show contrast consistent with lymphatic impairment in patients with secondary lymphedema of known origin. These approaches provide a foundation for performing non-invasive MR lymphangiography, yet their applications are only beginning to be evaluated. The goal of this work was to develop a radiologic scoring system for MR lymphangiography based upon contrast in a lymphatic disease of know origin, secondary lymphedema following lymph node removal for cancer therapy. Then, we applied this scoring system in patients with the adipose disorder lipedema, in which lymphatic involvement is suspected given clinical evidence of swelling and MRI measurement of sodium and fat in the legs(12). We hypothesized that (i) a radiological score for MR lymphangiography can differentiate varying degrees of lymphatic impairment in patients with lymphedema, lipedema, or healthy controls, and (ii) a positive relationship exists between lymphangiography contrast and tissue sodium and fat content.Methods
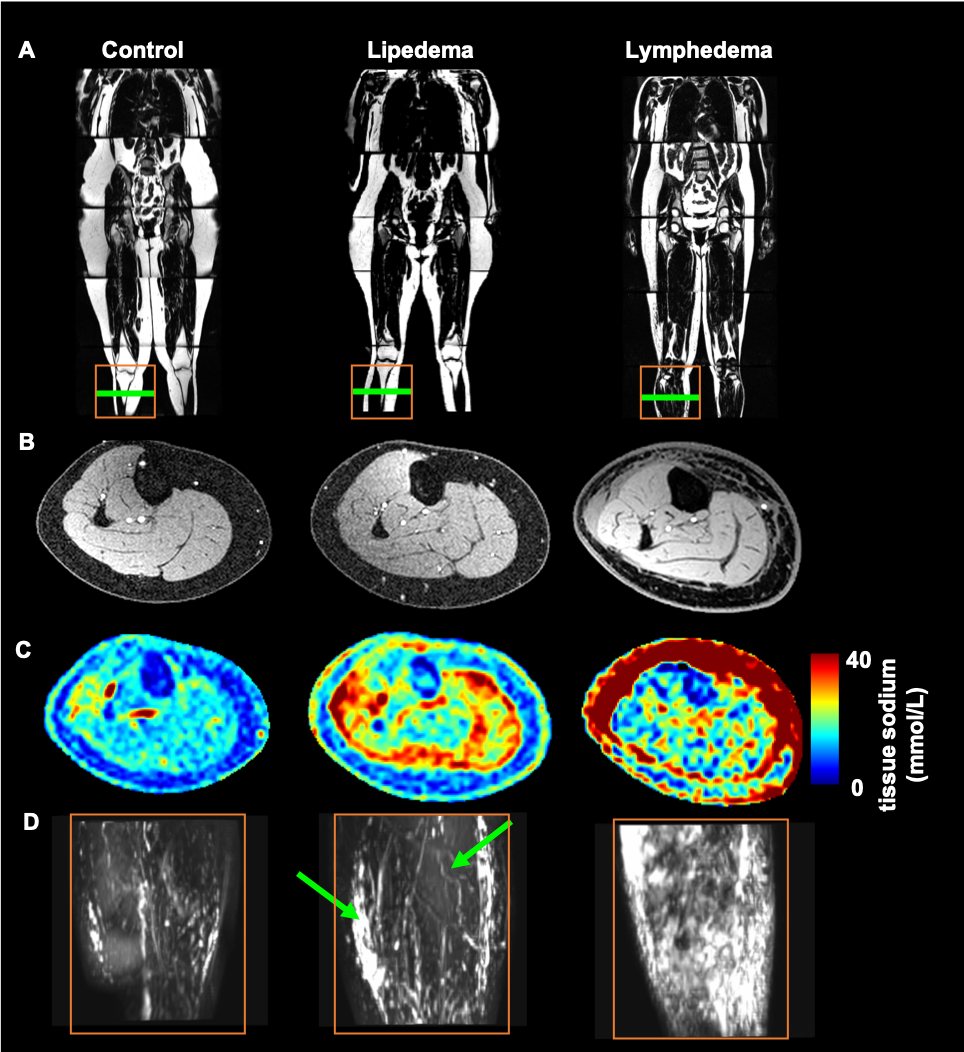
Participants (n=32) provided informed consent. Enrolled participants met clinical criteria for lipedema (n=22), or secondary leg lymphedema (n=6) following inguinal or pelvic lymph node removal during cancer therapy. Controls were matched for BMI, race, and sex (n=14).MRI acquisition. Multi-nuclear 23Na/1H MRI of the legs was performed at 3.0T (Philips Ingenia D-Stream, Philips Healthcare, Best, The Netherlands, Figure 1).
Proton 1H imaging was used to acquire non-tracer-based MR lymphangiography in the lower extremities bilaterally with a 16-channel anterior coil (3D TSE, TR/TE=3000/600 ms, TSE-factor=90, field-of-view=445x241x180 mm3, spatial resolution=1.39 x 1.39 x 3 mm3, refocusing angle=110°, 60 mm thick rest slabs placed 20 mm inferior and superior to imaging FOV, averages=2, duration=10min 51s).
Sodium 23Na imaging was acquired in the dominant or affected limbs with a quadrature single-tuned knee coil (Rapid Biomedical GmbH, Rimpar, Germany) following published methods (TR/TE=130/0.99 ms; FOV=192x192 mm2, in-plane spatial resolution=3x3 mm2; slice thickness=30 mm; flip angle=90°; scan duration=15 min 54 s). Four aqueous sodium standards containing physiologic concentrations of NaCl (10, 20, 30, and 40 mmol/L) were embedded in the FOV and used for signal calibration.
In an identical FOV as sodium imaging, multi-point Dixon imaging was acquired using the body coil (TR=200 ms, TE1=1.15 ms, TE2=2.30 ms; in-plane spatial resolution=1x1 mm2; slice thickness=5 mm; flip angle=90°, scan duration=4 min).
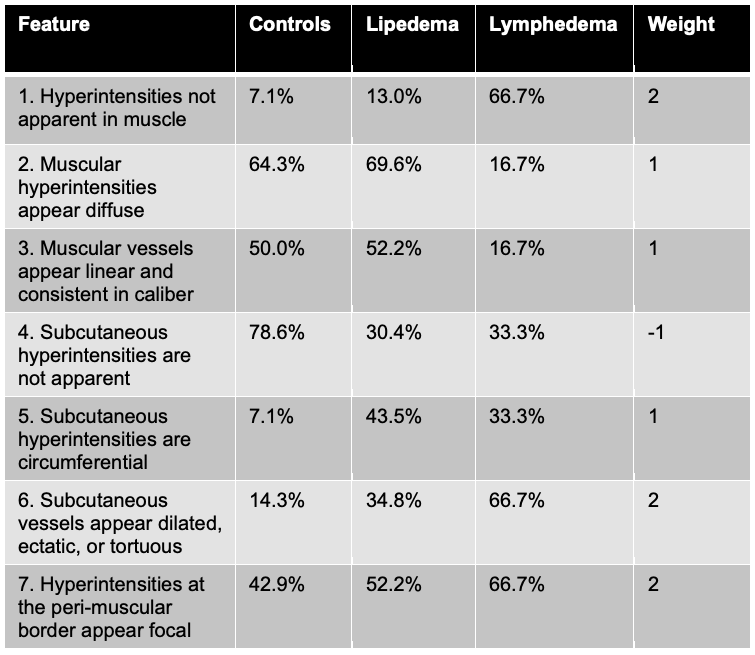
Lymphangiography analysis. MR lymphangiography images were independently evaluated in a blinded review by two board-certified radiologists with musculoskeletal subspecialty training. On the transverse view, the appearance of hyperintensities was graded as either localized, diffuse, or not apparent in (i) muscular, (ii) subcutaneous, and (iii) interface between musclar and subcutaneous compartments (i.e. peri-muscular). On the maximum-intensity-projection (MIP) view, the appearance of vascular structures (hyperintensities continuous between slices) were graded as either dilated/ectatic/tortuous, linear and consistent in caliber, or not apparent in each compartment (i-iii). In total, 15 features were scored as either present (1) or absent (0), and the frequency calculated. The most frequent features were combined in a weighted summation (Table 1) to calculate a lymphangiography score (0-9).
Fat and sodium analysis. Tissue sodium content (TSC) maps were calculated from a linear calibration in the sodium standards. The skin was segmented on the Dixon water-weighted image and applied to the sodium map to calculate mean TSC (mmol/L). Fat-fraction (ratio) of fat and non-fat soft tissue areas (muscle+skin) was computed from the Dixon fat-weighted and water-weighted images of the calf.
Statistical analysis. Group differences in imaging metrics were evaluated using a one-way ANOVA with significance criteria p<0.05. A logistic regression model of the radiological score was evaluated, using independent variables of TSC, fat-fraction, and age (32 observations, 28 degrees of freedom, significance criteria p<0.05).
Results
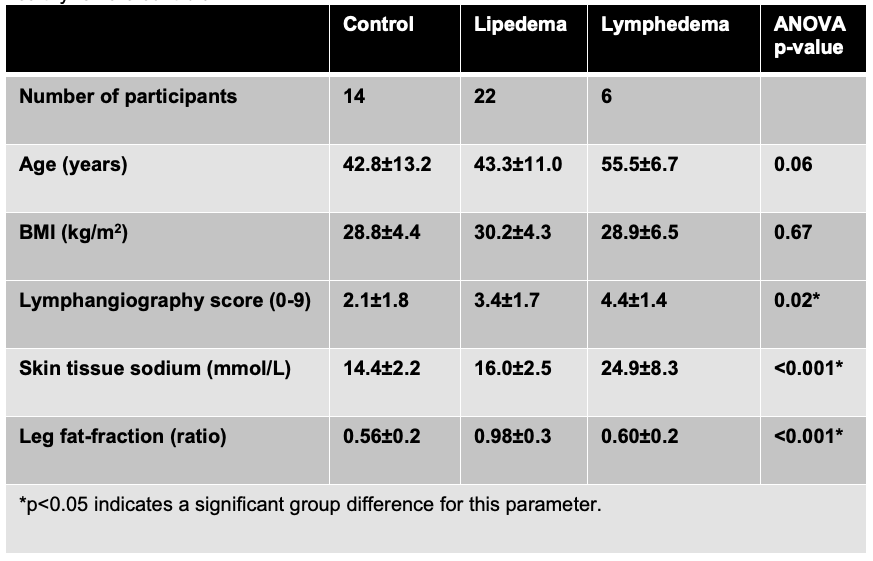
Patients with lymphedema and lipedema display distinct profiles of image contrast on MR lymphangiography and multi-nuclear imaging (Figure 1). Radiological scoring of MR lymphangiography revealed the most frequent (>40%) features of hyperintensities according to group (Table 1). Quantitative analyses revealed significantly different lymphangiography scores, TSC, and fat-fraction between groups (Table 2). The lymphangiography score can be modeled (model p=0.04) as a linear function of TSC (β=0.15, p=0.02) and fat-fraction (β=1.6, p=0.04), with age as a co-variate (β=-0.03, p=0.33).Discussion
We report a radiological scoring system for lymphatic impairment based on noninvasive MR lymphangiography contrast, which is highest in patients with lymphedema, and differential in patients with lipedema compared to healthy controls. This finding indicates lymphatic involvement in the setting of lipedema. Further, the severity of impairment visualized on MR lymphangiography is associated with quantitative metrics of tissue sodium and fat deposition in patients with lower-extremity swelling.Conclusion
Noninvasive MR lymphangiography and sodium MRI have potential to provide imaging tools for further assessing lymphatic impairment and clearance dysfunction in a range of comorbidities where tissue sodium and fat are known to accumulate.Acknowledgements
Imaging experiments were performed in the Vanderbilt Human Imaging Core, using research resources supported by the National Institutes of Health (NIH) grant 1S10OD021771-01. We are grateful to Charles Nockowski, Christopher Thompson, Leslie McIntosh, and Clair Jones for experimental support. Recruitment through www.ResearchMatch.org is supported by the National Center for Advancing Translational Sciences (NCATS) Clinical Translational Science Award (CTSA) Program, award number 5UL1TR002243-03. Funding was provided by the Lipedema Foundation (LF) Postdoctoral Research Fellowship, LF Collaborative Grant #12, the NIH/NINR 1R01NR015079, and the Institutional National Research Service Award (NRSA) T32 EB001628. The content is solely the responsibility of the authors and does not necessarily represent the official views of the NIH.References
1 Tawakol, A. et al. Association of Arterial and Lymph Node Inflammation With Distinct Inflammatory Pathways in Human Immunodeficiency Virus Infection. JAMA Cardiol 2, 163-171, doi:10.1001/jamacardio.2016.4728 (2017).
2 Wiig, H. et al. Immune cells control skin lymphatic electrolyte homeostasis and blood pressure. J Clin Invest 123, 2803-2815, doi:10.1172/JCI60113 (2013).
3 Johnson, R. S., Titze, J. & Weller, R. Cutaneous control of blood pressure. Curr Opin Nephrol Hypertens 25, 11-15, doi:10.1097/MNH.0000000000000188 (2016).
4 Machnik, A. et al. Mononuclear phagocyte system depletion blocks interstitial tonicity-responsive enhancer binding protein/vascular endothelial growth factor C expression and induces salt-sensitive hypertension in rats. Hypertension 55, 755-761, doi:10.1161/HYPERTENSIONAHA.109.143339 (2010).
5 Karaman, S. & Detmar, M. Mechanisms of lymphatic metastasis. J Clin Invest 124, 922-928, doi:10.1172/JCI71606 (2014).
6 Rockson, S. G. Lymphedema after Breast Cancer Treatment. N Engl J Med 380, 694, doi:10.1056/NEJMc1817537 (2019).
7 Hoffner, M., Peterson, P., Mansson, S. & Brorson, H. Lymphedema Leads to Fat Deposition in Muscle and Decreased Muscle/Water Volume After Liposuction: A Magnetic Resonance Imaging Study. Lymphat Res Biol 16, 174-181, doi:10.1089/lrb.2017.0042 (2018).
8 Crescenzi, R. et al. 3.0 T relaxation time measurements of human lymph nodes in adults with and without lymphatic insufficiency: Implications for magnetic resonance lymphatic imaging. NMR Biomed 31, e4009, doi:10.1002/nbm.4009 (2018).
9 Rane, S. et al. Clinical feasibility of noninvasive visualization of lymphatic flow with principles of spin labeling MR imaging: implications for lymphedema assessment. Radiology 269, 893-902, doi:10.1148/radiol.13120145 (2013).
10 Crescenzi, R. et al. Lymphedema evaluation using noninvasive 3T MR lymphangiography. J Magn Reson Imaging 46, 1349-1360, doi:10.1002/jmri.25670 (2017).
11 Arrive, L. et al. Primary lower limb lymphoedema: classification with non-contrast MR lymphography. Eur Radiol, doi:10.1007/s00330-017-4948-z (2017).
12 Crescenzi, R. et al. Tissue Sodium Content is Elevated in the Skin and Subcutaneous Adipose Tissue in Women with Lipedema. Obesity (Silver Spring) 26, 310-317, doi:10.1002/oby.22090 (2018).
Figures