0252
Automated Grading of Lumbar Disc Degeneration Using T-test Regularized Network1Department of Radiology, Peking University First Hospital, Beijing, China, 2College of Engineering, Peking University, Beijing, China, 3Academy for Advanced Interdisciplinary Studies, Peking University, Beijing, China
Synopsis
To enrich the representation capability of the CNN model and achieve more accurate lumbar disc degeneration grading, inspired by student T-test in statistics, we propose a T-test regularization strategy focusing on pushing away different categories from each other in feature space.
Introduction
Lumbar disc degeneration (LDD) is the leading cause of lower back pain and has the risk of disability worldwide. Clinically, grading of LDD is a necessary step for making suitable treatment plan. Literately, a lot of investigations were devoted to performing automated intervertebral disc (IVD) degeneration grading from traditional hand-crafted feature based[1] and recent deep learning based[2, 3] methods. Deep learning is still limited in this task even with learned discriminative features because the small differences between different categories. In this paper, to enrich the representation capability of the CNN model and achieve more accurate IVD degeneration grading, inspired by student T-test in statistics[4], we propose a T-test regularization (TR) strategy focusing on pushing away different categories from each other in feature space.Methods
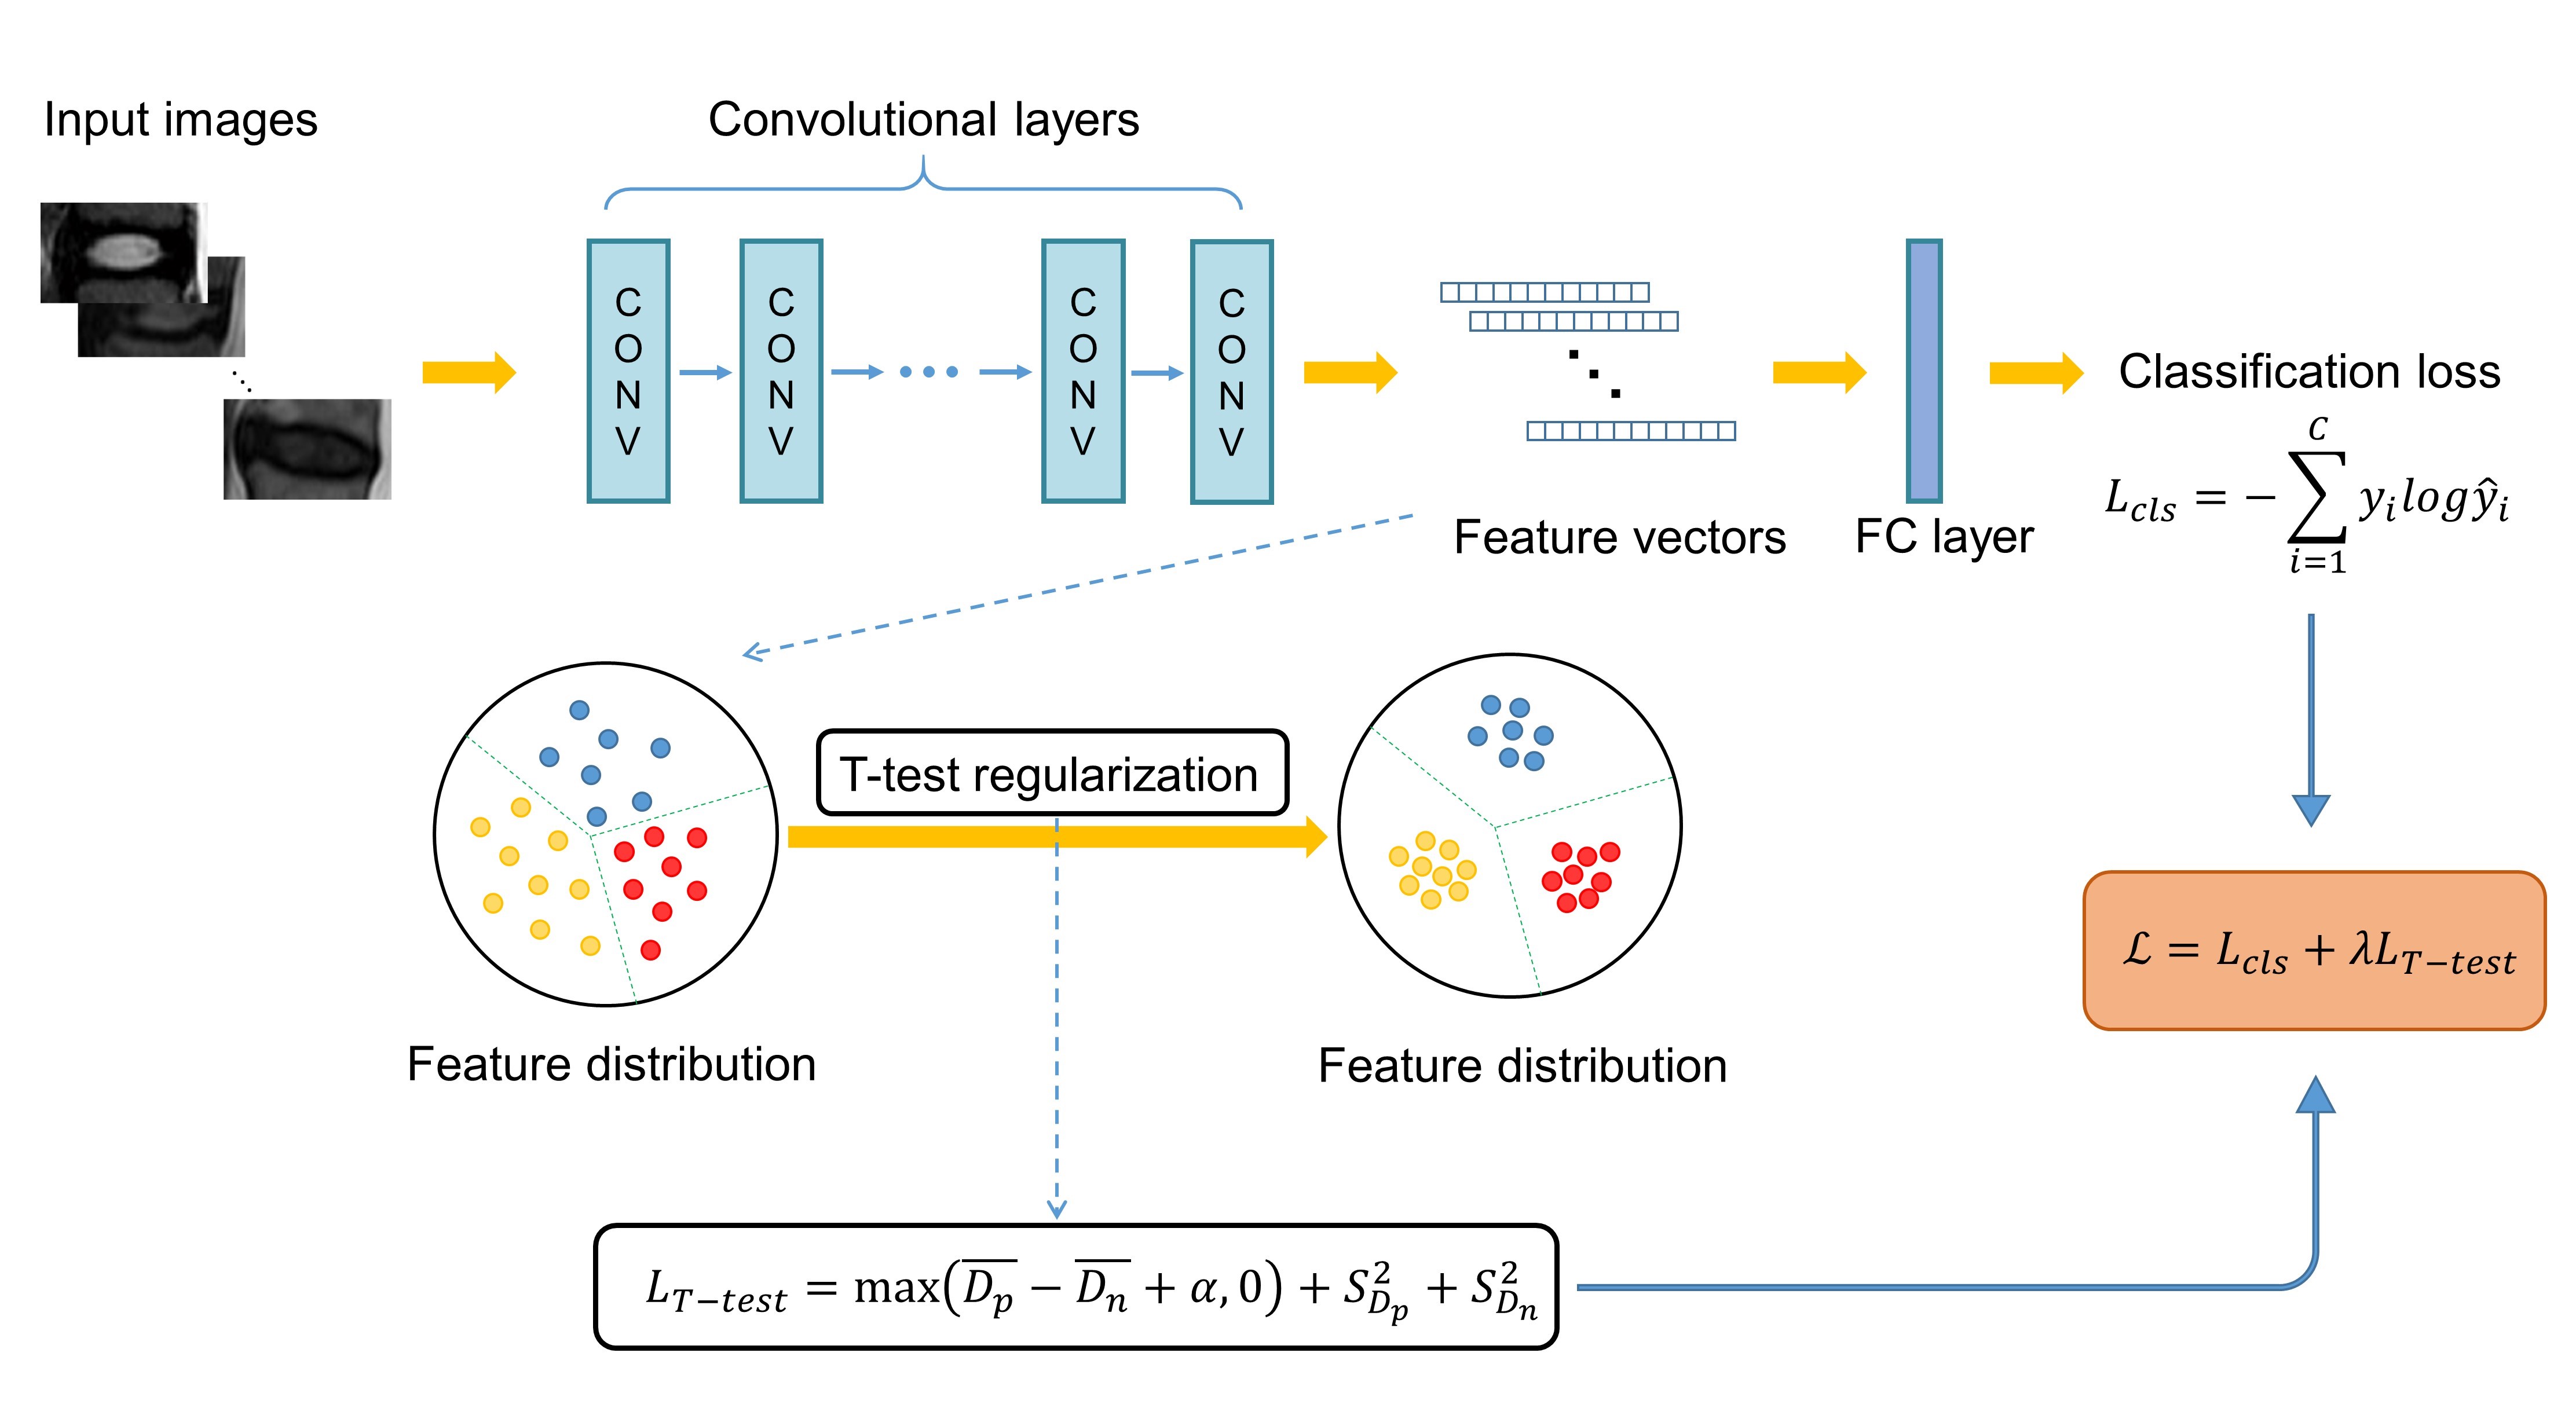
In this retrospective study, the data collected from routine clinics consists of T2-weighted MRI scans of 500 patients under varied lumbar diseases, such as degeneration, herniation and scoliosis. There are 2500 individual IVDs, including their corresponding radiological Pfirrmann gradings, sourced from different scanners.The commonly used pipeline of image classification using the convolutional neural network (CNN) is depicted in the upper part of Fig.1. First, a series of convolutional, pooling layers and fully-connected layers (FC) are stacked to produce the final prediction.
T-test Regularized Network for IVD grading
Given a pair of IVD image samples $$$x_{i}$$$ and $$$x_{j}$$$, we assume that the intra-class distances $$$\left\{D_p^i\right\}_{i=1,...,N_p}$$$ of samples and inter-class distances $$$\left\{D_n^j\right\}_{j=1,...,N_n}$$$ of samples obey different distributions, where $$$N_p$$$ denotes the number of intra-class sample pairs and $$$N_n$$$ denotes the number of inter-class sample pairs. And pairwise feature distance metric can be measured by computing the Euclidean distance between the CNN feature representations, which is defined as follows,
$$D\left(x_i,x_j\right)=\parallel f\left(x_i\right)-f\left(x_j\right)\parallel_2,$$
where $$$f\left(x_i\right)$$$ and $$$f\left(x_j\right)$$$ denote the CNN features of $$$x_i$$$ and $$$x_j$$$ after fully connected layers.
To enhance the discriminative capability of CNN representation for IVD degeneration, we expect that the distances between samples within the same class are smaller than those between samples of different classes. The T-test regularization term is defined as
$$L_{T-test}=\max\left(\overline{D_p}-\overline{D_n}+\alpha\right)+S_{D_p}^2+S_{D_n}^2,$$
where $$$\overline{D_p}$$$ and $$$\overline{D_n}$$$ are the mean values of $$$D_p$$$ and $$$D_n$$$; $$$\alpha$$$ is the predefined margin threshold between the same class samples and different class samples; $$$S_{D_p}$$$ and $$$S_{D_n}$$$ are the standard deviations of $$$D_p$$$ and $$$D_n$$$.
The T-test regularization term and the $$$t$$$ statistic[4] are in an analogous manner. Minimization of $$$L_{T-test}$$$ can be regarded as maximization of the $$$t$$$ statistic, which is utilized to discriminate whether the means of two sets of data are significantly different from each other. In our IVD grading task, the T-test regularization is developed to enforce the CNN model to learn discriminative features that exhibit a high degree of aggregation within the same class and dispersed distribution among different classes.
Involving the proposed T-test regularization, the full classification loss for IVD grading is formulated as
$$L=L_{cls}+\lambda L_{T-test},$$
where $$$L_{cls}$$$ is the classification loss of cross-entropy; $$$L_{T-test}$$$ is the T-test regularization term; $$$\lambda$$$ is the weighting to balance the classification loss and the regularization. The detailed whole pipeline is depicted in Fig.1.
Results
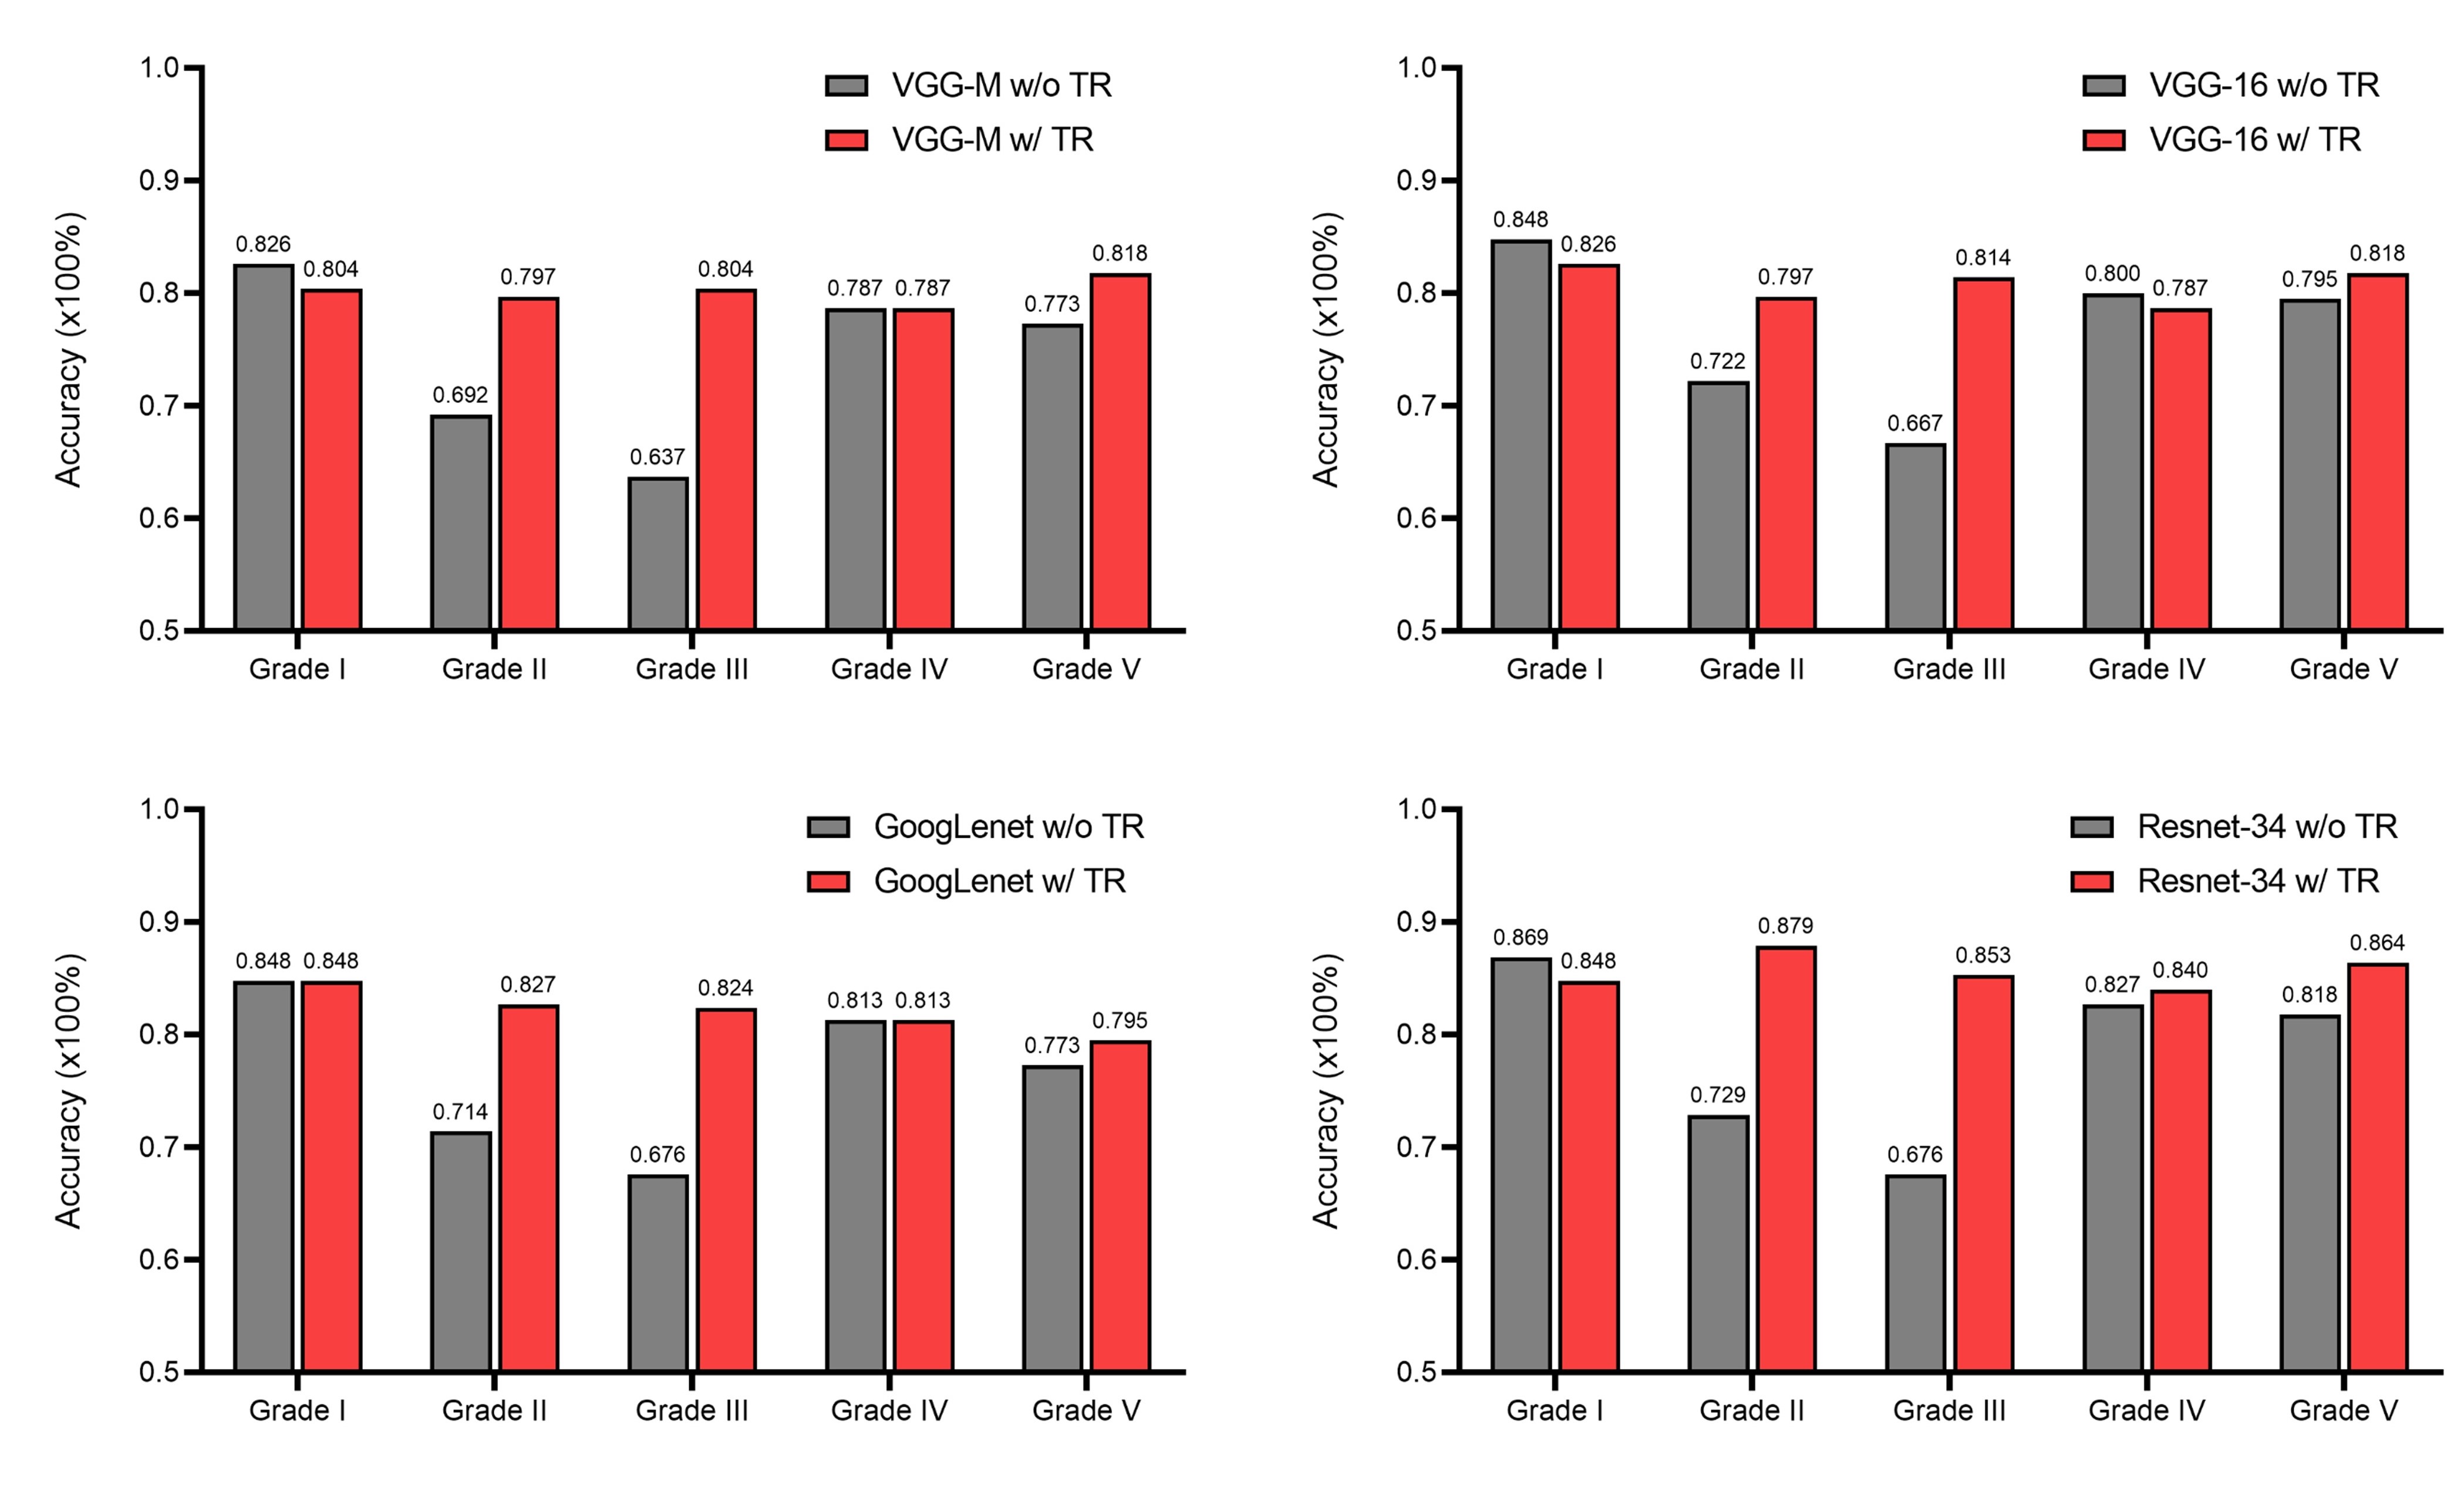
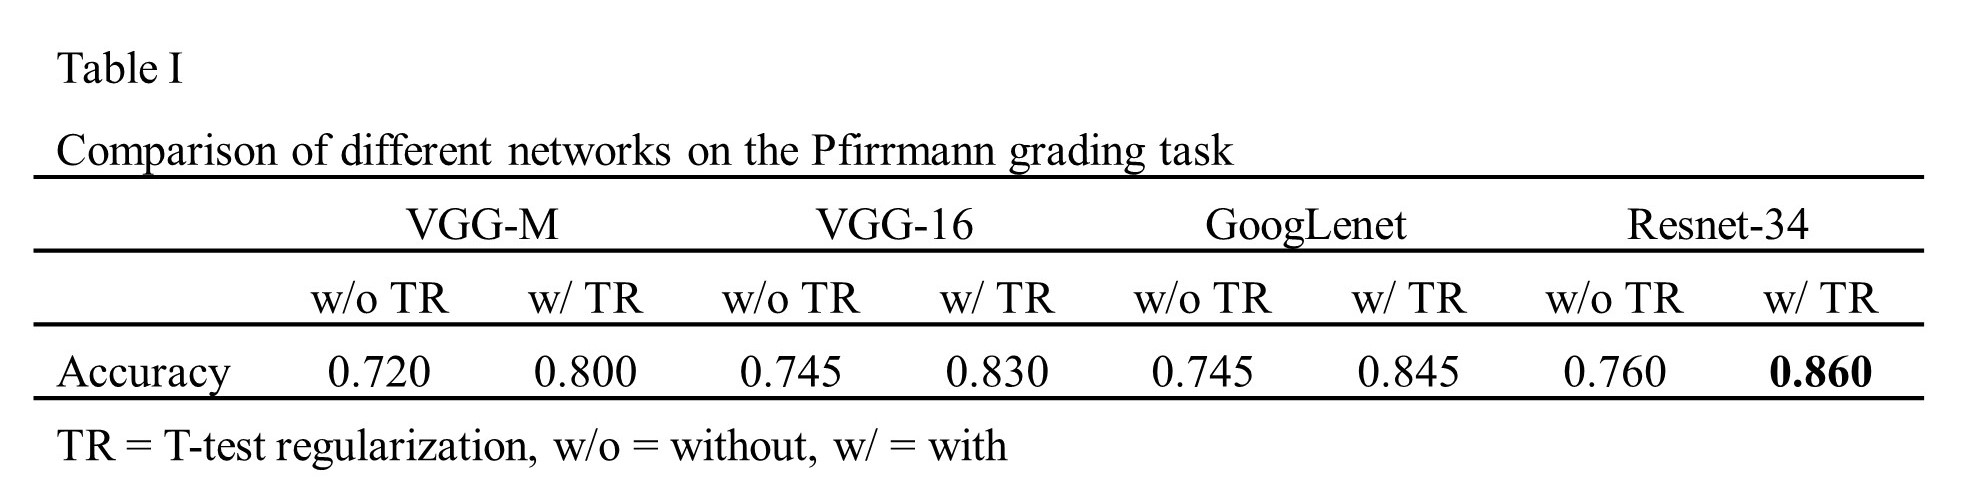
Table 1 shows the comparison of classification results of four widely used networks (VGG-M, VGG-16, GoogLenet, Resnet-34) with and without T-test regularization. The average accuracies of VGG-M, VGG-16, GoogLenet, Resnet-34 are 0.720, 0.745, 0.745, 0.760 and improved to 0.800, 0.830, 0.845, 0.860 respectively. Resnet-34 is shown to be the best model for this task in our experiments. The results show that the average classification accuracy can be improved by more than 8% using T-test regularization in all different network structures. Fig.2 shows the detailed classification results of each Pfirrmann grade with and without T-test regularization in different network structures. It is shown that grade II and III are improved most. For these grades, in different network structures, adding T-test regularization can improve the classification accuracy by more than 10%.Conclusion
In this paper, we propose a novel T-test regularization strategy to boost the CNN representation capability for IVD degeneration grading. The experiments demonstrate that our proposed T-test regularization exhibits superior performance compared with existing baseline methods. This T-test regularization strategy is effective for automatic IVD degeneration grading.Acknowledgements
No acknowledgement found.References
[1] M. Lootus, T. Kadir, and A. Zisserman, "Automated Radiological Grading of Spinal MRI," in Recent Advances in Computational Methods and Clinical Applications for Spine Imaging, J. Yao, B. Glocker, T. Klinder, and S. Li, Eds. Cham: Springer International Publishing, 2015, pp. 119-130.
[2] A. B. Oktay and Y. S. Akgul, "Diagnosis of Degenerative Intervertebral Disc Disease with Deep Networks and SVM," in Computer and Information Sciences: 31st International Symposium, ISCIS 2016, Kraków, Poland, October 27–28, 2016, Proceedings, T. Czachórski, E. Gelenbe, K. Grochla, and R. Lent, Eds. Cham: Springer International Publishing, 2016, pp. 253-261.
[3] A. Jamaludin, T. Kadir, and A. Zisserman, "SpineNet: Automated classification and evidence visualization in spinal MRIs," Medical Image Analysis, vol. 41, pp. 63-73, 2017/10/01/ 2017.
[4] B. Derrick, D. Toher, and P. White, "Why Welch’s test is Type I error robust," The Quantitative Methods in Psychology, vol. 12, no. 1, pp. 30-38, 2016.
Figures