0251
Computer Aided Detection AI Reduces Inter-Reader Variability in Grading Hip Abnormalities from MRI1Radiology and Biomedical Imaging, University of California San Francisco, San Francisco, CA, United States, 2La Trobe Sport and Exercise Medicine Research Centre, Melbourne, Australia
Synopsis
MRI based hip degeneration grading is difficult, time-intensive and prone to inter-reader variability, aggravated by the lack of a standard hip grading scale. Recent research using deep learning based clinical classification tasks has shown efficiency in knee degenerative changes. In this study, we aim to develop a deep learning based hip degenerative changes classification model (for cartilage lesions, bone marrow edemas and cysts) and evaluate its performance. In addition to that, we develop an AI-assist tool based on model predictions to test on two radiologists to see if the inter-reader agreement increases by using the AI-assist.
Introduction
Making accurate interpretation of hip MRI is time-intensive, difficult, and prone to inter-reader variability, aggravated by the fact that there is no standard grading system used to evaluate degenerative changes in hip MRI1-3. Deep learning has shown efficacy in being able to classify joint abnormalities in the knee4-6. However, translation of these techniques to the hip are challenging due to lower image quality and partial-voluming effect. In this study, we aim to fill this gap by (1) developing and evaluating a deep-learning based model for binary classification of hip OA degenerative changes on MR images (2) developing an AI-based assist tool to find if using the model predictions improves inter-reader agreement in hip grading.Methods
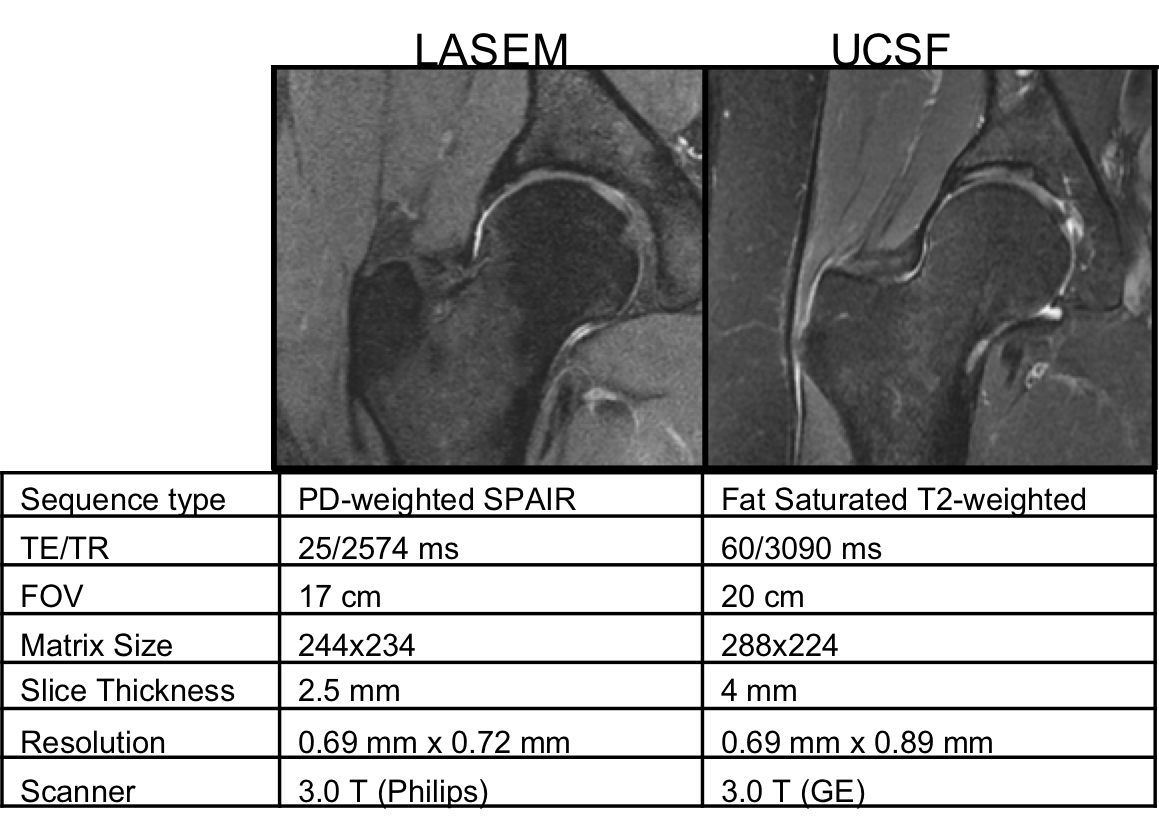
764 coronal hip volumes were acquired from two institutions, (LaTrobe Sport and Exercise Medicine Research Centre and UCSF). Examples of these images and their MR acquisition parameters can be seen in Figure 1. All the volumes were annotated by five board-certified radiologists, with 5+ years of experience, using the SHOMRI grading system7.The MRNet architecture was used for this study4. Three separate networks for binary detection of the cartilage lesions, bone marrow edemas and cysts, consisting of the same training, validation and test set, were trained. A grid search including different values for the learning rate (1E-06 to 4.02E-05) and probability of drop out (0.3 to 0.6), combined with presence of augmentation (rotation, affine transformation, intensity rescaling, histogram equalization) and weight decay was implemented to find the best combination of these parameters for training the networks. The label for each volume was the total cartilage lesion, bone marrow edema or cyst grade of the patient volume, binarized as 0 or 1, with threshold of 1. 65%-25%-10% splits, cross entropy loss and an Adam optimizer were used. The model was implemented in Pytorch, trained for 80 epochs (3 hours on Nvidia Titan X GPU)8.
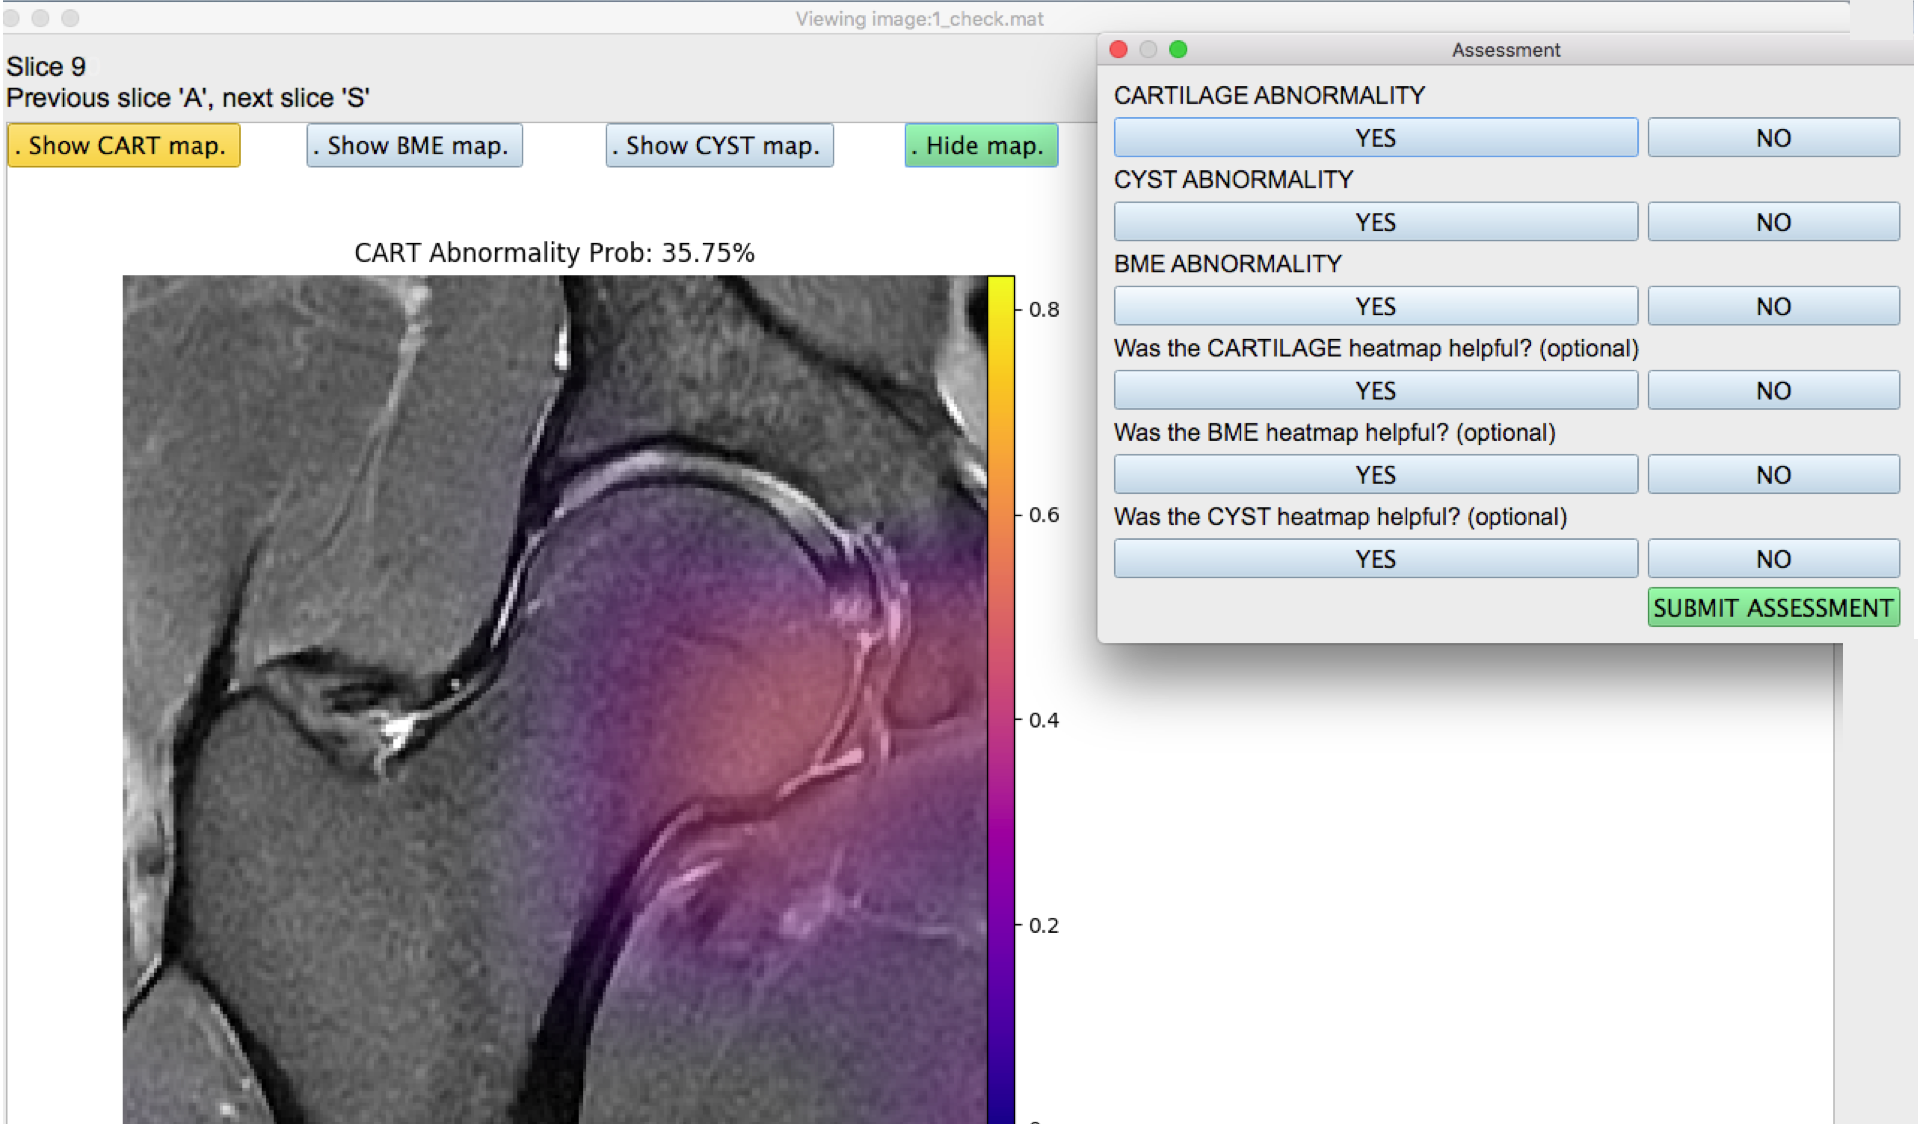
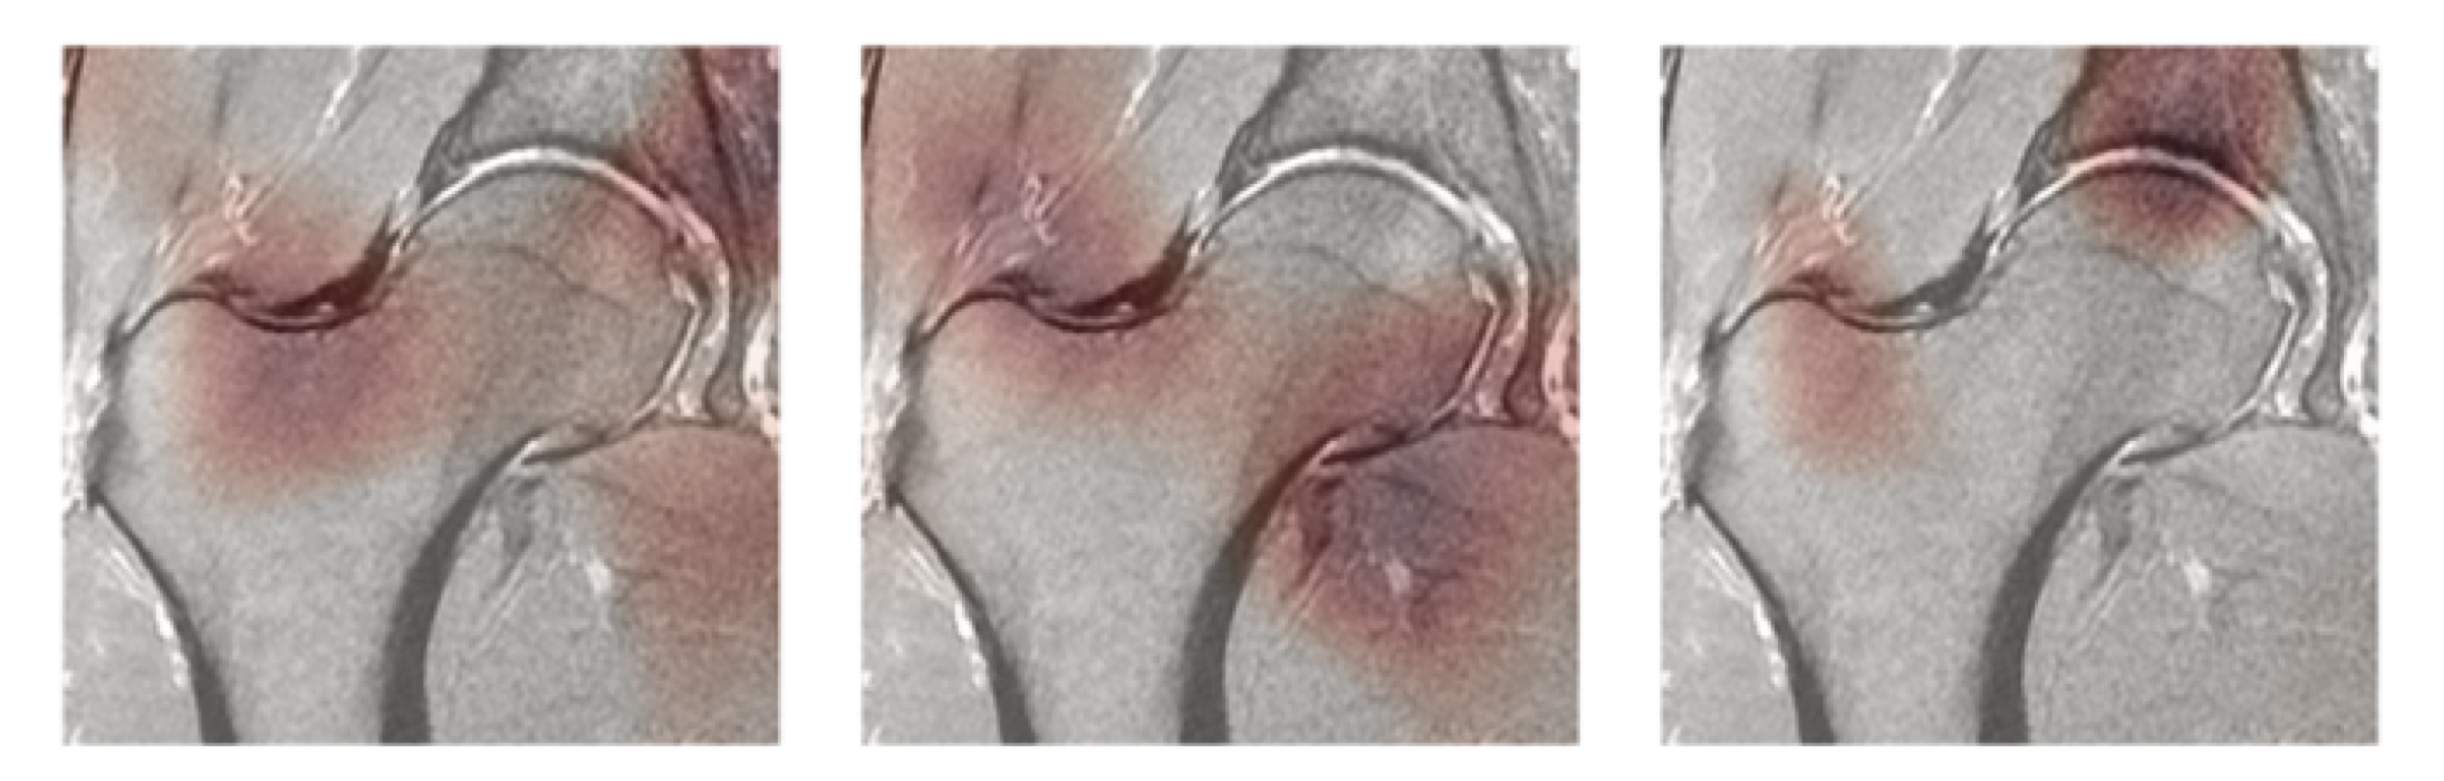
Class activation maps were generated for the training, validation and test model predictions as described by Bien et al4. The model probabilities for the test set corresponding to each volume were saved for all three pathologies, and this same test set was also graded on a binary scale by a radiologist to compare their performance using the model ROC curves. Furthermore, an application (Figure 2) was developed in Python version 3.1 with an interface that was able to visualize the hip volumes and scroll through slices, toggle on or off the saliency map for any one of the pathologies at a time, visualize the networks predicted lesion probability, input binary assessment from radiologist, ensuring that no metadata or patient health information was visible anywhere. The application was used by two radiologists at two different trial periods. For the first trial, they provided a binary assessment on the test set patients for presence of cartilage lesion, bone marrow edemas and cysts without the option for the saliency maps or the network prediction probability, which were made visible in the second trial that occurred after a month-long wash-out period. The responses of both the radiologists from both trials were recorded and used to calculate balanced accuracy.
Results
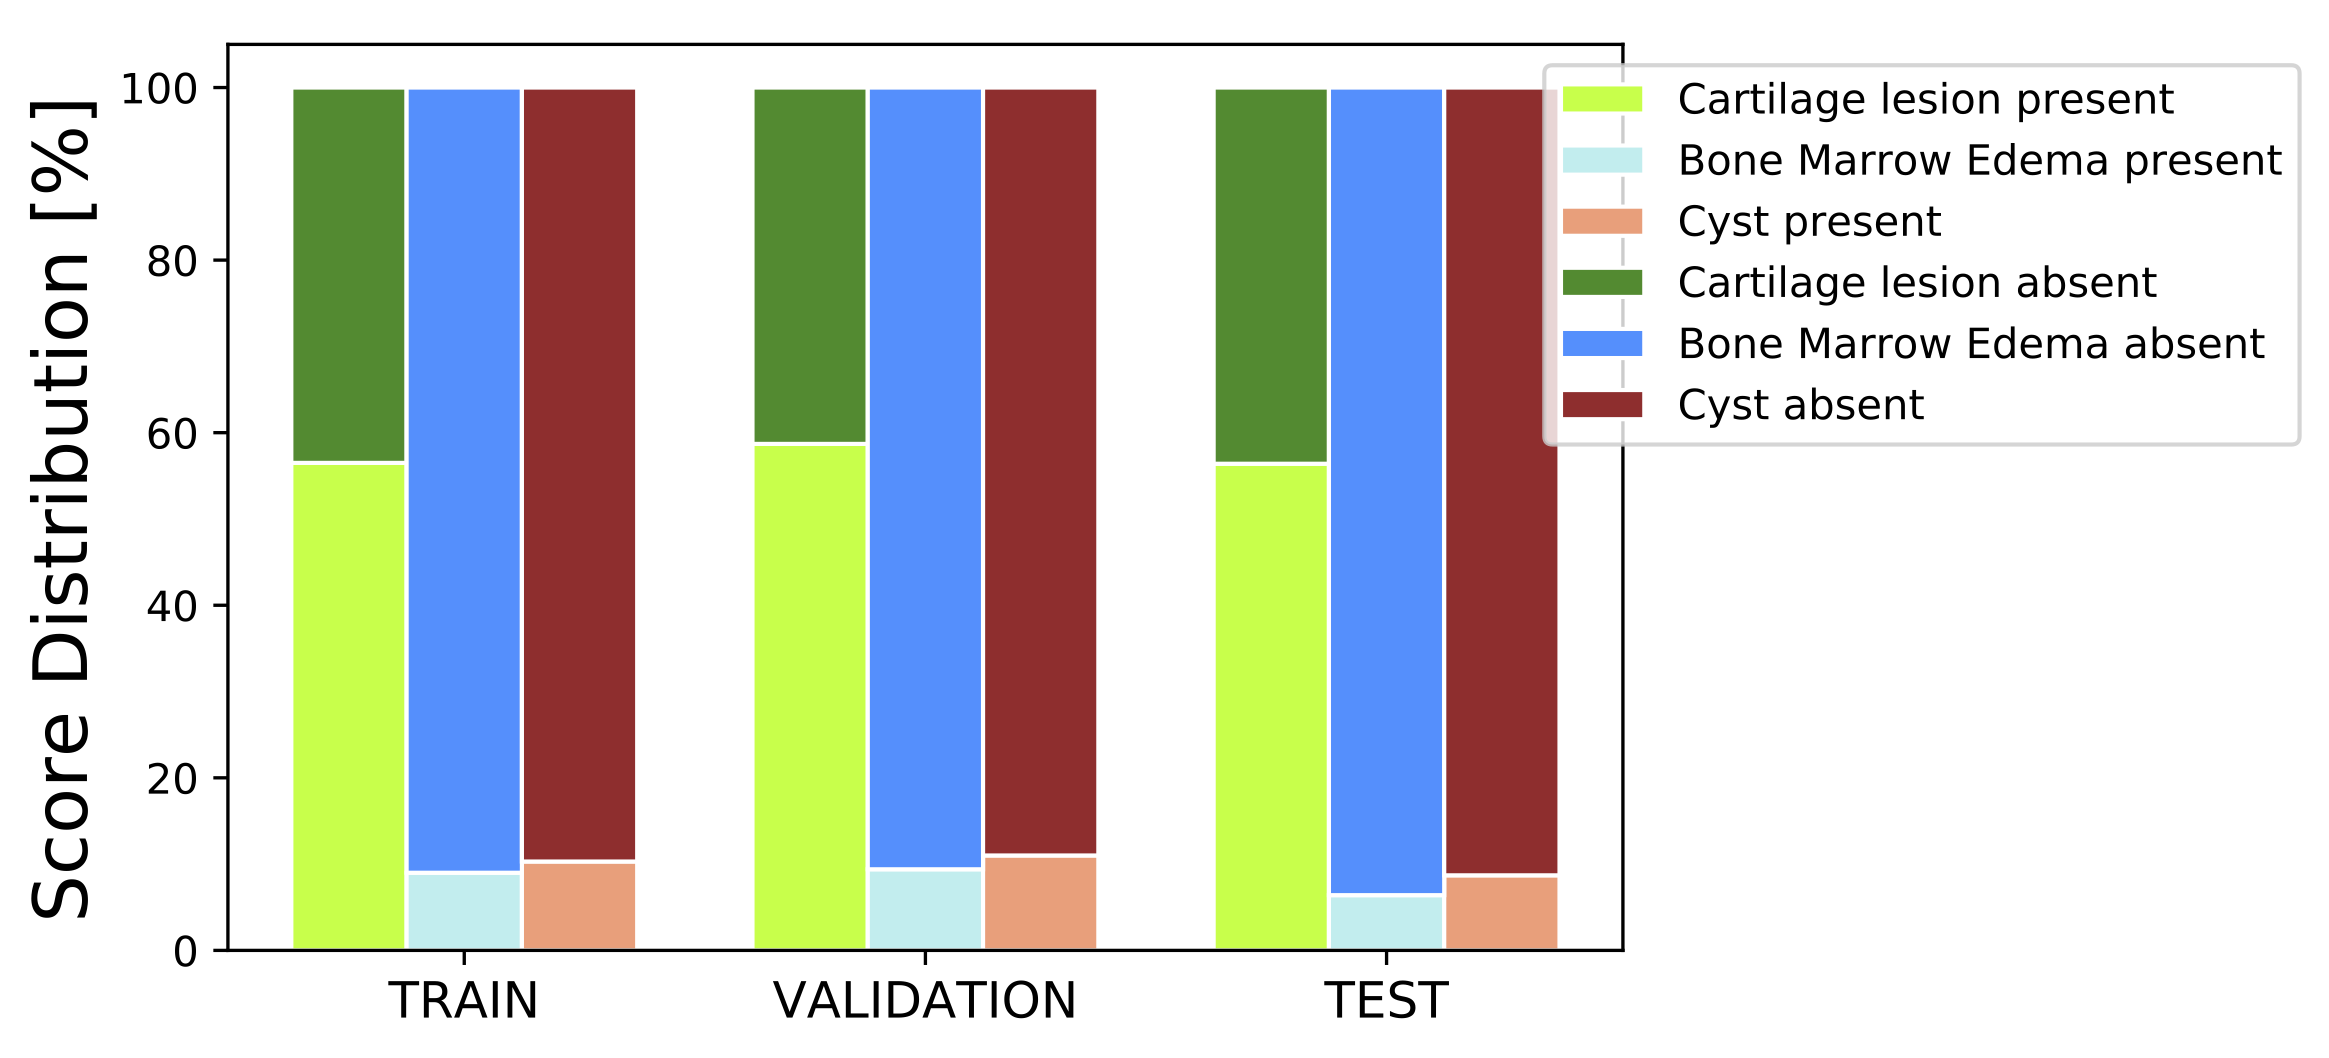
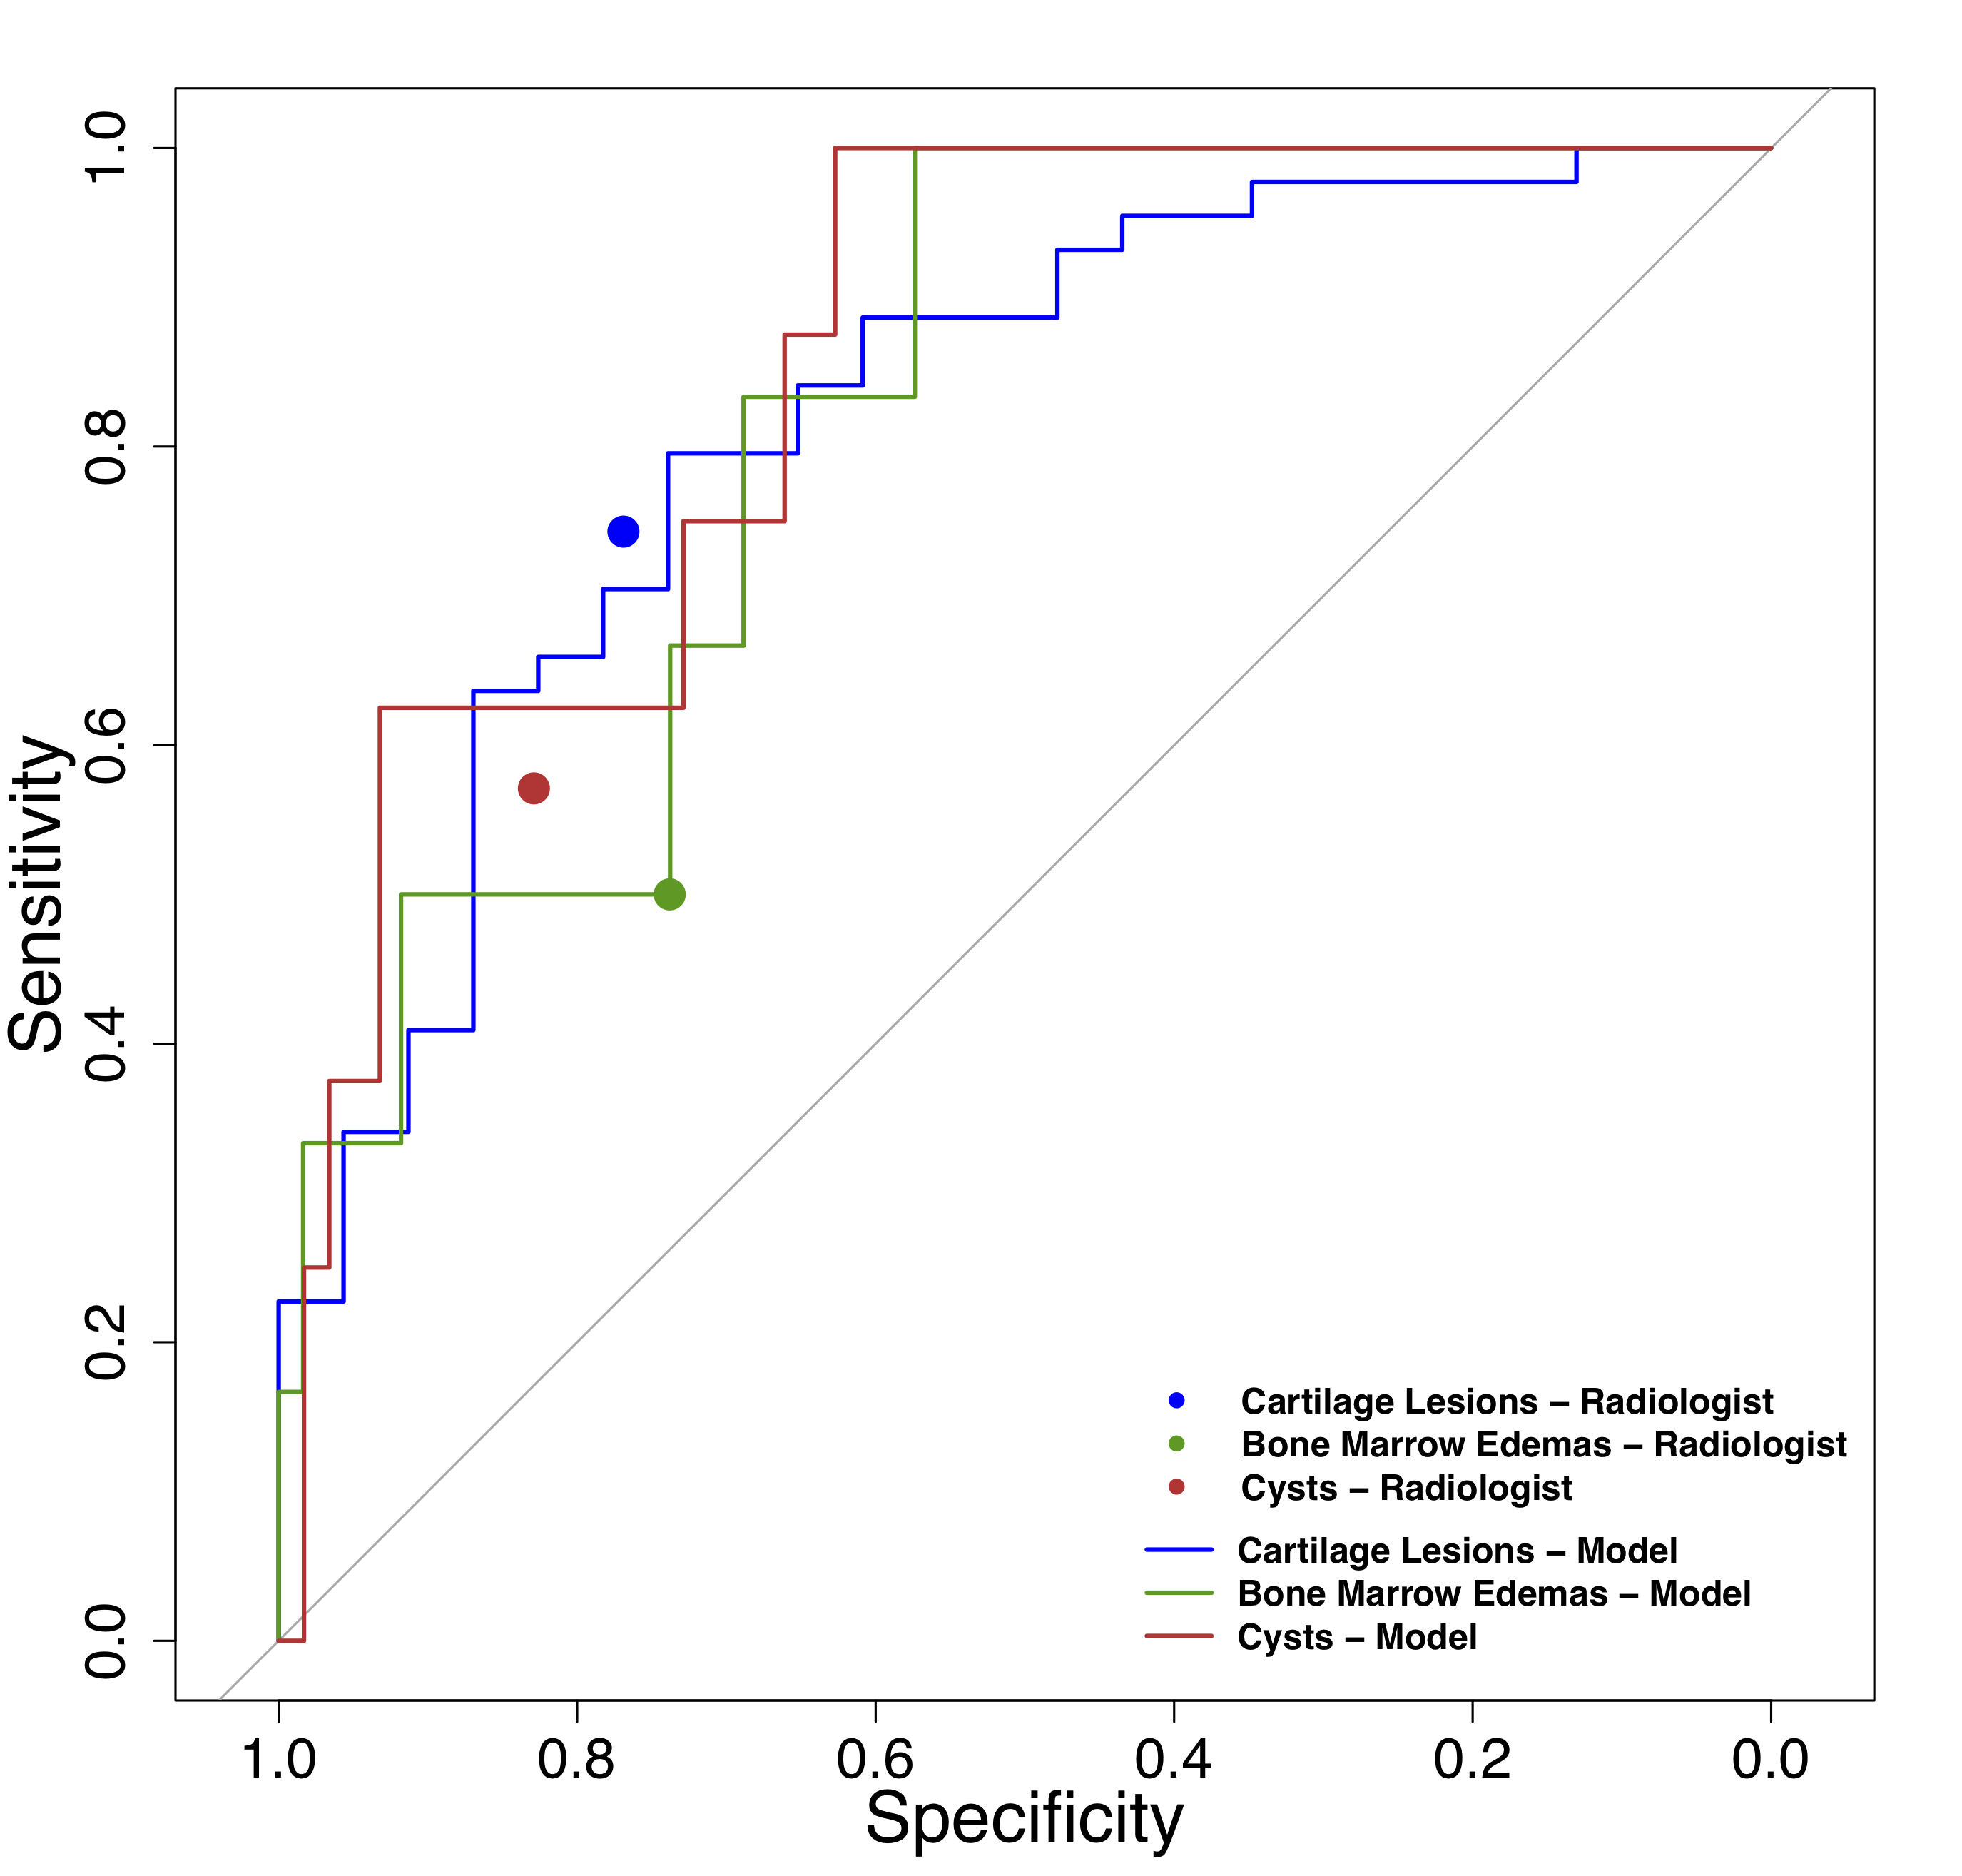
The UCSF cohort had a mean age of 43.11 (22-72), a mean BMI of 23.82 (16.48-32.25), and were 56% female. The LASEM cohort patients had a mean age of 26.0 (23-31), a mean BMI of 27.13 (26-29), and were 21.11% female. The distribution of the binary cartilage lesion, bone marrow edema and cyst scores in the training, validation and test sets are shown in Figure 3, showing a strong class imbalance in the cyst and bone marrow edema scores. Leveraging parallel processing, the grid search took approximately 11 days to run through all its combinations. Optimal learning rate and drop out were: 3.08E-05, 0.36 (cartilage, bone marrow edema), 2.12E-05, 0.30 (cyst). Augmentation and weight decay effects were observed to be negligible on the performance. Figure 4 shows the ROC curves for the models for binary classification as they performed against the ground truth data, with AUCs of: 0.82 (95% CI 0.71-0.93), 0.82 (95% CI 0.66-0.97), and 0.85 (95% CI 0.73-0.97) for cartilage lesions, bone marrow edemas and cysts. The sensitivity and specificity of the radiologist on the same test set for binary classification are as follows: 0.73 (95% CI 0.59-0.88) and 0.76 (95% CI 0.54-0.99) for cartilage lesions, 0.50 (95% CI 0.10-0.9) and 0.73 (95% CI 0.61-0.87) for bone marrow edemas, 0.57 (95% CI 0.21-0.94) and 0.83 (95% CI 0.71-0.94) for cysts. Examples of class activation maps on the selected models (on test set) can be seen in Figure 5. The inter-reader balanced accuracy for binary classification on cartilage, bone marrow edema and cyst were 53%, 71% and 56% in the first trial, and 60%, 73% and 60% in the second trial.Discussion and Conclusion
Our results demonstrate that a deep learning approach achieved high performance in clinical classification of cartilage lesions, edemas and cysts on hip MR images, comparable to a radiologist. By using predictions from the model, the inter-reader agreement increased in all pathologies. Further experiments are needed to improve the network generalizability, image quality on the assist application, and find clinical efficacy of assisting radiologists in detection tasks.Acknowledgements
NIH/NIAMS R01AR069006, NIH/NIAMS P50AR060752, FORCe CohortReferences
1. Schmid MR, Notzli HP, Zanetti M, Wyss TF, Hodler J. Cartilage lesions in the hip: diagnostic effectiveness of MR arthrography. Radiology. 2003;226(2):382-386.
2. Keeney JA, Peelle MW, Jackson J, Rubin D, Maloney WJ, Clohisy JC. Magnetic resonance arthrography versus arthroscopy in the evaluation of articular hip pathology. Clin Orthop Relat Res. 2004(429):163-169.
3. Zazgyva A, Gurzu S, Gergely I, Jung I, Roman CO, Pop TS. Clinico-radiological diagnosis and grading of rapidly progressive osteoarthritis of the hip. Medicine (Baltimore). 2017;96(12):e6395.
4. Bien N, Rajpurkar P, Ball RL, et al. Deep-learning-assisted diagnosis for knee magnetic resonance imaging: Development and retrospective validation of MRNet. PLoS Med. 2018;15(11):e1002699.
5. Liu F, Zhou Z, Samsonov A, et al. Deep Learning Approach for Evaluating Knee MR Images: Achieving High Diagnostic Performance for Cartilage Lesion Detection. Radiology. 2018;289(1):160-169. 6. Pedoia V, Norman B, Mehany SN, Bucknor MD, Link TM, Majumdar S. 3D convolutional neural networks for detection and severity staging of meniscus and PFJ cartilage morphological degenerative changes in osteoarthritis and anterior cruciate ligament subjects. J Magn Reson Imaging. 2019;49(2):400-410.
7. Lee S, Nardo L, Kumar D, et al. Scoring hip osteoarthritis with MRI (SHOMRI): A whole joint osteoarthritis evaluation system. J Magn Reson Imaging. 2015;41(6):1549-1557.
8. Paszke A, Gross S, Chintala S, et al. Automatic differentiation in pytorch. 2017.
Figures