0241
Deep Learning Predicts Total Knee Replacement from Magnetic Resonance Images
Aniket A. Tolpadi1,2, Jinhee J. Lee1, Valentina Pedoia1, and Sharmila Majumdar1
1Department of Radiology and Biomedical Imaging, UCSF, San Francisco, CA, United States, 2Department of Bioengineering, University of California, Berkeley, Berkeley, CA, United States
1Department of Radiology and Biomedical Imaging, UCSF, San Francisco, CA, United States, 2Department of Bioengineering, University of California, Berkeley, Berkeley, CA, United States
Synopsis
Total Knee Replacement (TKR) can relieve pain from osteoarthritis (OA), but patient dissatisfaction is not uncommon, making TKR delay advisable until absolutely necessary. Models could identify at-risk patients requiring nonsurgical treatment, prolonging good health and delaying TKR. We present a pipeline that uses DenseNet-121 to predict TKR onset from MRI images, integrates clinical information by ensembling logistic regression models, and sensitively and specifically predicts TKR, particularly at early-stage OA. Occlusion maps show many OA progression imaging biomarkers are implicated in TKR, and many tissues involved in knee flexion and extension preferentially affect TKR probability at early-stage and late-stage OA, respectively.
Introduction
Knee Osteoarthritis (OA) is a common musculoskeletal disorder in the United States that causes disability1,2. Its progression is typically assessed with the Kellgren-Lawrence (KL) scale, a 0-4 scale in which higher scores indicate more advanced OA3. When diagnosed early (KL=0,1), lifestyle alterations such as exercise and weight loss can slow OA progression. At late stages (KL=4), no noninvasive option exists, making total knee replacement (TKR) the only option4,5. The procedure is effective but imperfect: only 66% of patients report knees feeling “normal,” and 33% report pain post-implant6. Potential complications can also necessitate revisions, making delaying TKR preferable whenever possible7,8. Thus, a sensitive and specific model predicting if patients will undergo TKR could identify patients in whom to initiative nonsurgical alternative treatments, which would have clinical utility, particularly for early-stage OA patients. Furthermore, if such a model utilizes medical images to make predictions, it could identify imaging biomarkers for TKR.Methods
Data was acquired from a prospective observational study conducted by the Osteoarthritis Initiative (OAI)9. Posteroanterior radiographs were cropped to a 500×500 region centered around the knee joint by a U-Net architecture, as done in (Norman, 2019)10. DESS MRIs were center-cropped to a 120×320×320 region. Both images were then normalized and MRI pixels were rounded to nearest integers. Cases were defined as patients who underwent a first TKR within 5 years (n=1,043); controls were patients who did not undergo a TKR or who did so but the time to it exceeded 5 years (n=34,441).A DenseNet-121 classifier was pretrained to predict OA from images and fine-tuned to predict TKR. Image-based predictions were fed to an ensemble of logistic regression models based on OA severity, yielding final predictions (Fig. 1). The ensembles were optimized for Youden’s index11, integrating image-based predictions with 20 non-imaging variables encompassing pain metrics, physical performance tests, and demographics12-14. Performance of 2 ensemble versions are reported: one where non-imaging variables were used to predict TKR (non-imaging info. only), and one where image-based predictions were added (integrated model). Sole DenseNet-121 output is also reported (image only). Confidence intervals of accuracy, sensitivity, specificity, and AUCs were calculated by bootstrapping. Relative performance of XRay and MRI pipelines were assessed within each OA classification by calculating differences in AUCs on bootstrapped samples (B=100) and running t-tests. Occlusion maps were developed for true positives, and regions with pixels among the top 5% of TKR probability change designated as hotspots.
Results
AUCs show that for integrated models, the MRI pipeline obtains significantly better performance than its radiograph counterpart in patients without OA and overall, p < 0.05 (Fig. 2a, 2b). The same holds for image-only models, p < 0.05 (Fig. 2c, 2d). ROC curves for three versions of the MRI pipeline are displayed in Fig. 3.An example occlusion map is shown in Fig. 4, while Table 1 summarizes hotspot probabilities in select tissues. Of tissues that were hotspots in over 75% of true positives, the synovium, tibiofemoral joint (TFJ) cartilage and bone (medial and lateral), anterior and posterior meniscus (medial and lateral), Hoffa fat pad, and anterior cruciate ligament (ACL) are implicated in OA progression15. The posterior cruciate ligament (PCL) and medial patellar retinaculum (MPR) also had hotspot percentages above 75%; relevance of PCL abnormalities to OA progression is unclear16,17, and that of the MPR has not been thoroughly investigated. These tissues aside, others were preferentially hotspots at no OA: the popliteal ligament and muscle, semimembranosus tendon, gastrocnemius muscle and tendon, and lateral patellar retinaculum. Many of these tissues are implicated in knee flexion or rotation. The following preferentially affected TKR prediction at late-stage OA: patellofemoral joint bone and cartilage, quadriceps tendon, patellar tendon, and suprapatellar fat pad. Many of these tissues are implicated in knee extension.
Discussion and Conclusions
We present a sensitive and specific pipeline that predicts TKR, indicating progress towards a clinically useful model. The MRI pipeline outperforms the XRay pipeline, and MRI pipeline performance in particular at no OA—the most difficult stage to model but most useful if modeled properly—is strong and exceeds that of past work18. This all suggests MRI may have utility in TKR screening despite high costs. Furthermore, this study performs a holistic analysis for potential TKR imaging biomarkers. Its results are insightful, confirming intuition that many OA progression biomarkers are implicated in TKR, and showing tissues involved in knee flexion and rotation preferentially affect TKR prediction at early-stage OA while those involved in knee extension do so at late-stage OA. Past work has been inconclusive in determining whether weakness or abnormalities in knee flexors or extensors can induce OA19,20, but our findings suggest imaging features of these tissues may explain OA onset and TKR where their strength may not. These findings justify future occlusion map studies with finer voxel size, shorter stride, and case-control pairs to confirm tissues as imaging biomarkers and investigate which features within knee extensors, flexors, and other possible imaging biomarkers lead to TKR. Additional directions include investigation of architectures other than DenseNet, alternate means of integrating imaging predictions with non-imaging variables, and utilizing images from multiple MRI sequences to improve performance.Acknowledgements
The OAI is a public-private partnership comprised of five contracts (N01-AR-2-2258; N01-AR-2-2259; N01-AR-2-2260; N01-AR-2-2261; N01-AR-2-2262) funded by the National Institutes of Health, a branch of the Department of Health and Human Services, and conducted by the OAI Study Investigators. Private funding partners include Merck Research Laboratories; Novartis Pharmaceuticals Corporation, GlaxoSmithKline; and Pfizer, Inc. Private sector funding for the OAI is managed by the Foundation for the National Institutes of Health. This paper was prepared using an OAI public use data set and does not necessarily reflect the opinions or views of the OAI investigators, the NIH, or the private funding partners. This study was supported by the grants R61AR073552 (S.M./V.P.) and R00AR070902 (V.P.). Institutional research funds are provided by GE Healthcare for unrelated studies.References
- Kremers, H. M. et al. Prevalence of total hip and knee replacement in the United States. J. Bone Joint Surg. Am. 2015;97(17):1386-1397.
- Murphy, L. B., Cisternas, M. G., Pasta, D. J., Helmick, C. G. & Yelin E. H. Medical expenditures and earnings losses among US adults with arthritis in 2013. Arthritis Care Res. (Hoboken). 2018;70(6):869-876.
- Kellgren, J. H. & Lawrence, J. S. Radiological assessment of osteo-arthrosis. Ann. Rheum. Dis. 1957;16(4):494-502.
- Ringdahl, E. & Pandit, S. Treatment of knee osteoarthritis. Am. Fam. Physician. 2011;83(11):1287-1292.
- Tiulpin, A., Thevenot, J., Rahtu, E., Lehenkari, P. & Saarakkala, S. Automatic knee osteoarthritis diagnosis from plain radiographs: a deep learning-based approach. Sci. Rep. 2018;8(1):1727. doi: 10.1038/s41598-018-20132-7.
- Parvizi, J. et al. High level of residual symptoms in young patients after total knee arthroplasty. Clin. Orthop. Relat. Res. 2014;472(1):133-137.
- Chang, M. J., Lim, H., Lee, N. R. & Moon, Y. Diagnosis, causes and treatments of instability following total knee arthroplasty. Knee Surg. Relat. Res. 2014;26(2):61-67.
- Kim, K. T. et al. Causes of failure after total knee arthroplasty in osteoarthritis patients 55 years of age or younger. Knee Surg. Relat. Res. 2014;26(1):13-19.
- Peterfy, C. G., Schneider, E. & Nevitt, M. The osteoarthritis initiative: report on the design rationale for the magnetic resonance imaging protocol for the knee. Osteoarthritis Cartilage. 2008;16(12):1433-1441.
- Norman, B., Pedoia, V., Noworolski, A., Link, T. M. & Majumdar, S. Applying densely connected convolutional neural networks for staging osteoarthritis severity from plain radiographs. J. Digit. Imaging. 2019;32(3):471-477.
- Youden, W. J. Index rating for diagnostic tests. Cancer. 1950;3(1):32-35.
- Riddle, D. L, Kong, X. & Jiranek, W. A. Two-year incidence and predictors of future knee arthroplasty in persons with symptomatic knee osteoarthritis: preliminary analysis of longitudinal data from the osteoarthritis initiative. Knee. 2009;16(6):494-500.
- Hawker, G. A. et al. A prospective population-based study of the predictors of undergoing total joint arthroplasty. Arthritis Rheum. 2006;54(10):3212-3220.
- Lewis, J. R., Dhaliwal, S. S., Zhu, K. & Prince, R. L. A predictive model for knee joint replacement in older women. PLoS One. 2013;8(12):e83665. doi: 10.1371/journal.pone.0083665.
- Collins, J. E. et al. Semi-quantitative imaging biomarkers of knee osteoarthritis progression: data from the FNIH OA biomarkers consortium. Arthritis Rheumatol. 2016;68(10):2422-2431.
- Wang, S. et al. Long-term results of posterior cruciate ligament tear with or without reconstruction: a nationwide, population-based cohort study. PLoS One. 2018;13(10):e0205118. doi: 10.1371/journal.pone.0205118.
- Hill, C. L. et al. Cruciate ligament integrity in osteoarthritis of the knee. Arthritis Rheum. 2005;52(3):794-799.
- Wang, T., Leung, K., Cho, K., Chang, G. & Deniz, C. M. Total knee replacement prediction using structural MRIs and 3D convolutional neural networks. In International Conference on Medical Imaging with Deep Learning – Extended Abstract Track. 2019:79.
- Slemenda, C. et al. Reduced quadriceps strength relative to body weight: a risk factor for knee osteoarthritis in women? Arthritis Rheum. 1998;41(11):1951-1959.
- Segal, N. A. et al. The effect of thigh strength on incident radiographic and symptomatic knee osteoarthritis in the multicenter osteoarthritis (MOST) study. Arthritis Rheum. 2009;61(9):1210-1217.
Figures

Figure
1: Pipeline predicting if patient will undergo TKR within 5
years from MRI/XRay images and non-imaging variables. MRI and XRay images are
center-cropped and cropped to a region centered around the joint, respectively,
and normalized. DenseNet-121 is pretrained to predict OA and fine-tuned to
predict TKR. Image-based predictions and clinical information are fed to a logistic
regression (LR) ensemble based on OA severity. Each ensemble averages predictions
of LR models that maximized Youden’s index in its OA severity in random
hyperparameter search for final TKR prediction.

Figure
2: MRI and XRay pipeline TKR
prediction performance. “Integrated model” is pipeline integrating non-imaging
variables and DenseNet-121 output; “image-only” is sole DenseNet-121 output. Image-only
and integrated pipelines had significantly higher AUCs in MRI than in XRay for
patients without OA and all patients, p < 0.05. At no OA, image-only AUCs increased
drastically more in XRay than in MRI with non-imaging variable addition, suggesting
MRI images contain information pertinent to non-imaging variables that was
learned by the DenseNet-121 classifier.

Figure
3: ROC curves for MRI pipeline,
evaluated across all OA severities. “Integrated model” and “image only” have
the same definitions as Fig. 2; “non-imaging info. only” refers to
predictions from the logistic regression (LR) ensembles trained to predict TKR
without image-based predictions, using identical hyperparameters. AUCs are shown
on plot, p < 0.05. LR ensembles were optimized for Youden’s index rather
than AUC to improve early OA performance, explaining the decrease in image-only
AUC with non-imaging variable addition.

Figure 4: Slices
of occlusion map of example true positive detected by MRI pipeline, smoothed by
a Gaussian filter. Occlusion maps were generated with voxel size 12×32×32 and stride 12, and map
slices are overlaid on corresponding slices of DESS MRI
images from which they were produced. Maps were created for all 120 sagittal
slices of 106 true positives detected by the pipeline, and the anatomic regions
of these hotspots were identified for each.
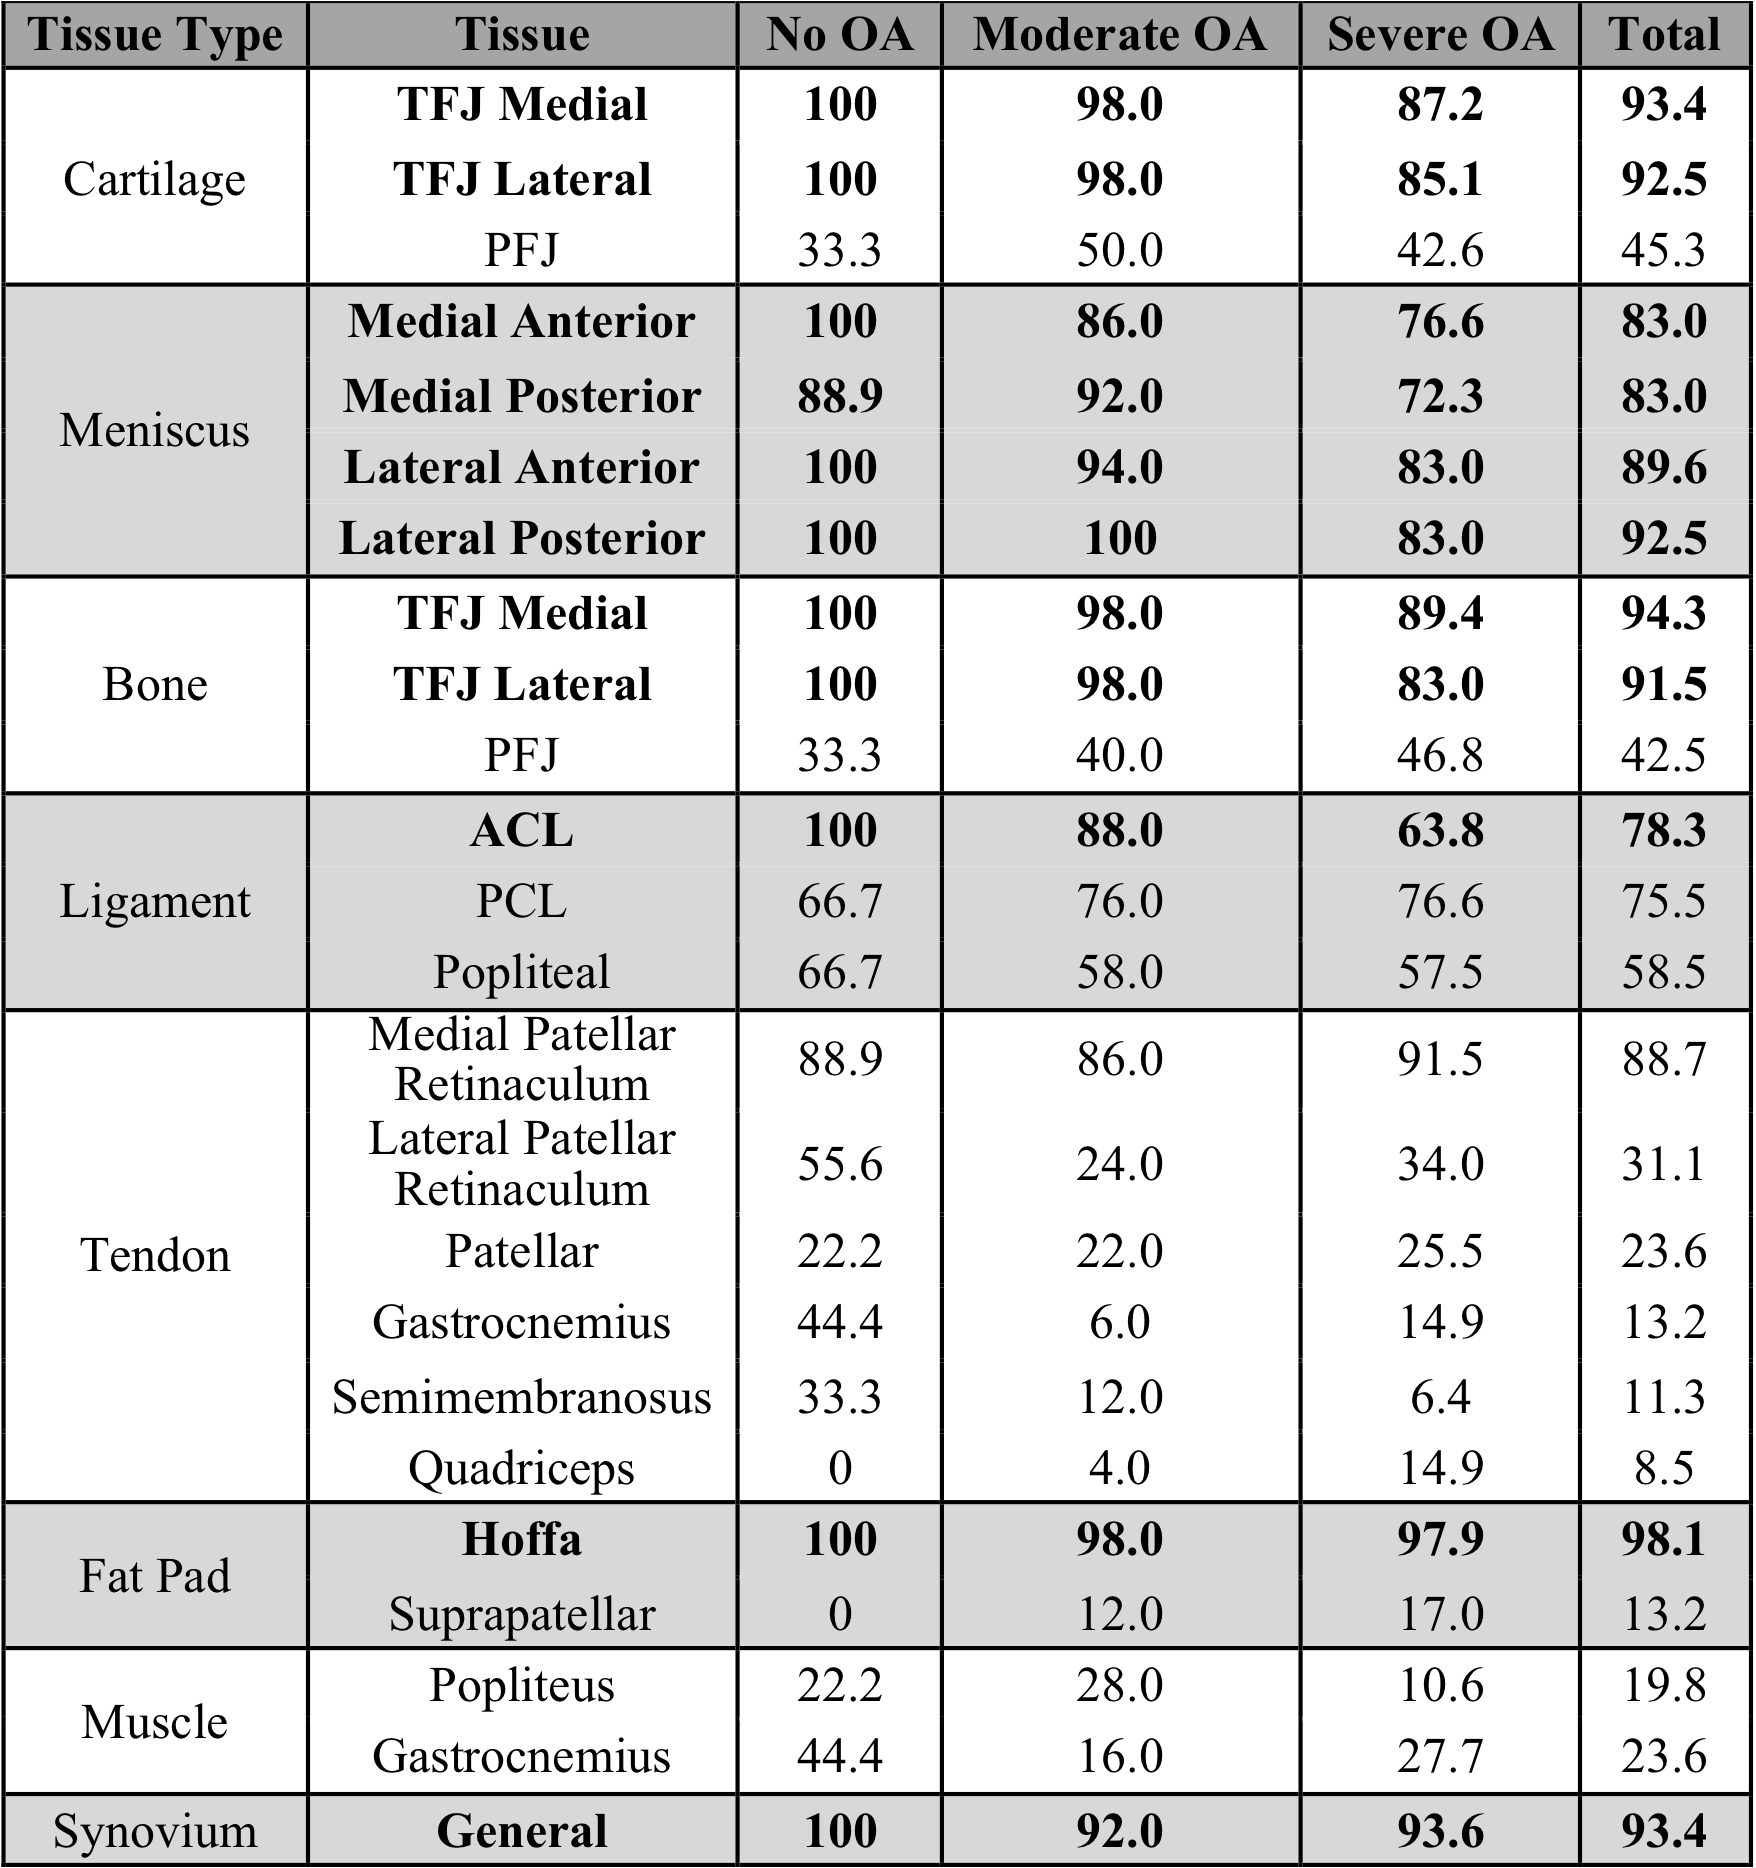
Table
1: Hotspot probabilities among 106
model true positives for select tissues. Tissues established as imaging
biomarkers of OA progression or in which damage is associated with OA
progression are shown in bold. With the exception of the PCL and medial
patellar retinaculum, this classification applies to all tissues that were
hotspots in at least 75% of true positives. These tissues aside, tissues
involved in knee extension preferentially affected TKR onset probability at
more advanced OA, while those involved in knee flexion and rotation did so at
less advanced OA.