0240
White matter tracts organization in patients with polymicrogyria and lissencephaly1Neuroimaging Lab, Scientific Institute, IRCCS E. Medea, Bosisio Parini, Italy, 2Murdoch Children’s Research Institute, Parkville, Australia, 3Royal Children’s Hospital, Parkville, Australia, 4The University of Melbourne, Parkville, Australia, 5The Florey Institute of Neuroscience and Mental Health, Parkville, Australia, 6Scientific Institute, IRCCS E. Medea, Bosisio Parini, Italy
Synopsis
White matter (WM) tracts organization in 42 polymicrogyria (PMG) and 8 lissencephaly (LIS) patients were characterized using the tissue-specific Constrained Spherical Deconvolution modelling technique. Structural appearance of 9 major WM tracts were judged using fiber orientation distribution based direction-encoded color maps and probabilistic algorithm based tractography reconstructions. More abnormal-appearing WM tracts were identified in LIS compared to PMG. Degrees of superior longitudinal fasciculus and cingulum abnormalities were associated with PMG distribution and severity. Thickened superior fronto-occipital fasciculus was demonstrated in three patients. Patterns of WM tracts involvement were related to PMG and LIS distribution and subgroups.
Introduction
Malformations of cortical development1,2 (MCD) are characterized by abnormal folding, thickness and gyrification of cerebral cortex, resulting from defects of cortical formation. Polymicrogyria (PMG) is a class of MCD, characterized by cortical over-folding. Pachygyria and lissencephaly (LIS) are characterized by cortical under-folding. Anomalies in the shape of cortical ribbon may be associated with abnormal organizations of underlying white matter (WM) tracts. WM tracts abnormalities have been identified in other classes of MCD through Diffusion MRI based WM modelling and tractogrpahy reconstructions, improved our understanding of the neuroanatomy and pathogenesis of these conditions3,4,5. This study aims to assess, patterns of WM tract organization and structural abnormalities in a cohort of children and adolescents with PMG and LIS, using diffusion MRI based white matter modelling and tractography techniques.Methods
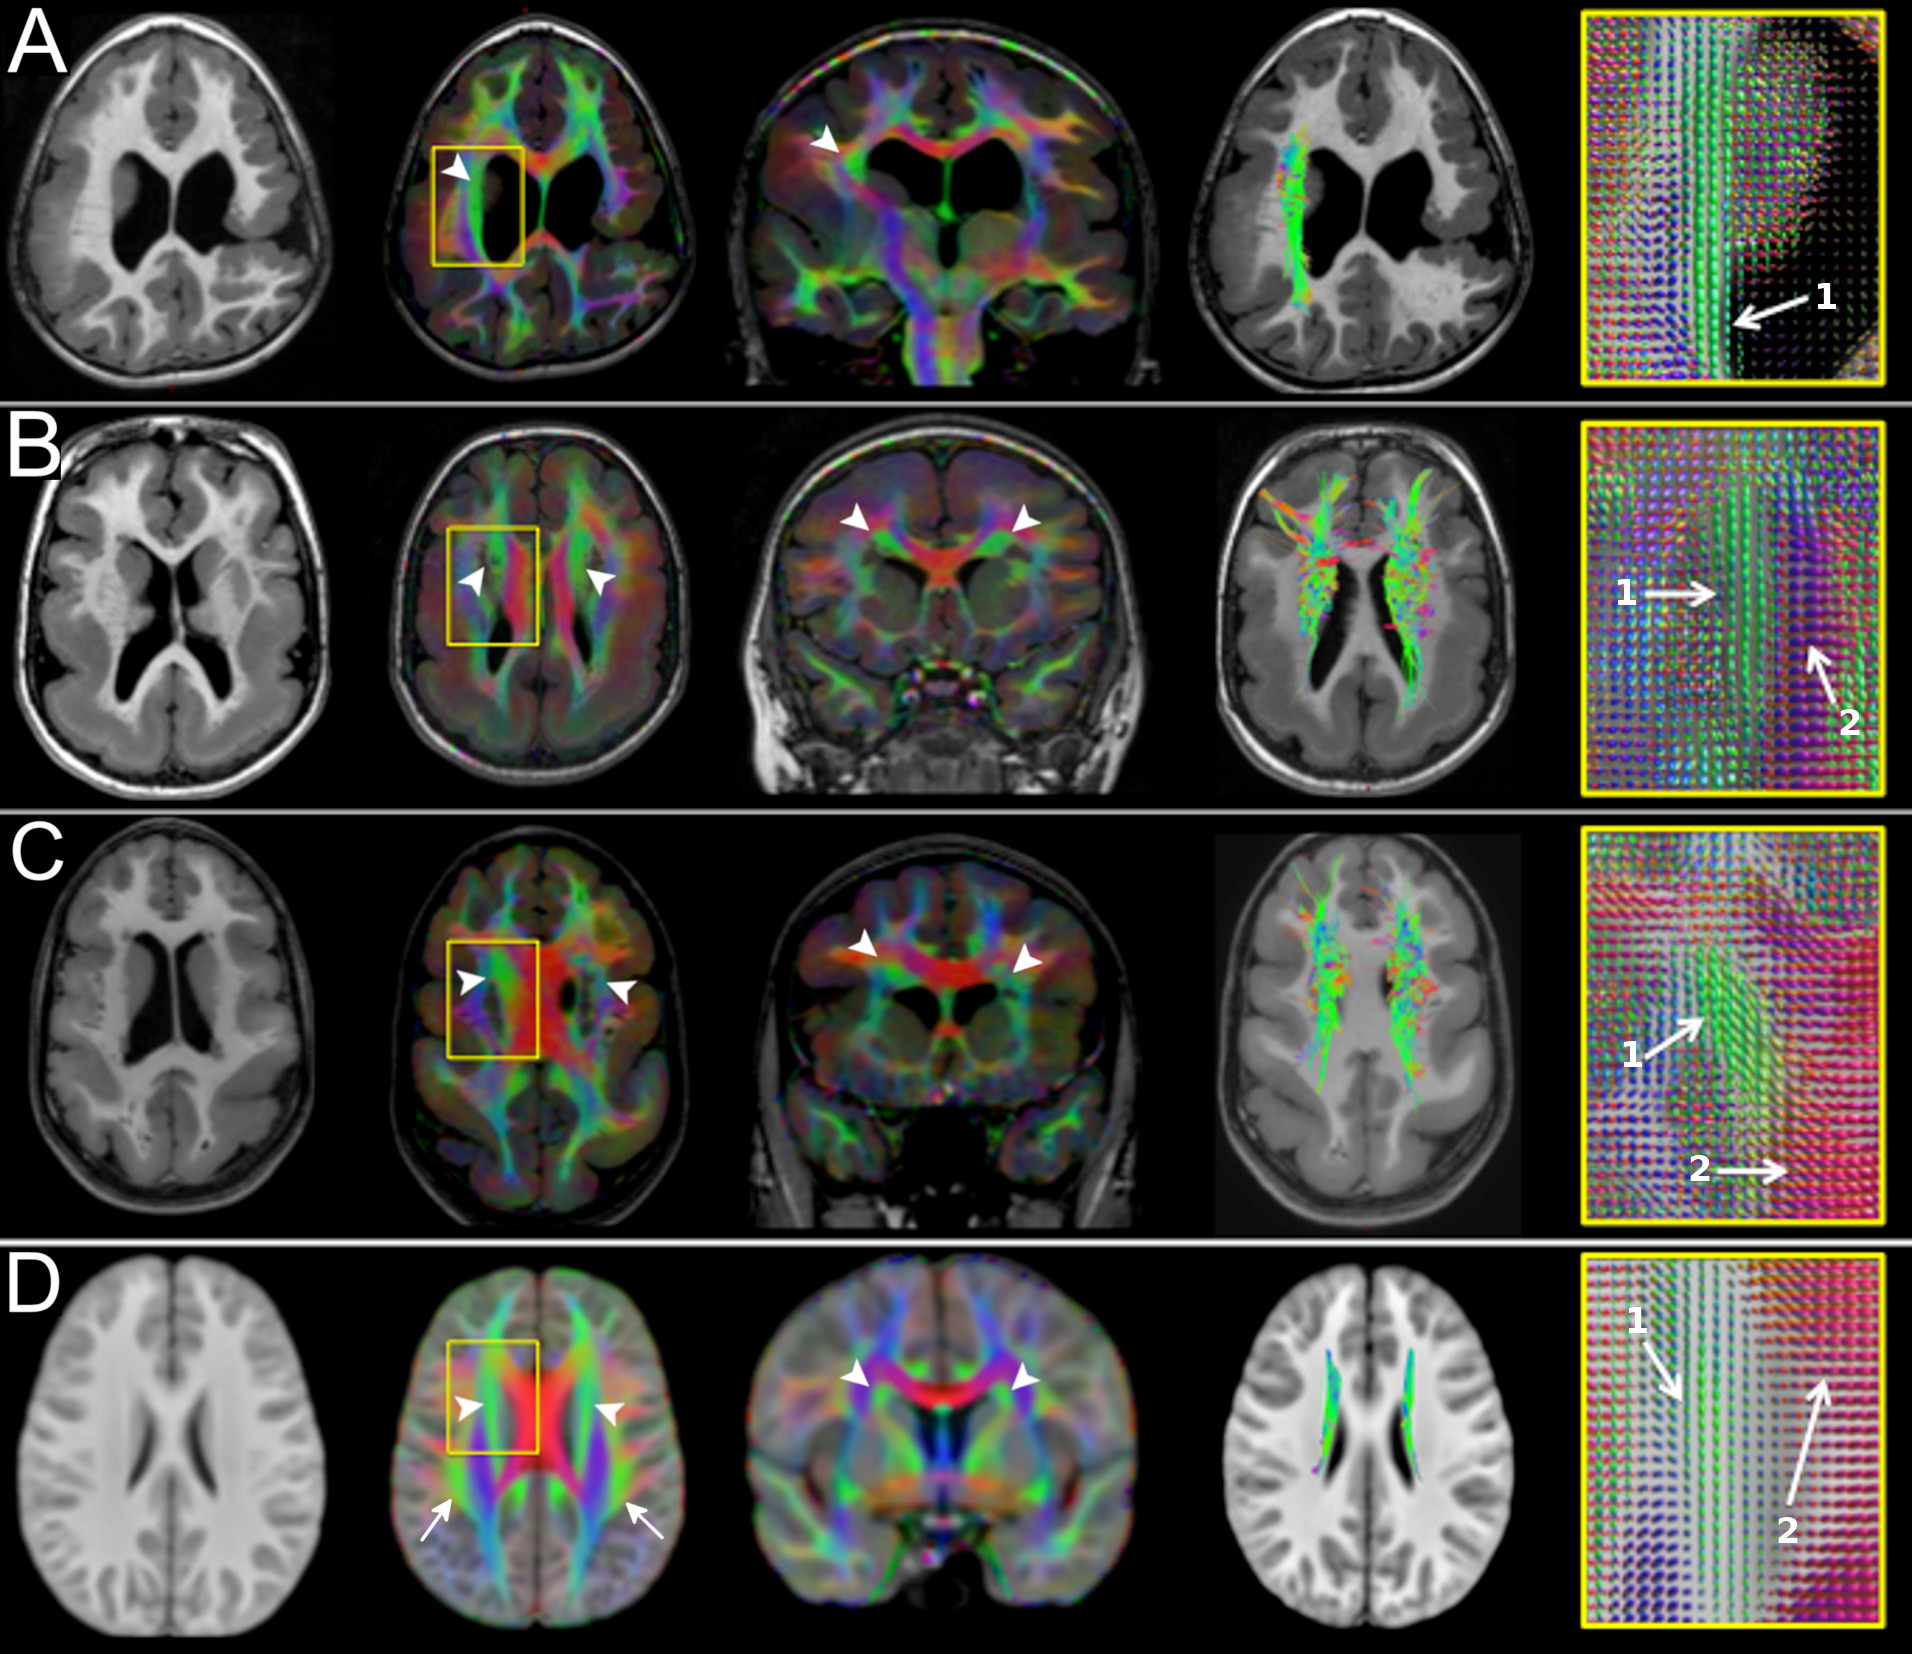
Patients with i) a radiological diagnosis of PMG or LIS spectrum and ii) a 3T MR brain exam including high-resolution T1 and T2-weighted sequences and Diffusion data with ≥ 32 directions and b-value ≥ 1100 s/mm2 were retrospectively selected and included in the study.The data were first pre-processed with TORTOISE software6 to correct for EPI distortion, motion artefacts, Gibbs ringing and bias field inhomogeneities. MRtrix3 software was used to compute multi-fibre based white matter modelling using single-shell 3 tissue Contrained Spherical Deconvolution (CSD), The derived fibre orientation distribution based diffusion encoded color (DEC) maps were coregistered and displayed with the T1-weighted images7 and used for tractography ROI placements. Tractography was performed using a probabilistic algorithm and default tracking parameters from MRtrix3. Diffusion data of normal children were obtained from the PedsDTI database of the NIH8 and were preprocessed with the same pipeline.
Two experienced pediatric neuroradiologists assessed by consensus the appearance of selected WM tracts on DEC maps, and tractography reconstructions. Comparisons were made against age-matched controls. We evaluated the following white matter tracts: Cingulum (CG), Superior Fronto-Occipital fasciculus (SFOF), Inferior Fronto-Occipital fasciculus (IFOF), Superior Longitudinal Fasciculus (SLF), Inferior Longitudinal Fasciculus (ILF), Optic Radiations and Posterior Corona Radiata (OR-PCR), Fornix (FX), Anterior Commissure (AC), Corpus Callosum (CC). Each tract was scored, in consensus, from least to most severe, by adopting a modified version of semi-quantitative scoring system previously used to grade other MCD tract abnormalities 9:
• Grade I (Normal): WM tracts had similar size and geometry compared to the healthy controls
• Grade IIA (Irregular): WM tracts characterized by at least one of the following features: reduced size, displaced fibers or distorted geometry
• Grade IIB (Thick): WM tracts with increased size compared to the healthy controls
• Grade III (Absent): failed tractography reconstruction and no recognizable WM tracts on the DEC maps
Results
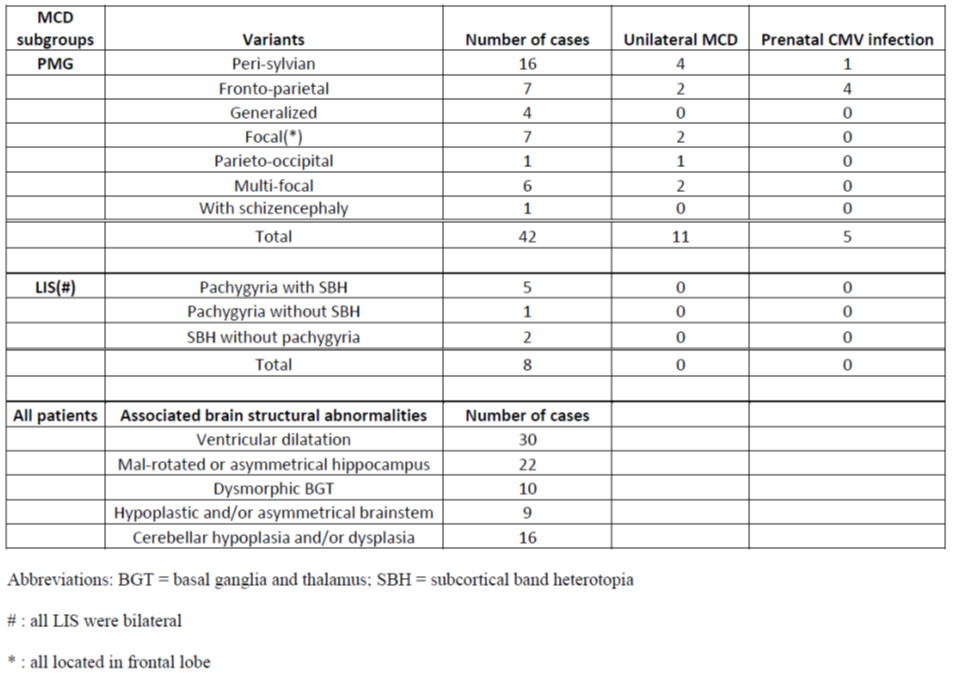
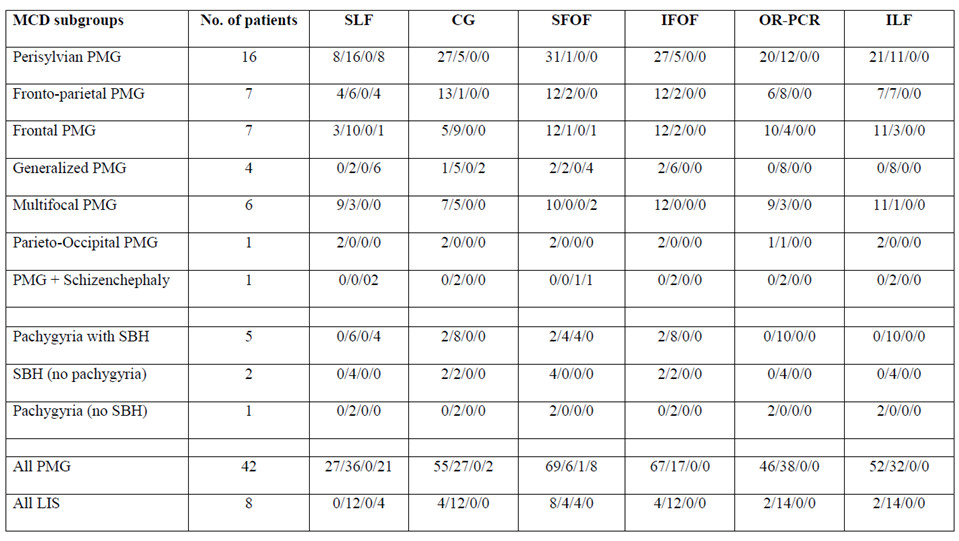
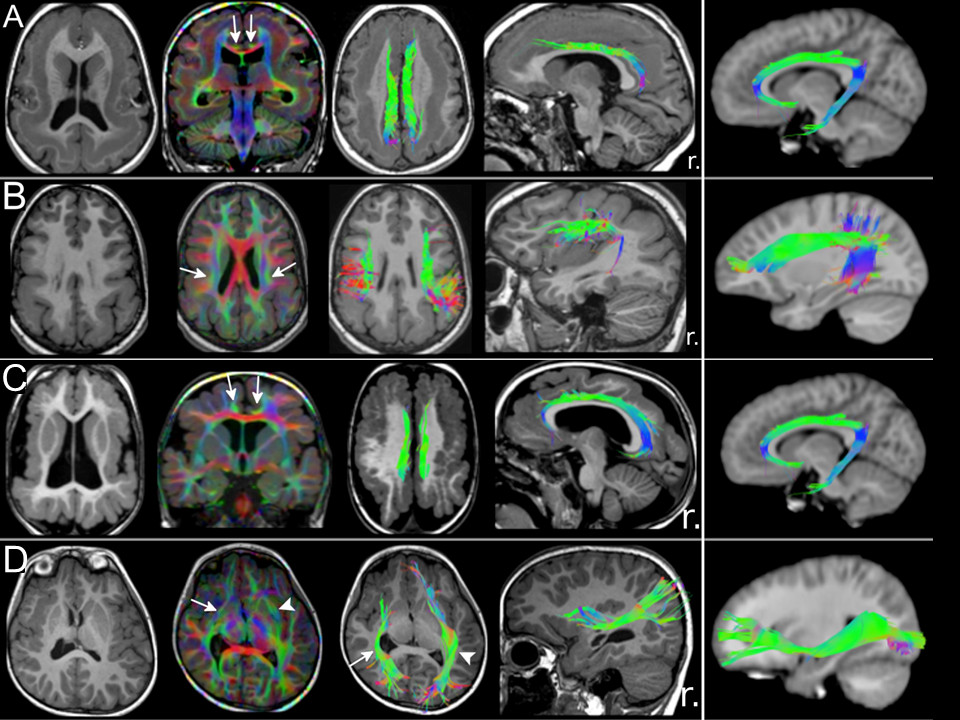
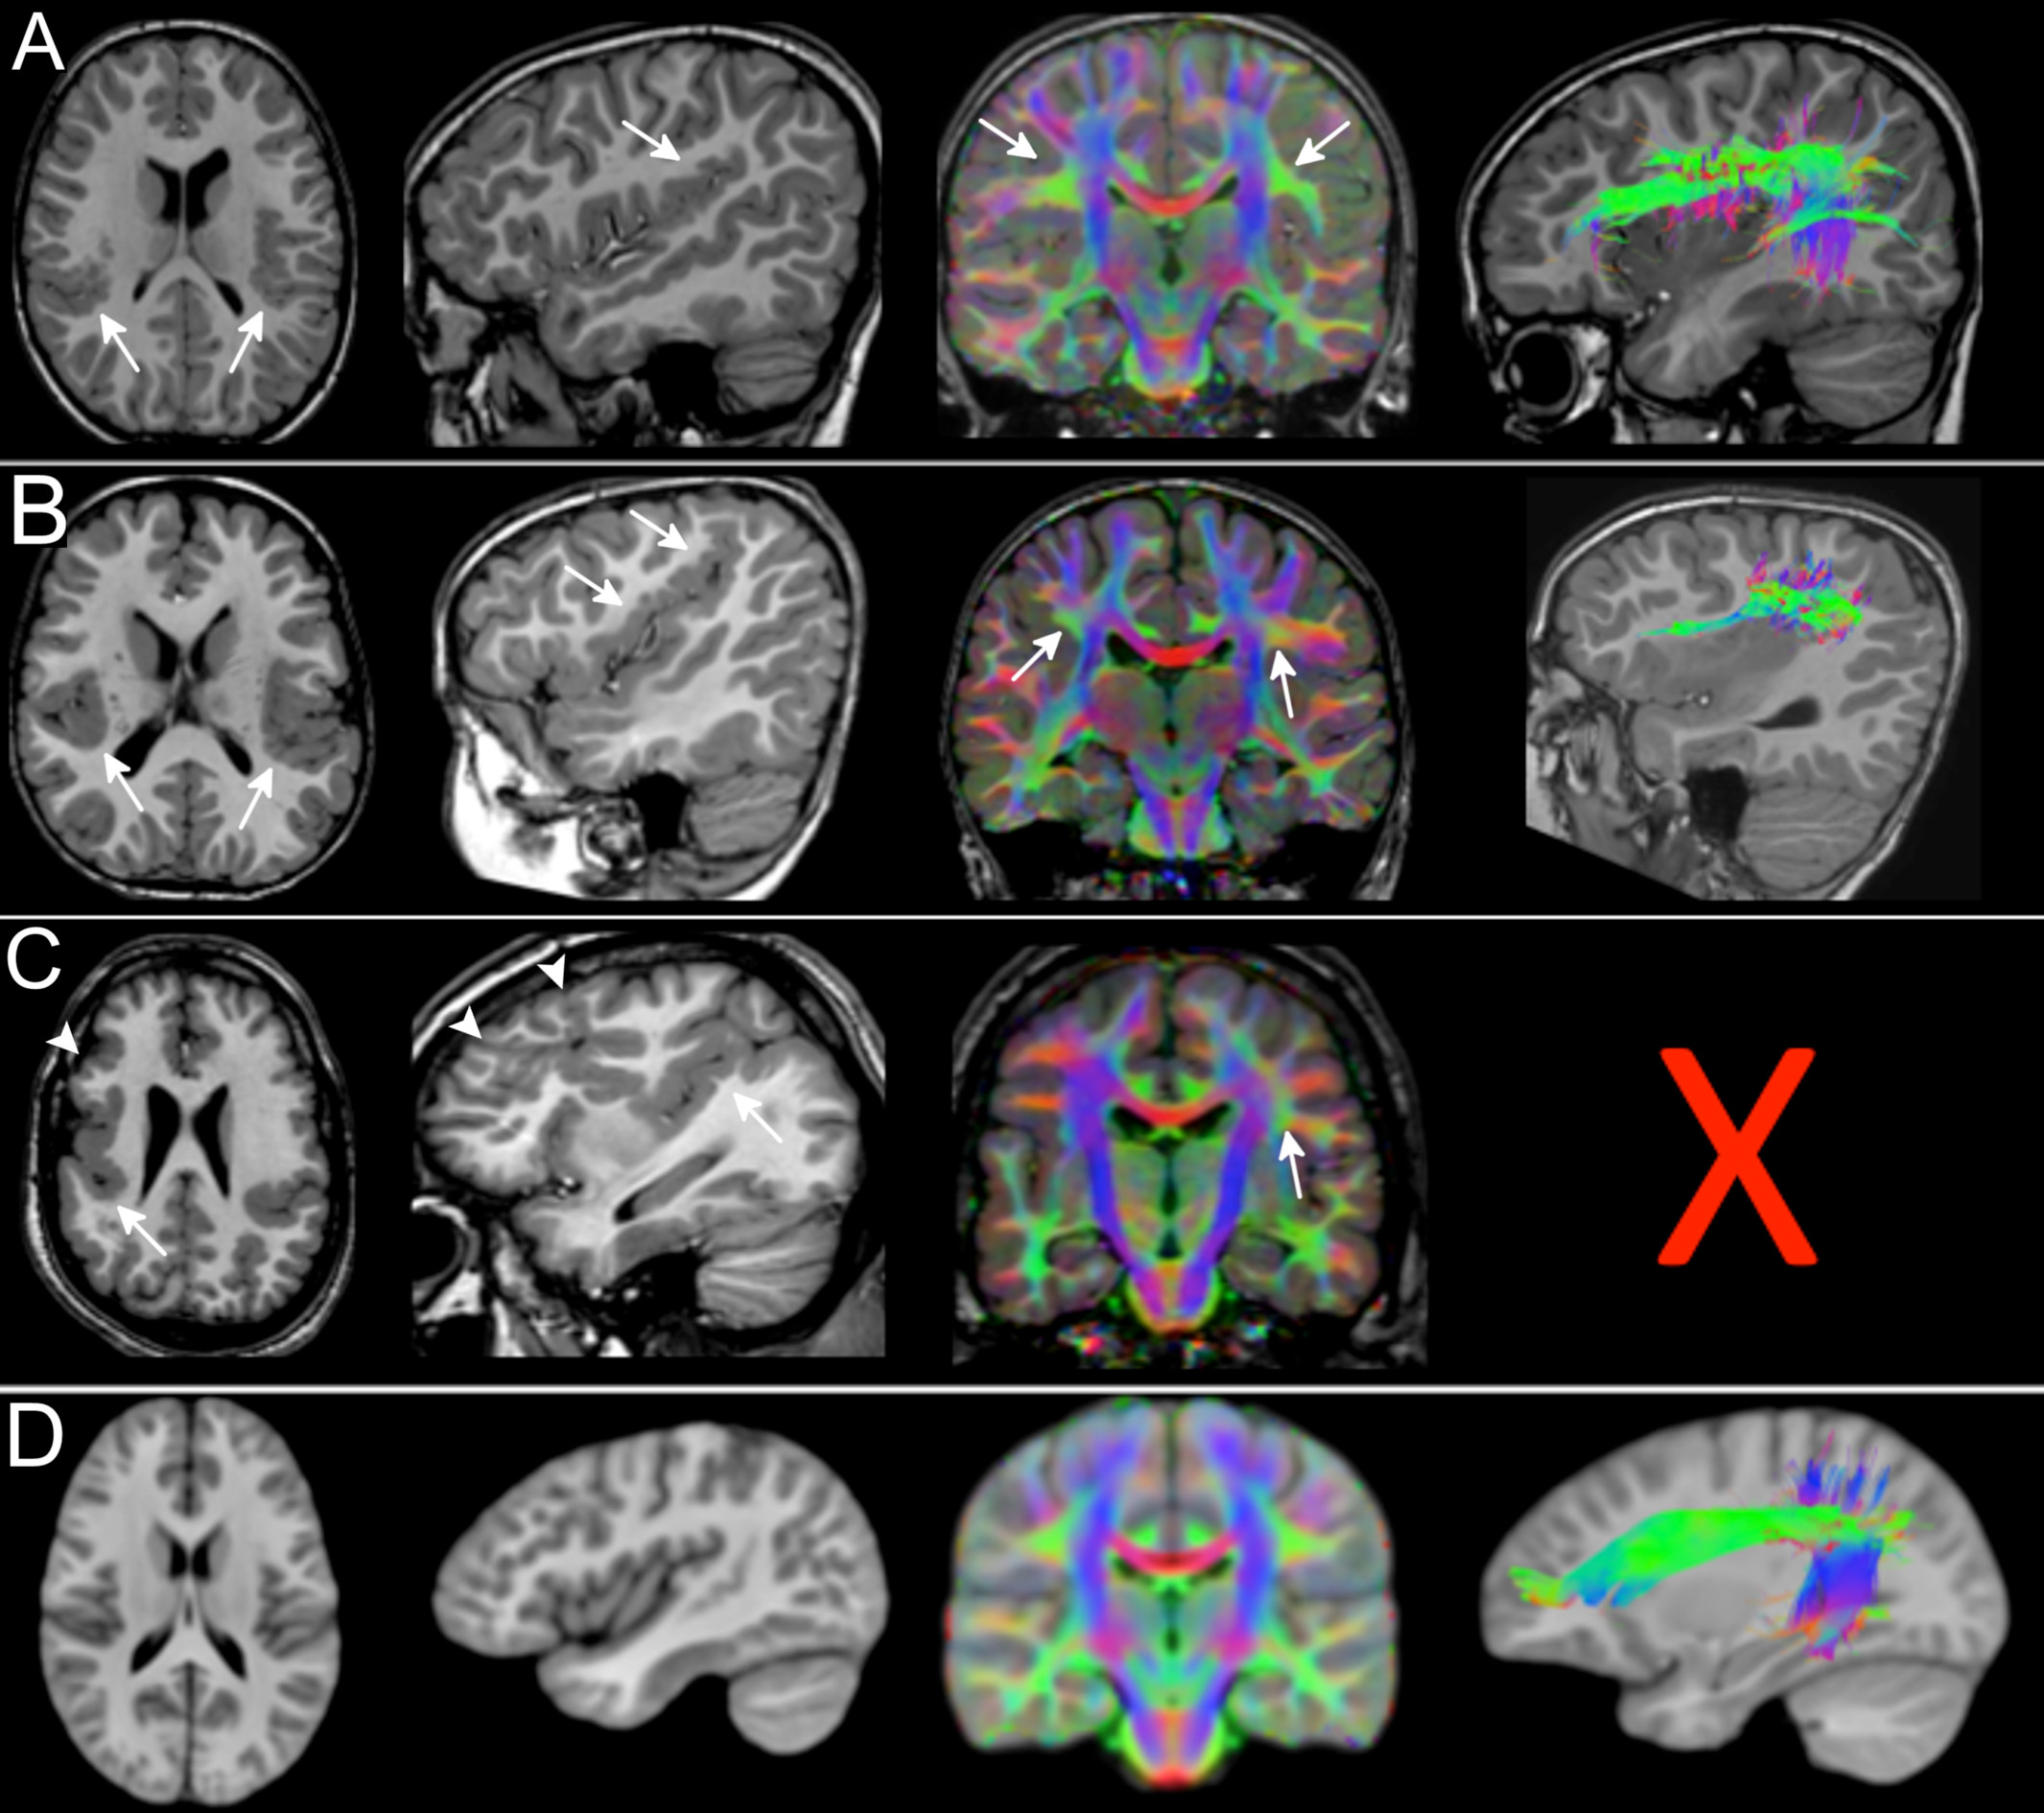
Fifty patients (8.3 ± 5.4 years; 27 males) were included. Forty-two patients had PMG and eight had LIS spectrum. PMG was unilateral in 11 patients. Table 1 summarizes patient demographics and MCD characteristics. Table 2 summarizes results of WM tract analysis. LIS patients had more WM tract abnormalities than PMG patients (percentage of overall abnormal tracts in LIS and PMG: 79.2% versus 37.3%). Tract abnormalities were identified in all studied WM tract from all LIS patients. For PMG patients, the more frequently affected WM tracts were the CG, ILF, PCR-OR, and SLF (Fig.1). Extent of WM tract abnormalities in PMG were associated with severity and distribution/location of the cortical abnormality (Fig. 2). Thickened SFOF were identified in three subjects (6%)(Fig. 3).Discussion
We demonstrated different patterns of WM tracts organization in a large cohort of patients with complex MCD using tissue specific CSD modelling technique and probabilistic tractography reconstructions. Degree of tract abnormalities is related to the PMG and LIS subgroups and may be associated with timing of cortical developmental defects and extent of malformed cortex. Developmental defect for LIS occurs early during the neuronal migration stage while developmental defect for PMG occurs later during the post-migration stage2,10. The greater extent and severity of the WM tract impairments in LIS implies global disruption of the normal cortical-cortical and cortico-subcortical circuitries. The extent of WM tract abnormalities reflected MCD severity and location. This association was particularly noticeable when comparing generalized versus focal PMG, and the frequent involvement of CG and SLF in our frontal and perisylvian PMG cohorts. The association was less clear for the posterior WM tracts (i.e. the ILF, IFOF and PCR-OR) with occipital fiber projections. Thickened SFOF was observed in three cases. We hypothesized underlying mechanism for this rare observation may be impaired axonal guidance leading to miswiring of WM tracts during later development; rather than a failure of regression of transient fiber pathways present during fetal development. This hypothesis was supported by concurrent observation of SLF agenesis in all three cases with thickened SFOF.Conclusion
White matter tract organization in patients with complex MCD can be characterized using tissue-specific CSD white matter modelling and probabilistic tractography techniques. Patterns of white matter abnormalities observed are related to the MCD distribution and subgroups, and possibly to their underlying aetiologies.Acknowledgements
No acknowledgement found.References
1) Barkovich AJ, Kuzniecky RI, Dobyns WB, et al. A classification scheme for malformations of cortical development. Neuropediatrics. 1996;27:59–63.
2) Barkovich AJ, Guerrini R, Kuzniecky RI, et al. A developmental and genetic classification for malformations of cortical development: Update 2012. Brain. 2012;135:1348–1369.
3) Poretti A, Meoded A, Rossi A, et al. Diffusion tensor imaging and fiber tractography in brain malformations. Pediatr Radiol. 2013;43:28–54.
4) Huisman TAGM, Bosemani T, Poretti A. Diffusion tensor imaging for brain malformations: Does it help? Neuroimaging Clin N Am. 2014;24:619–637.
5) Arrigoni F, Romaniello R, Peruzzo D, et al. The spectrum of brainstem malformations associated to mutations of the tubulin genes family: MRI and DTI analysis. Eur Radiol. 2019;29:770–782.
6) Pierpaoli C, Walker L, Irfanoglu MO, et al.Tortoise: an integrated software package for processing of diffusion MRI data. In: Proceedings of International Society of Magnetic Resonance in Medicine. 201;p 1597
7) Dhollander T., Raffelt D., Smith RE. CA. Panchromatic sharpening of FOD-based DEC maps by structural T1 information. In: Proceedings of the 23th annual meeting of the International Society of Magnetic Resonance in Medicine. 2015;p 566
8) Walker L, Chang L, Nayak A, et al. The diffusion tensor imaging ( DTI ) component of the NIH MRI study of normal brain development ( PedsDTI ). Neuroimage. 2016;124:1125–1130.
9) Andrade CS, Figueiredo KG, Valeriano C, et al. DTI-based tractography of the arcuate fasciculus in patients with polymicrogyria and language disorders. Eur J Radiol. 2015;84:2280–2286.
10) Romero DM, Bahi-Buisson N, Francis F. Genetics and mechanisms leading to human cortical malformations. Semin Cell Dev Biol. 2018;76:33–75.
Figures