0238
Growth Charting of Grey Matter and White Matter Functional Network among Normal Children and Adolescents1Huaxi MR Research Center (HMRRC), Functional and molecular imaging Key Laboratory of Sichuan Province, Department of Radiology, Sichuan University, Chengdu, China, 2Department of Biomedical Engineering, New Jersey Institute of Technology, Newark, NJ, United States
Synopsis
In current study, we used a network growth charting method to map the normative maturational trajectories of major functional network activity in both grey matter and white matter. A quadratic maturation trajectory of functional activity was observed in DMN, SMN and FPN for both grey matter and white matter. The coherent maturational trajectory between these grey matter and white matter network suggests the corresponding refinements of brain network function plays an important role in improvements in higher-order cognitive abilities during normative adolescent development.
Introduction
Normative growth charts1 have been produced for physical characteristics for a long period. With the advent of resting-state functional neuroimaging, the potential now exists to extend growth charting methods to maturing functional networks in the brain. The human brain is organized into several large-scale intrinsic networks and demonstrate substantial maturation during youth. Recently, some studies2,3 suggest that similarly to the grey matter, which can be investigated using resting-state fMRI, white matter also manifests an intrinsic functional organization as interacting networks of functional networks. Given the adolescent period as a neurobiological critical period for the development of high-order cognition, we use a network growth charting approach to investigate maturation of both grey matter and white matter functional network among children and adolescents.Methods
We enrolled 103 typically developing children and adolescents aged from 7 to 18 years old (male/female: 71/32) from West China Hospital, Sichuan University. All subjects were scanned using Siemens Trio 3T MRI system with an 8-channel phase-array head coil. The MR data for each subject consisted of a resting-state EPI scan, a T1- weighted anatomical scan.After functional and anatomical images preprocessing, K-means clustering (ranging from 2 to 22) was performed on the voxel-wise correlation matrices to identify grey and white matter functional networks, respectively. Dice’s coefficient was calculated for each clustering to identify the most stable solutions. Each participant received an amplitude for each network, which reflects the degree of functional activity within the network. We next created normative growth charts for each network by plotting a linear or quadratic fit line for network amplitude against age. Besides, signal amplitudes in each frequency were extracted from each grey and white matter network and were averaged across participants to produce an average frequency-power graph for each network.
Results
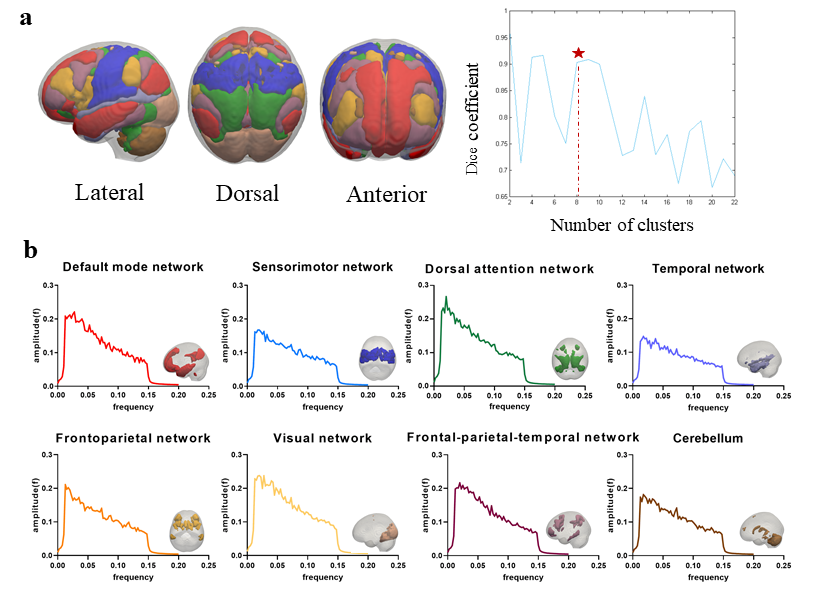
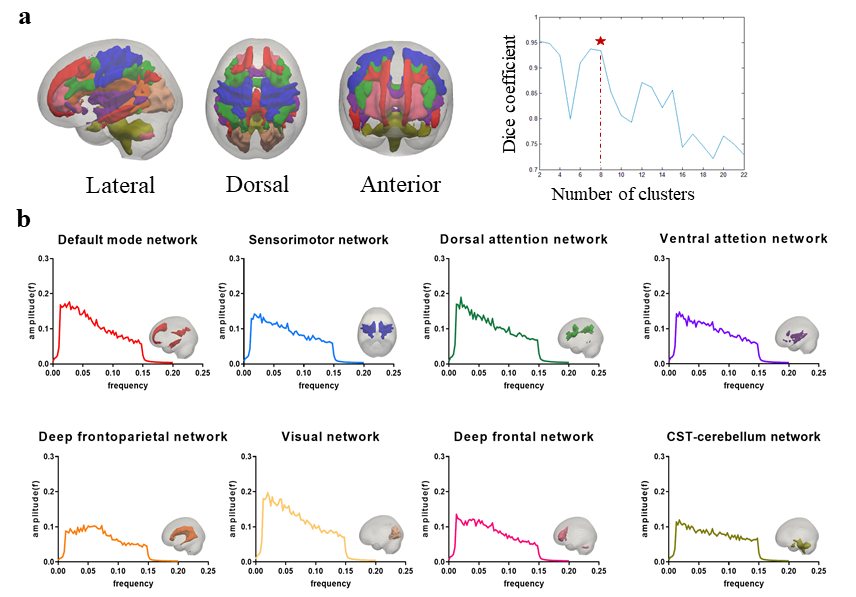
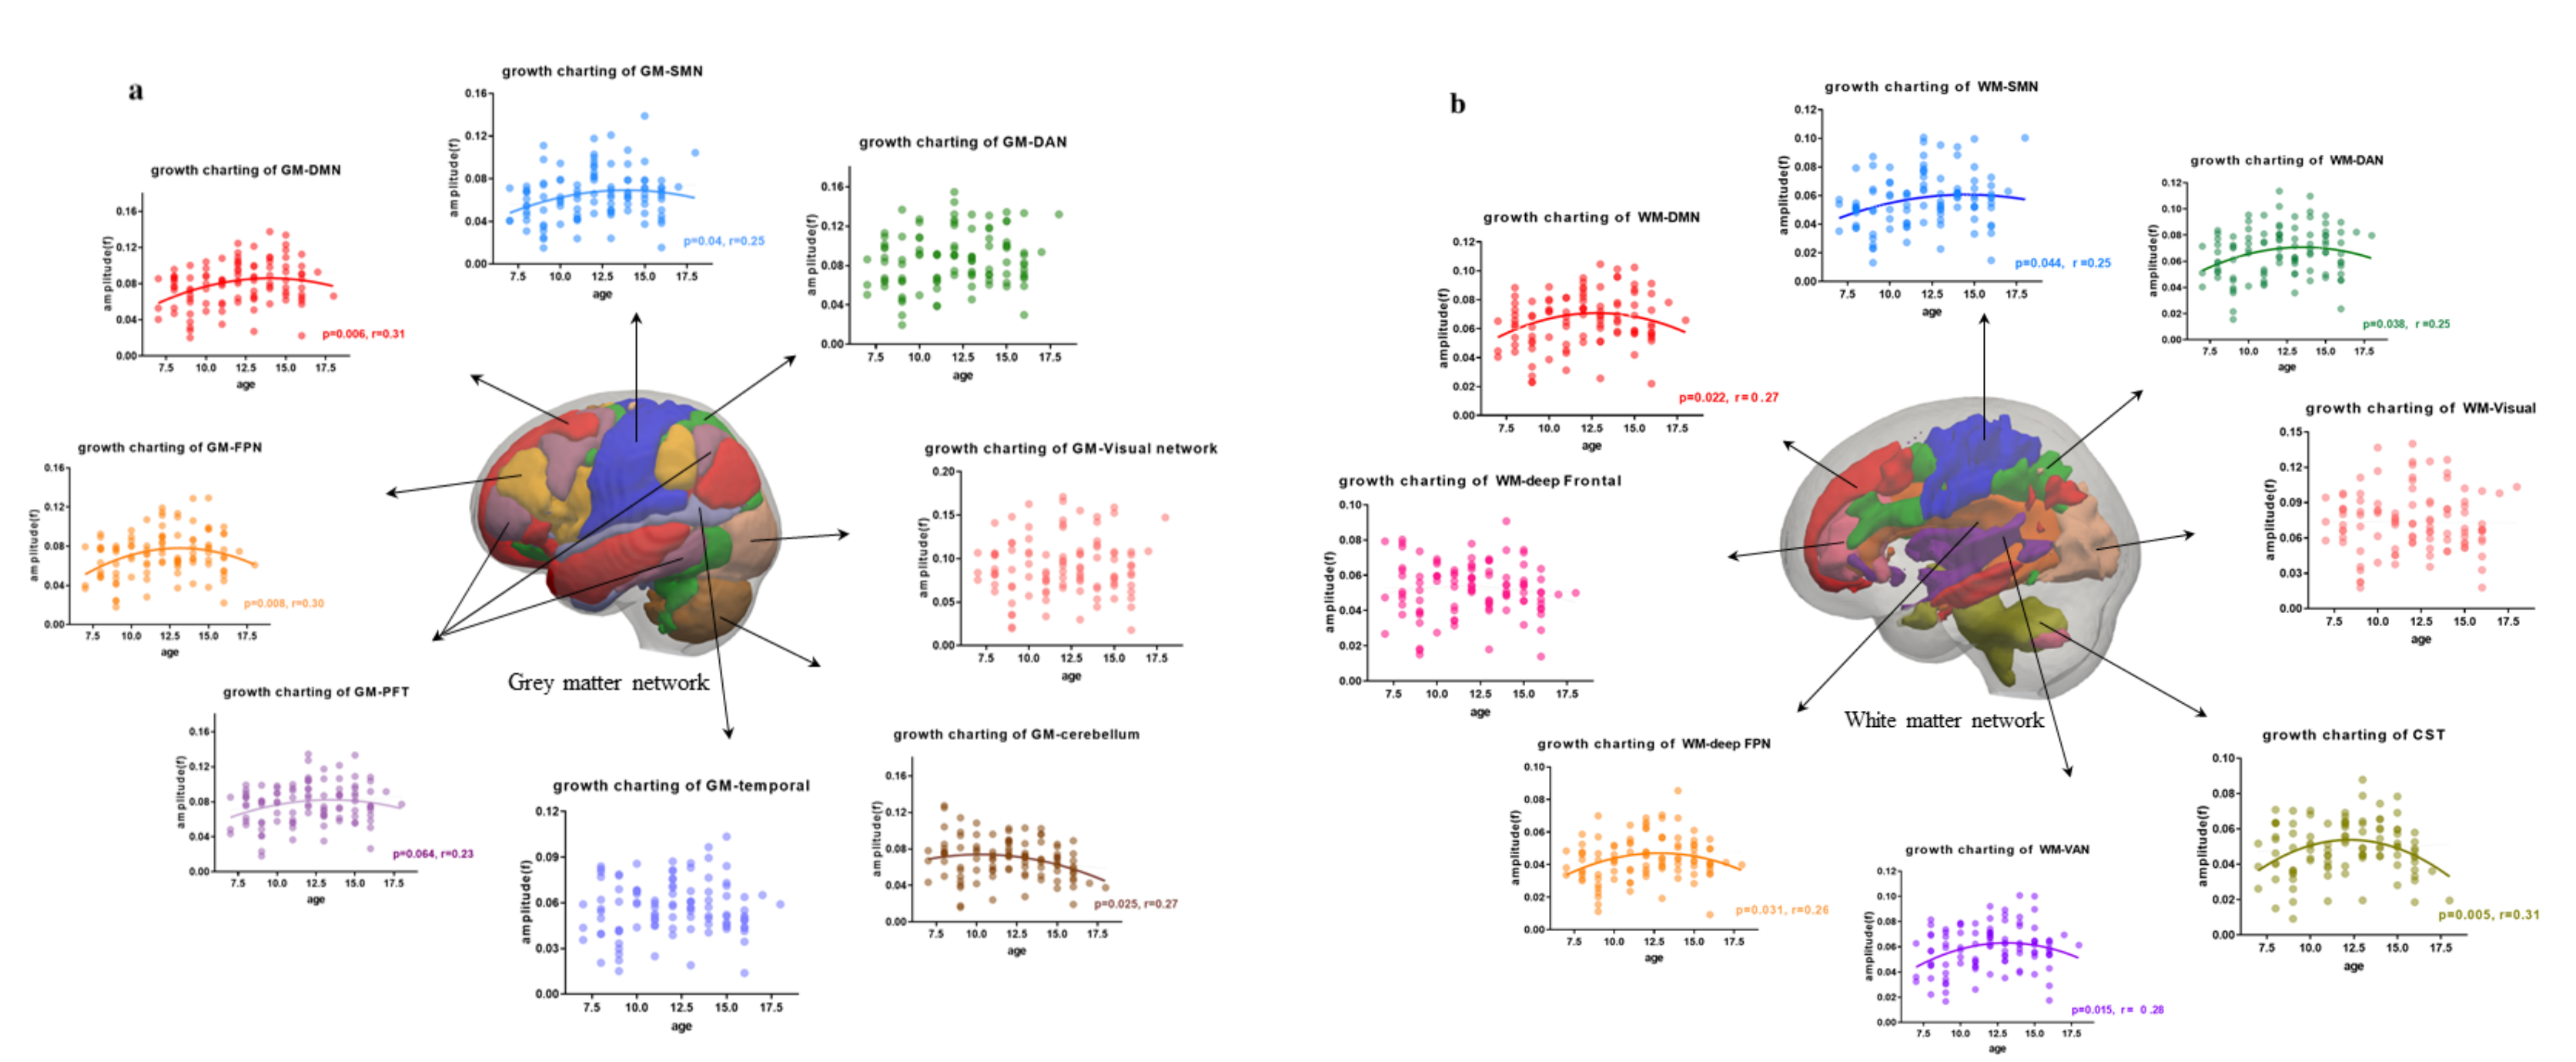
The number of clusters that represented the most stable functional segregations for both grey matter (Fig 1a) and white matter (Fig 2a) is eight. The identified grey matter network were default mode network (DMN), sensorimotor network (SMN), dorsal attention network (DAN), temporal network, frontoparietal network (PFN), visual network, frontal-parietal-temporal network and cerebellum network, and white matter network included DMN, SMN, DAN, ventral attention network, visual network, deep FPN, deep frontal network, and inferior corticospinal-cerebellum network. The amplitude of signal is greater at lower frequencies for both grey matter and white matter network with amplitude in white matter being lower than that in grey matter (Fig 1b for grey matter and Fig 2b for white matter). Most grey matter and white matter network exhibited quadratic maturation and had some common maturation pattern (Fig 3a for grey matter and Fig 3b for white matter). Notably, DMN, SMN and FPN followed a quadratic development against age whereas visual network did not fit linear or quadratic trend for both grey matter and white matter. Meanwhile, a different pattern was observed in dorsal attention network between grey matter and white matter with white matter fitting a quadratic maturation while grey matter did not.Discussion & Conclusion
In current study, we used a network growth charting method to map the normative maturational trajectories of major functional network activity in both grey matter and white matter. We found that a quadratic maturation is implicated in functional activity of DMN, SMN and FPN for both grey matter and white matter suggesting corresponding refinements of the function of the brain network. The coherent maturational trajectory between grey matter and white matter in these three prominent networks may support the improvements in higher-order cognitive abilities during the transition from adolescence to adulthood.Acknowledgements
This study was supported by National Nature Science Foundation (Grant NO. 81671669), Science and Technology Project of Sichuan Province (Grant NO. 2017JQ0001)References
1. Cole TJ. The development of growth references and growth charts. Ann Hum Biol. 2012; 39(5): 382–394.
2. Peer M, Nitzan M, Bick AS, et al. Evidence for functional networks within the human brain's white matter. J Neurosci. 2017;37(27):6394-6407.
3. Marussich L, Lu KH, Wen H, et al. Mapping white-matter functional organization at rest and during naturalistic visual perception. Neuroimage. 2017;146:1128-1141.
Figures