0231
Towards clinical implementation of multi-shell diffusion MRI: visual pathway investigation in paediatric epilepsy surgery1Developmental Imaging and Biophysics Section, UCL Great Ormond Street Institute of Child Health, London, United Kingdom, 2Clinical and Academic Department of Ophthalmology, Great Ormond Street Hospital for Children NHS Foundation Trust, London, United Kingdom, 3Neurosurgery, Great Ormond Street Hospital for Children NHS Foundation Trust, London, United Kingdom, 4Centre for Medical Image Computing, University College London, London, United Kingdom, 5Department of Clinical and Experimental Epilepsy, UCL Institute of Neurology, London, United Kingdom, 6University of Pittsburgh Medical Centre, Children’s Hospital of Pittsburgh, Pittsburgh, PA, United States, 7Clinical Neurosciences, UCL Great Ormond Street Institute of Child Health, London, United Kingdom
Synopsis
We used multi-shell diffusion imaging to investigate differences in the visual pathways of children undergoing epilepsy surgery and demonstrated its potential for clinical practice. In particular, we compared the traditional Diffusion Tensor Imaging model with the Spherical Mean Technique model and evaluated its potential to produce measures of tissue microstructure not confounded by orientation effects in both a healthy and patient population. Furthermore, we explored the effect of brain surgery and applied Constrained Spherical Deconvolution derived tractography to determine the frequency and influence of the extent and location of resection on the integrity of the visual system after the operation.
Introduction
Diffusion Tensor Imaging (DTI) has been successfully applied clinically in multiple neurological conditions including epilepsy1. Furthermore, DTI has been extensively used for tractography in adult neurosurgical planning, particularly in epilepsy surgery, where accurate reconstructions of the optic radiations are crucial to minimize occurrences of visual field defects2. However, despite its sensitivity to several tissue properties, DTI fails in disentangling highly complex microstructural configurations, as well as in providing estimates of tissue organization free from orientational effects such as fibre crossings and orientation dispersion3. Multi-shell diffusion-weighted imaging (DWI) has the potential to address some of these limitations, given recent advances in acquisition and modelling strategies. In this study, we therefore focused on exploring the clinical translation potential of these methods, in particular Constrained Spherical Deconvolution (CSD) and Spherical Mean Technique (SMT) by conducting a thorough investigation of the visual system in children, where there is very little literature on the use of these techniques. Our main objectives were to investigate pre-existing differences in tissue microstructure between healthy volunteers and patients before surgery, to map the effects of surgery in the microstructure of the visual system in patients and to assess how their visual clinical scores are influenced by frequency and location of optic radiation involvement relative to the resection.Methods
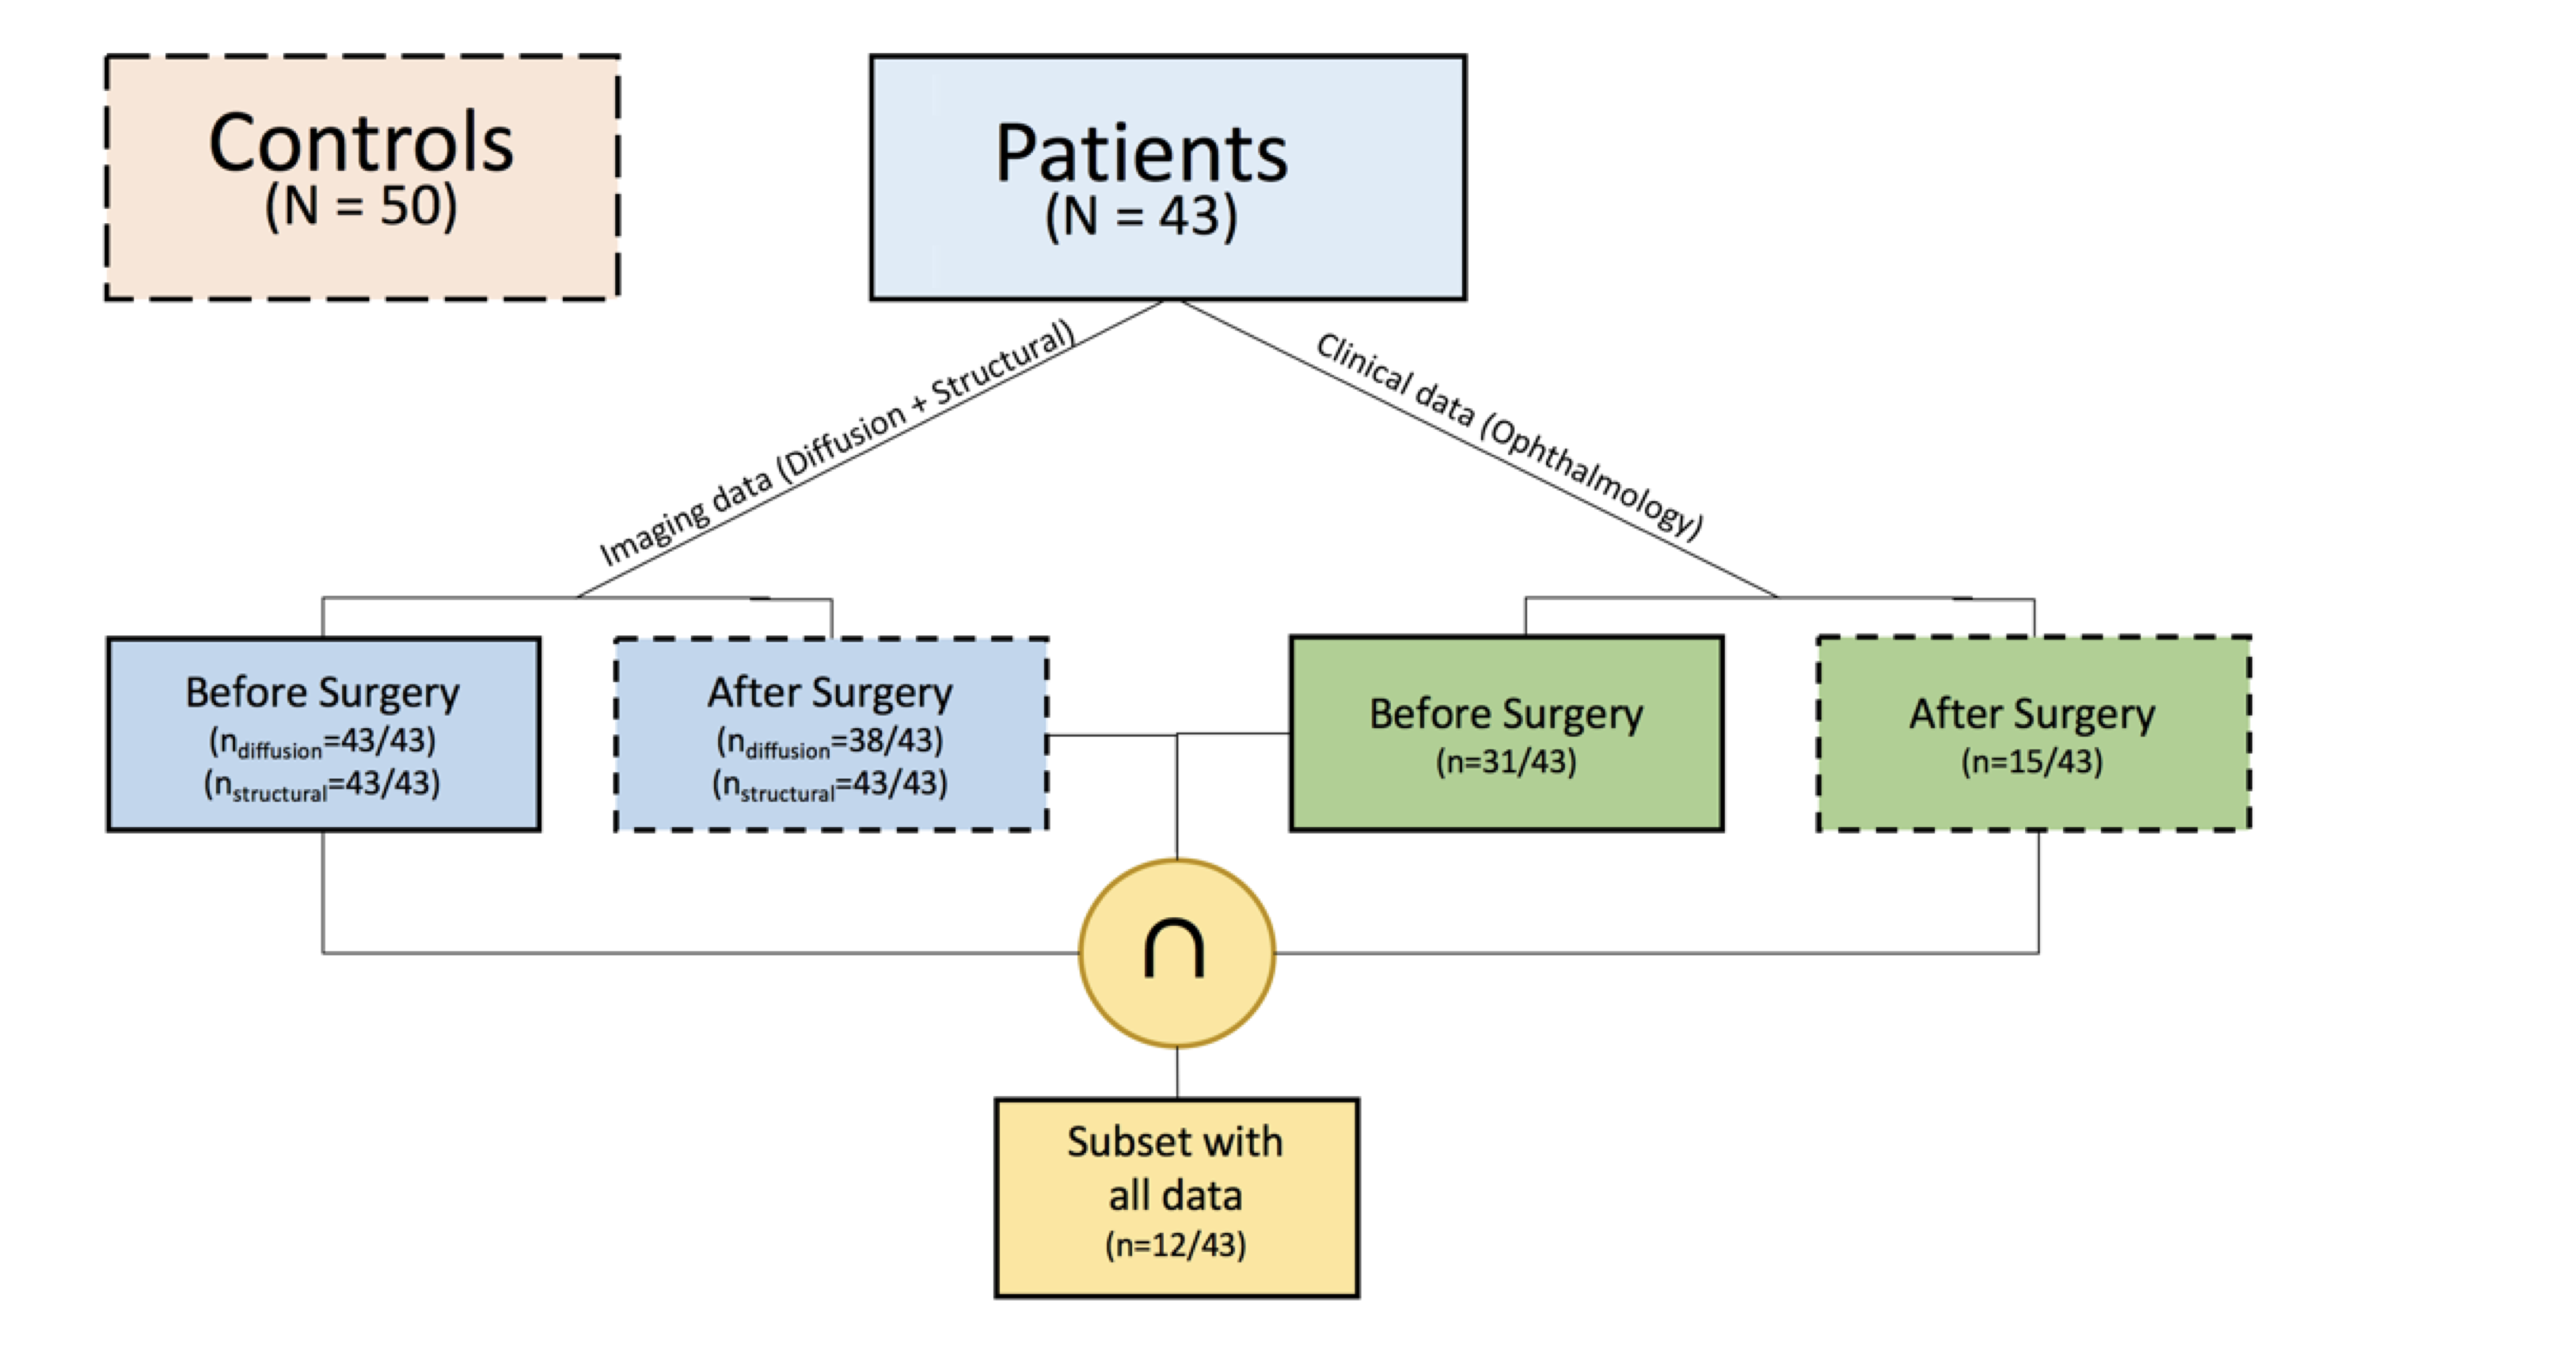
Data inclusion criteria: patients who undergone resective epilepsy surgery affecting the temporal, parietal and occipital lobes that may have involved the optic radiations were selected for this study (aged 5-19 years at operation). Hemispherectomy patients were excluded. Altogether, 43 patients (inter-quartile range 8.4; median 10.70 years; 22 males) and 50 healthy children and young adults with no visual/neurological conditions (inter-quartile range 6.5; median 11.00 years; 30 male) were included in this study(Figure 1).Data acquisition: each subject underwent a two-shell DWI protocol on a Siemens Prisma 3.0T clinical system (Siemens Healthcare, Erlangen, Germany). Data were collected using a multi-band diffusion-weighted single-shot spin echo EPI, with an acceleration factor of 2; images were acquired for two sets of 60 non-collinear directions, using a weighting factor of 1000s.mm-2 and 2200s.mm-2 respectively, along with 13 additional T2-weighted (b=0) volumes. 66 axial slices of thickness 2.0mm were imaged, using a FOV=220×220mm and 110×110 voxel acquisition matrix, for a final image resolution of 2.0×2.0×2.0mm; TE=60ms and TR=3050ms. In addition, a T1-weighted MPRAGE structural image was acquired using 176 contiguous sagittal slices, FOV=256×240mm and 1×1×1mm image resolution; TE=4.9ms and TR=11ms. Imaging data were acquired before and after surgery. Visual field function was evaluated with Goldmann perimetry.
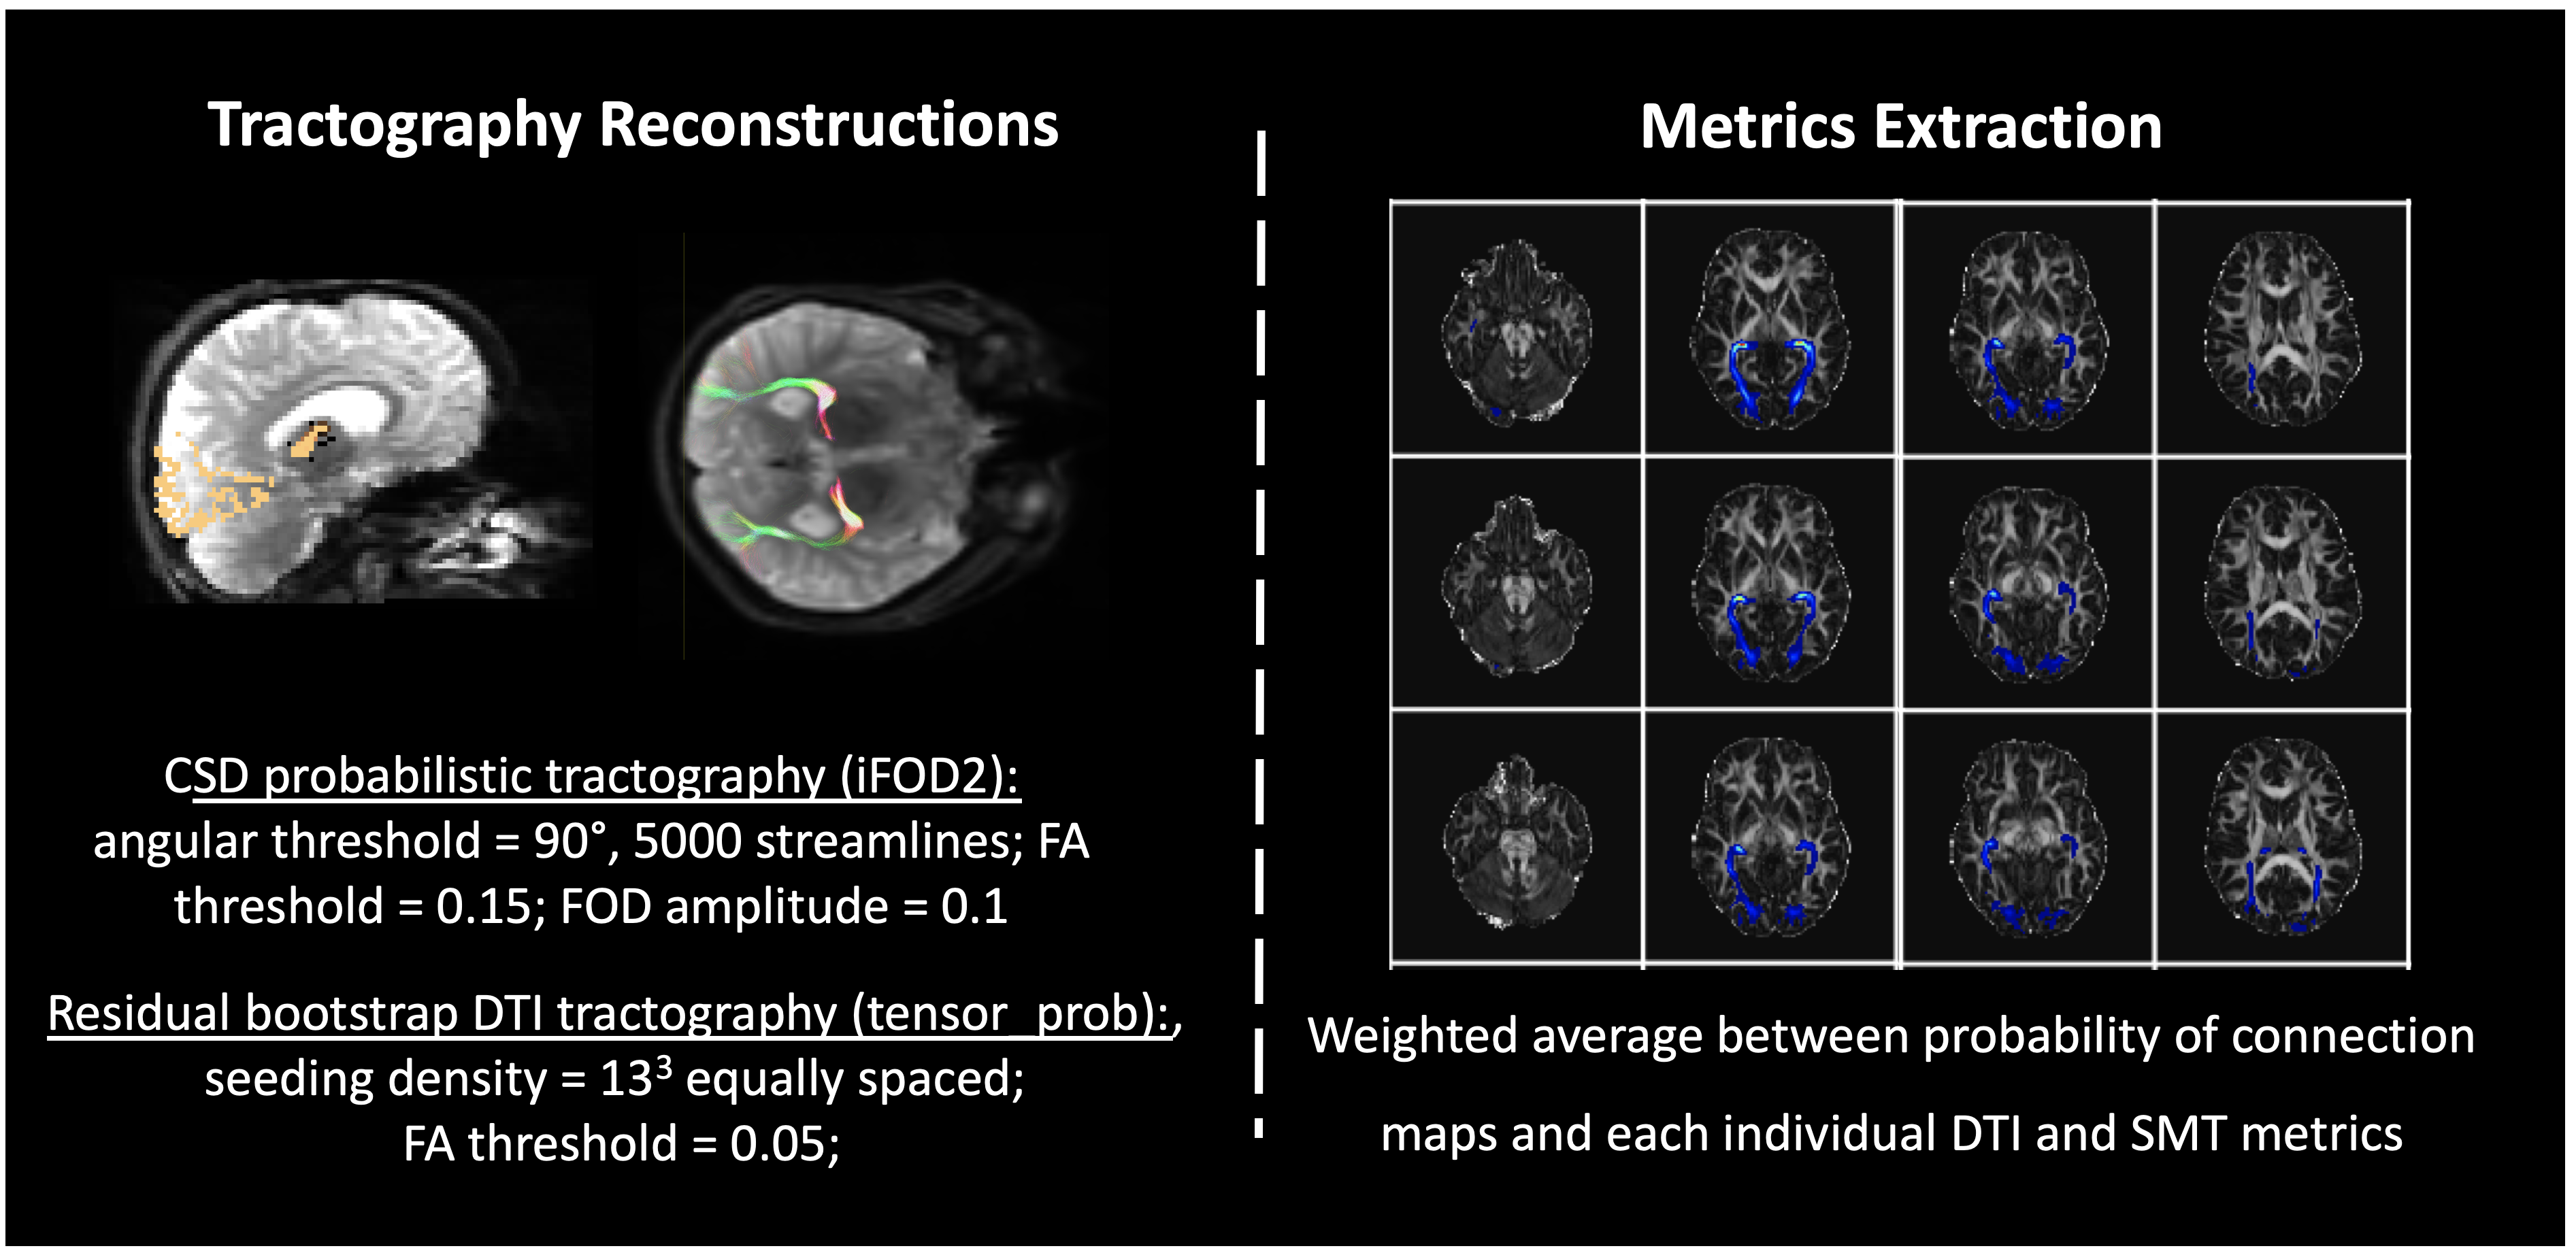
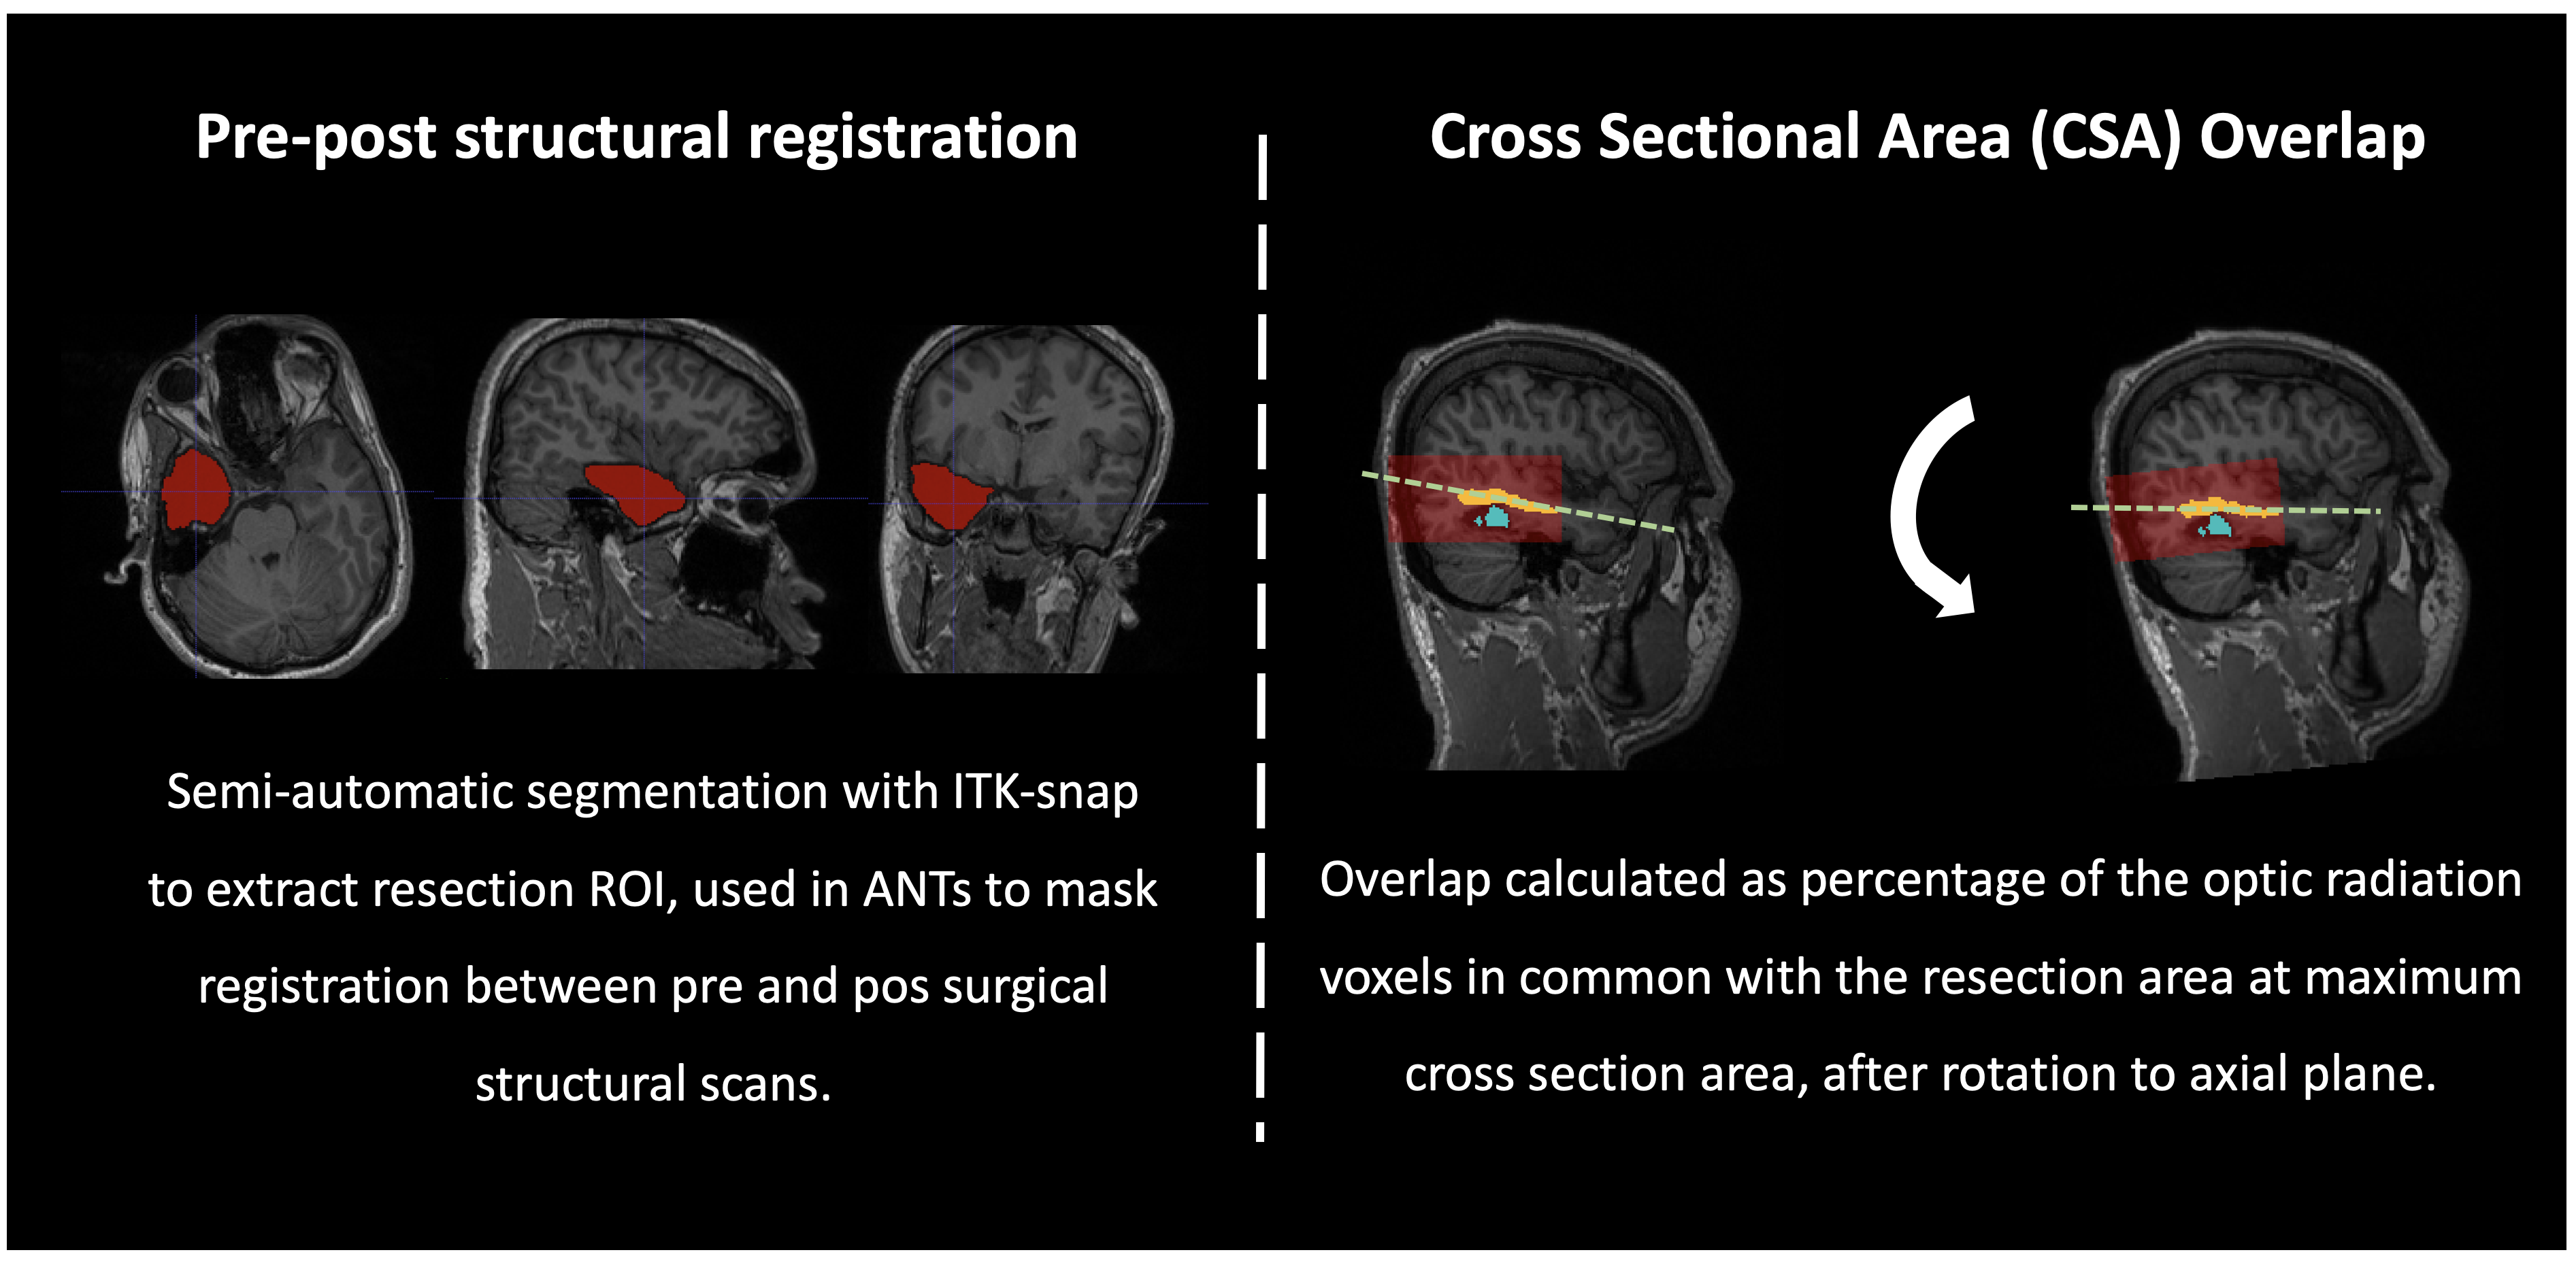
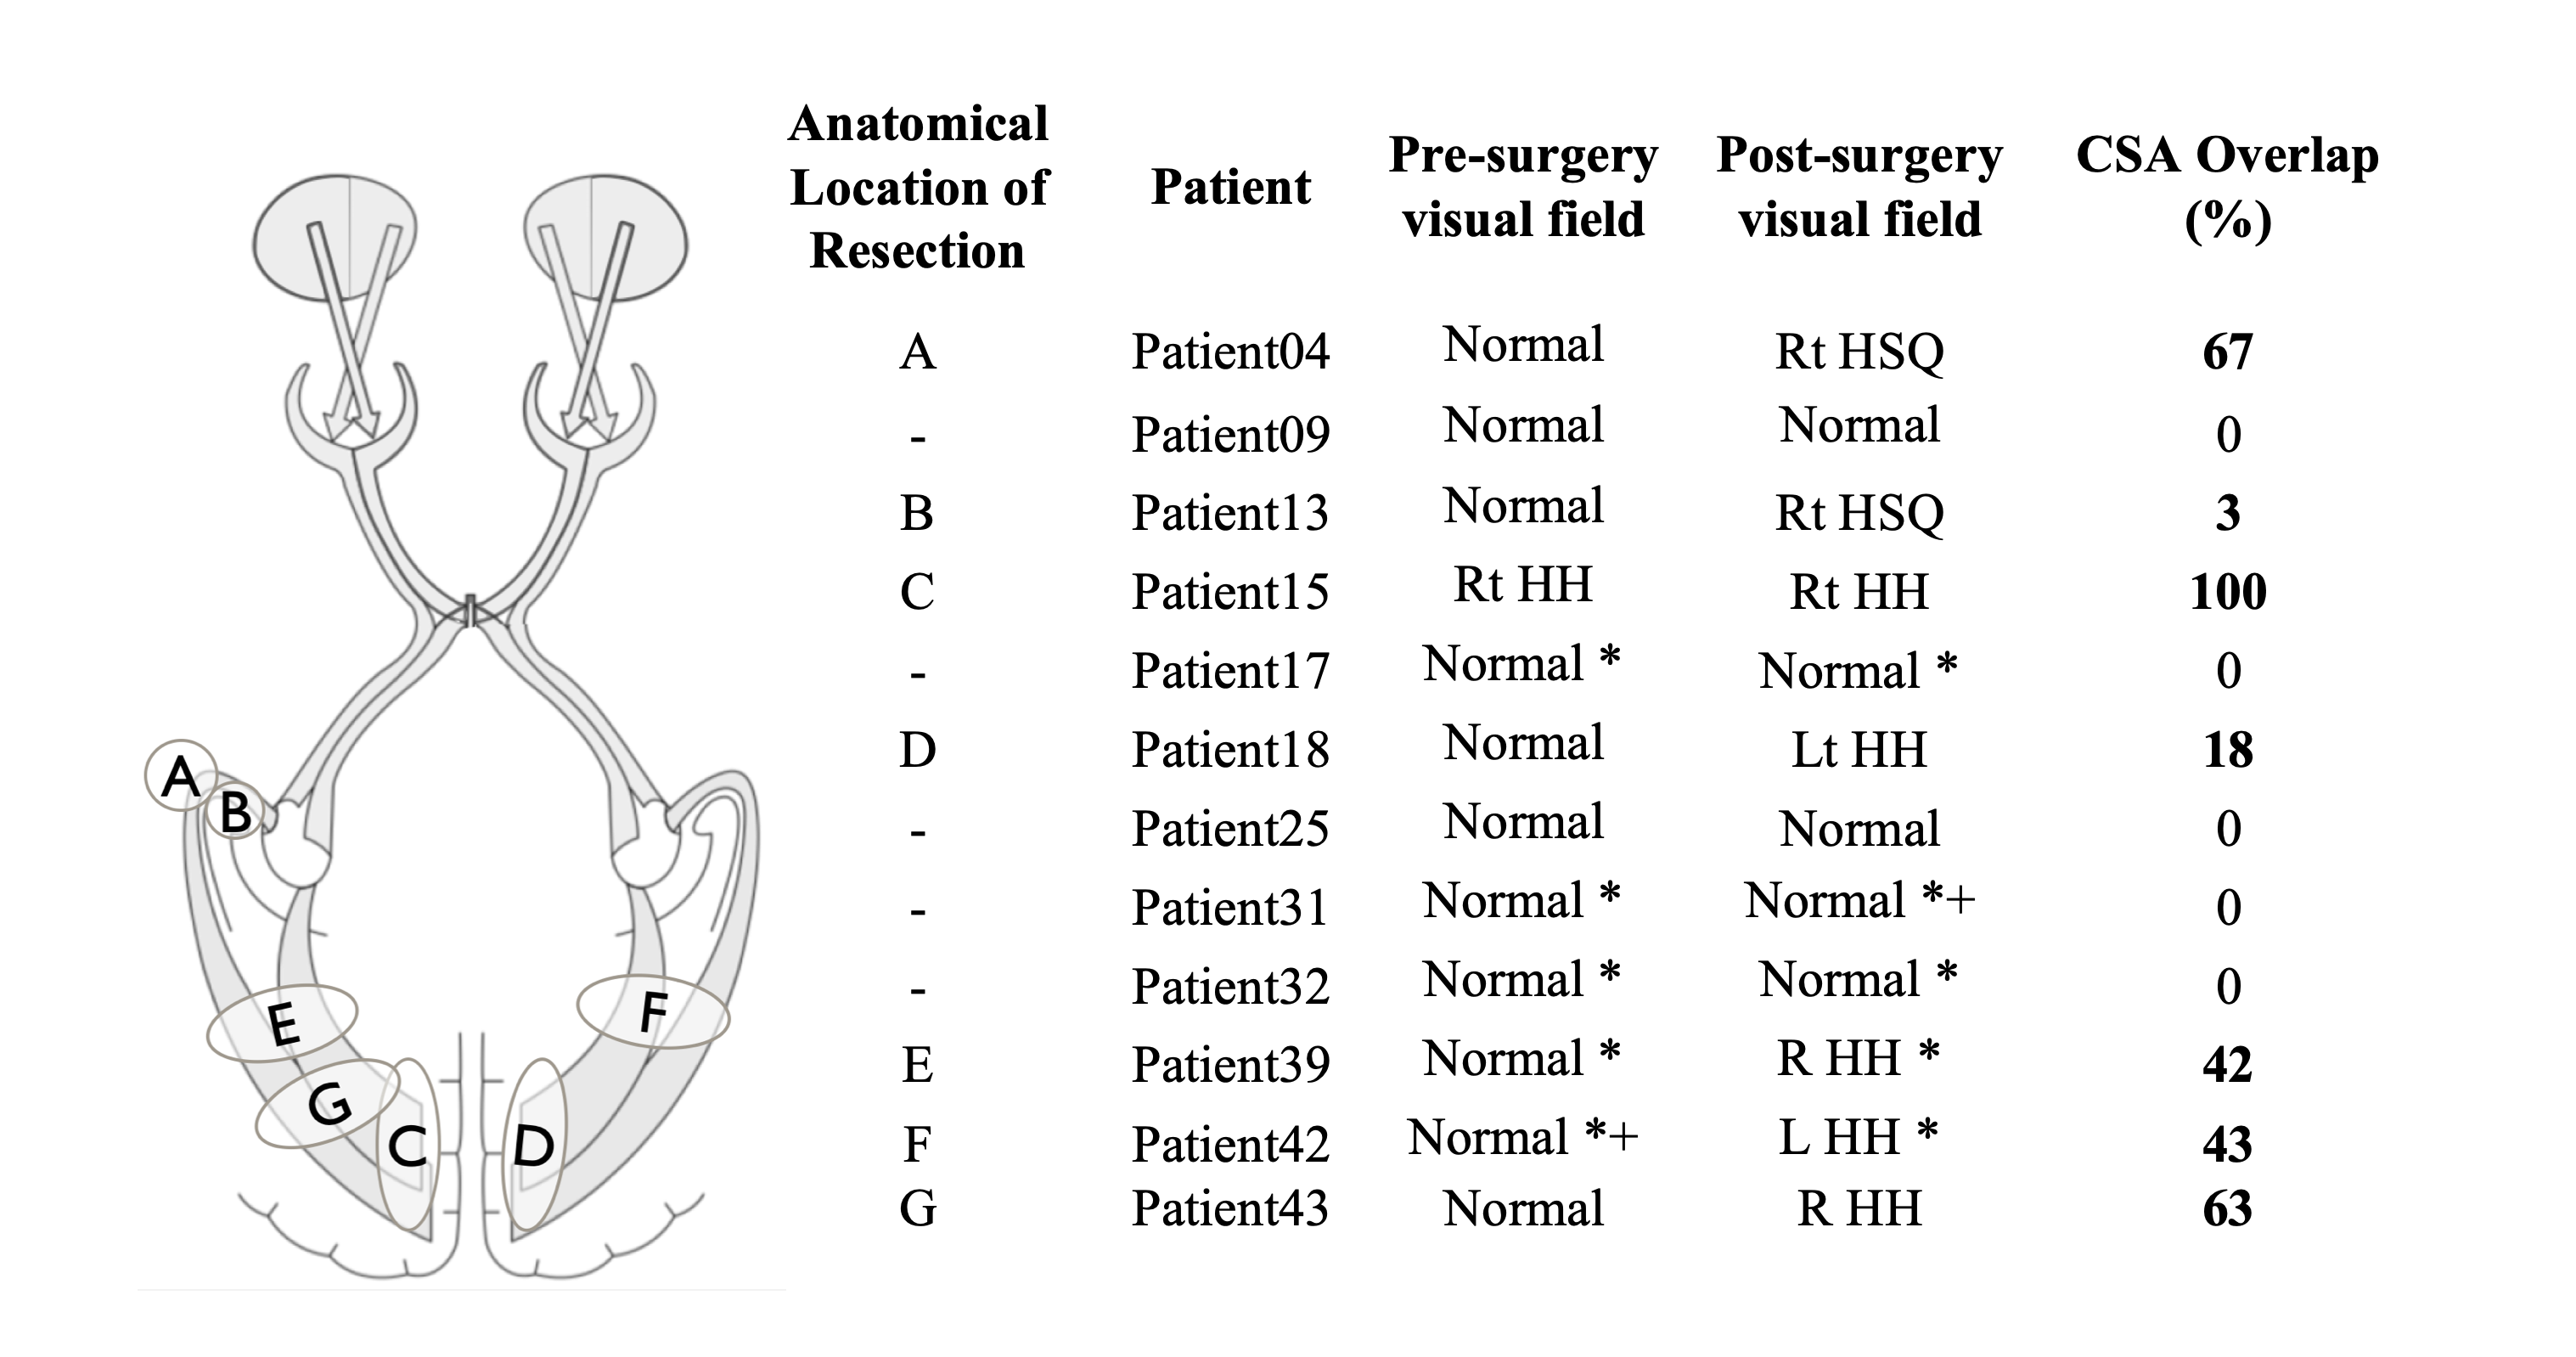
Data analysis: DWI data were denoised using MRtrix’s4 implementation of Veraart’s method5. Before DTI and SMT6 models were reconstructed, TOPUP and EDDY were used to correct for susceptibility distortions and to perform motion and eddy current correction7. Freesurfer8 was applied to pre-surgical structural images and the generated parcellations registered to diffusion space using ANTs9, which were used for tractography reconstructions(Figure 2) in both controls and patients (both hemispheres before surgery and the post-surgical contralateral hemisphere). Probability of anatomical connections maps were then derived from the reconstructed optic radiations and both DTI and SMT metrics extracted, namely Mean Diffusivity(MD), Axial Diffusivity(AD), Radial Diffusivity(RD), Fractional Anisotropy(FA) and Microscopic Mean Diffusivity (μMD), Longitudinal Microscopic Diffusivity(Long), Transverse Microscopic Diffusivity(Trans), Microscopic Fractional Anisotropy(μFA), respectively. All metrics were then fitted to a mixed linear model (lme4 library in R - www.r-project.org) with age, gender, group (patient/control) and timepoint (baseline/after surgery) as fixed effects, and subject-specific intercepts and hemisphere terms as random effects. The package lmerTest was used to evaluate significant effects found with the fitted model. Finally, probability of anatomical connections maps were registered to post-surgical space, and the cross-sectional area overlap (CSA) with the resection margin was quantified(Figure 3).
Results and Discussion
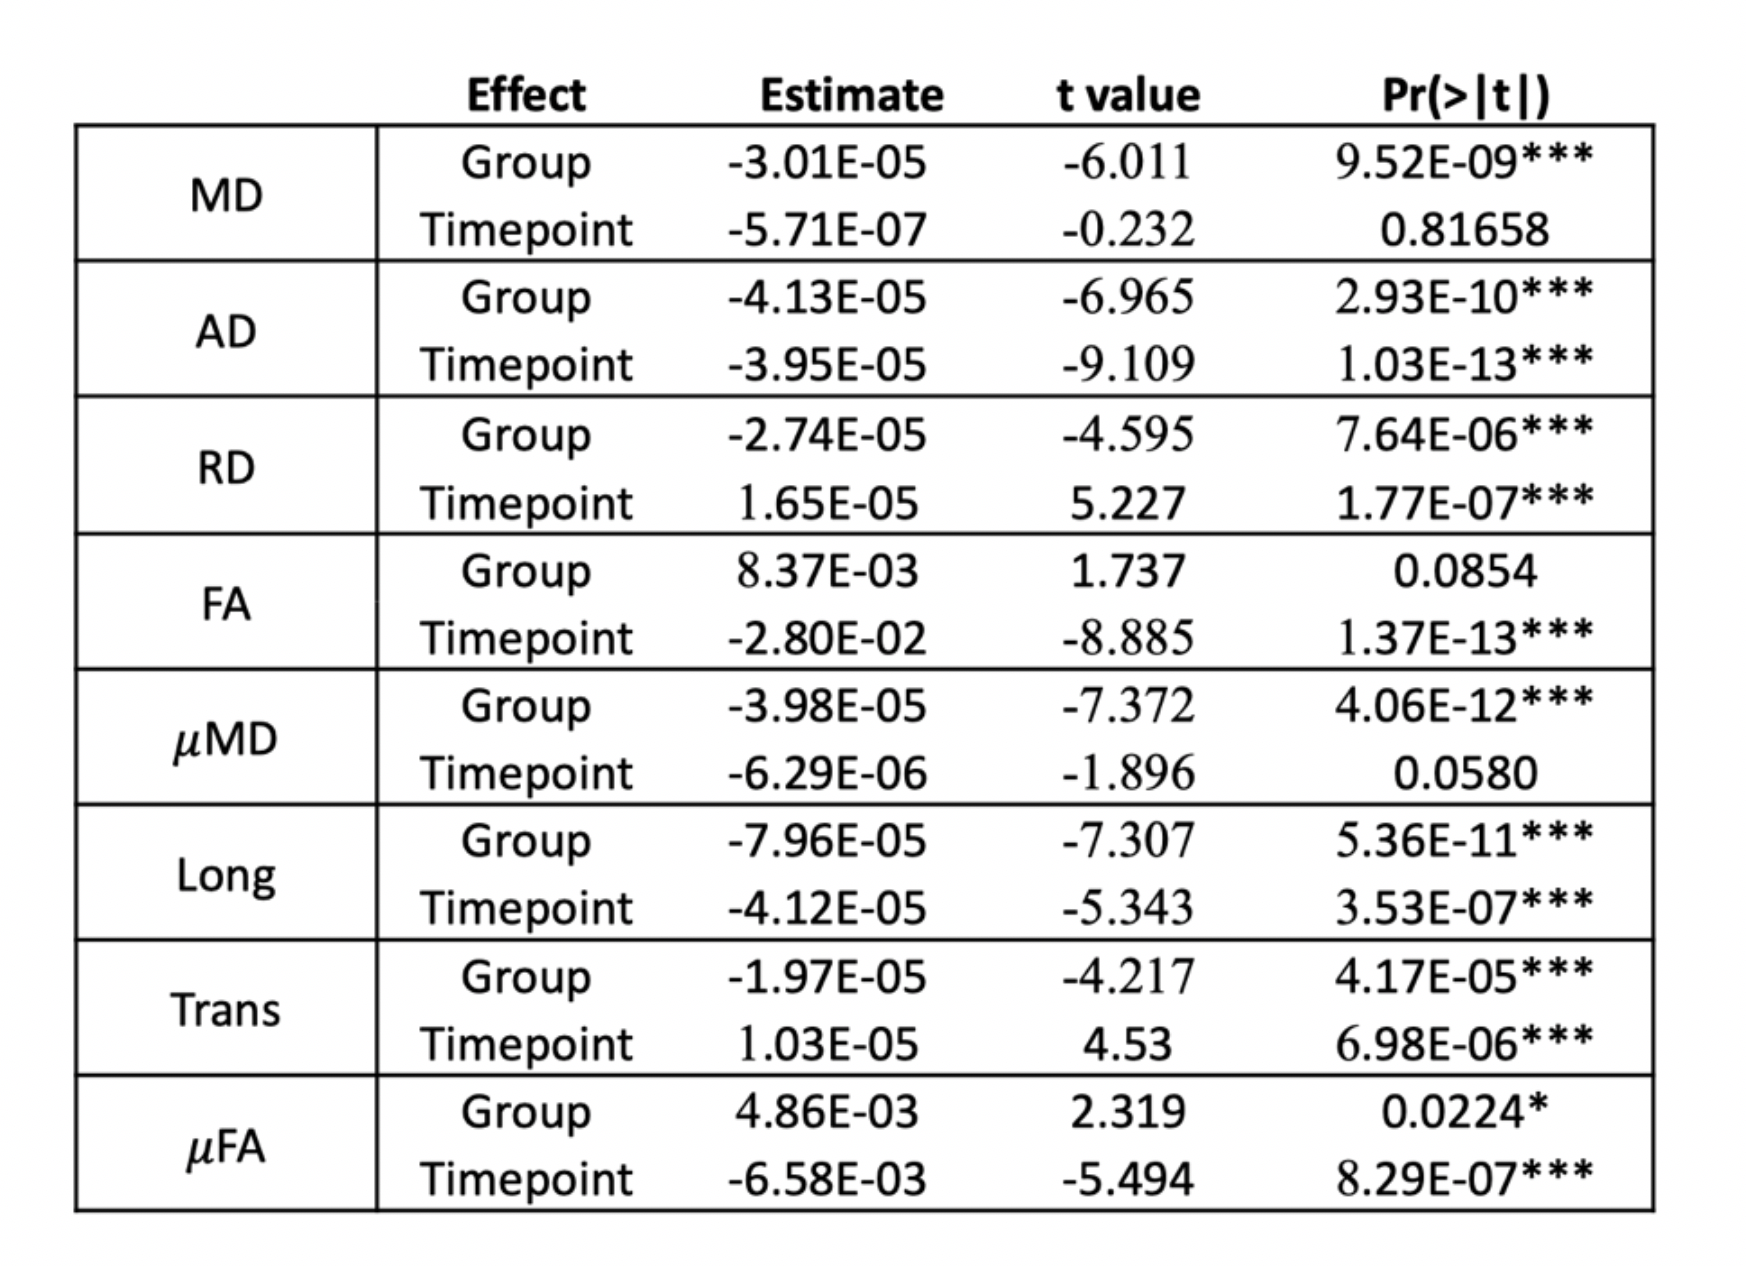
Pre-surgically, both DTI and SMT revealed significant increased diffusivity metrics in patients, with further significant anisotropy decrease detected by SMT. This is very likely explained by axonal loss, altered myelination patterns and increase in extracellular fluid. After surgery, we observed a decrease in AD, MD and FA while RD increased; we also found a decrease in μMD, Long and μFA and increase in Trans(Figure 4). Possible explanations include overall brain inflammation originated by epileptic activity, which is reduced after surgery and leads to a decrease in overall diffusivity metrics and/or recruitment of glial cells, i.e., proliferation of isotropically shaped cells. Tractography showed overlap between the pre-surgical optic radiation and post-surgical resection margin on 20/43 children. Furthermore, overlap corresponded to abnormal post-surgical visual function following normal pre-surgical evaluation for every patient where visual scores were available both before and after surgery(Figure 5).Conclusion
We successfully performed a thorough visual pathway investigation of children undergoing epilepsy surgery using multi-shell diffusion imaging. In particular, we applied the SMT model, in parallel to DTI, having found decreased anisotropy and increased diffusivity in patients when compared to controls. Furthermore, we observed evidence of contralateral changes in patients and evaluated the overlap of pre-surgical optic radiations with the resected area after surgery, which were involved in 46% of cases. These findings reflect the broader and more diverse pathological and neuro-anatomical involvement that occurs in children and the importance of tractography and multi-shell diffusion imaging for neurosurgical planning and detection of microstructural changes in epilepsy.Acknowledgements
This research/study/project was funded by Fight for Sight and supported by the National Institute for Health Research Biomedical Research Centre at Great Ormond Street Hospital for Children NHS Foundation Trust and University College London. GOSH BRC. G.Winston additionally acknowledges MRC (MR/M00841X/1).References
[1] J. S. Duncan, “Imaging the Brain’s Highways—Diffusion Tensor Imaging in Epilepsy,” Epilepsy Curr., vol. 8, no. 4, pp. 85–89, Jul. 2008.
[2] G. P. Winston, P. Daga, M. J. White, C. Micallef, A. Miserocchi, L. Mancini, M. Modat, J. Stretton, M. K. Sidhu, M. R. Symms, D. J. Lythgoe, J. Thornton, T. A. Yousry, S. Ourselin, J. S. Duncan, and A. W. McEvoy, “Preventing visual field deficits from neurosurgery.,” Neurology, vol. 83, no. 7, pp. 604–611, Aug. 2014.
[3] G. R. Salama, L. A. Heier, P. Patel, R. Ramakrishna, R. Magge, and A. J. Tsiouris, “Diffusion Weighted/Tensor Imaging, Functional MRI and Perfusion Weighted Imaging in Glioblastoma—Foundations and Future,” Front. Neurol., vol. 8, Jan. 2018.
[4] J.-D. Tournier, F. Calamante, and A. Connelly, “MRtrix: Diffusion tractography in crossing fiber regions,” Int. J. Imaging Syst. Technol., vol. 22, no. 1, pp. 53–66, Feb. 2012.
[5] J. Veraart, D. S. Novikov, D. Christiaens, B. Ades-Aron, J. Sijbers, and E. Fieremans, “Denoising of diffusion MRI using random matrix theory.,” NeuroImage, vol. 142, pp. 394–406, Nov. 2016.
[6] E. Kaden, N. D. Kelm, R. P. Carson, M. D. Does, and D. C. Alexander, “Multi-compartment microscopic diffusion imaging,” Neuroimage, vol. 139, pp. 346–359, Oct. 2016.
[7] J. L. R. Andersson and S. N. Sotiropoulos, “An integrated approach to correction for off-resonance effects and subject movement in diffusion MR imaging.,” NeuroImage, vol. 125, pp. 1063–1078, Jan. 2016.
[8] B. Fischl, “FreeSurfer,” NeuroImage, pp. 1–8, Feb. 2012.
[9] B. B. Avants, N. J. Tustison, M. Stauffer, G. Song, B. Wu, and J. C. Gee, “The Insight ToolKit image registration framework.,” Front. Neuroinform., vol. 8, no. 52, p. 44, 2014.
Figures