0230
Longitudinal Changes of the Extremely Preterm Brain from Age 10 to Age 15: Myelination and Hydration.1Mechanical Engineering, Boston University, Boston, MA, United States, 2Boston University Medical Center, Boston, MA, United States, 3University of North Carolina at Chapel Hill School of Medicine, Chapel Hill, NC, United States
Synopsis
Purpose: To identify new qMRI markers for assessing changes in hydration and myelination during development of the extremely preterm (EP) brain. Methods: Quantitative MR algorithms create maps of the transverse relaxation time (T2) and normalized proton density (PD) for 7 EP born individuals using MR images obtained at age 10 and age 15 years. Results: White and grey matter of the EP brain demonstrate increases in proton density and significant decreases in tissue T2. Conclusion: Decreases in T2 potentially describes the evolution of a more myelin rich environment with age, motivating a new method to assess myelination during brain development.
Purpose
Children born extremely preterm (EP) (gestational age < 28 weeks) remain at an elevated risk of neurological disability due in part to perinatal infection and systemic inflammation, which may induce altered central nervous system architecture throughout aging (1). Development of the white matter pathways and cortical grey matter has previously been characterized in healthy subjects spanning childhood to adulthood; however, these diffusion tensor imaging (DTI) studies do not account for development in the EP brain. Characteristically, DTI estimates increasing myelination and axon diameter during brain development via fractional anisotropy and mean diffusivity (2); however there is a lack of specificity for myelin, which has been more accurately attributed to the transverse relaxation time (T2), which is accounted for in myelin water fraction calculations (3,4). In this study, the longitudinal changes in PD and T2, as measures of tissue hydration and myelin content, will be quantified on a subcohort of the Extremely Low Gestational Age Newborn (ELGAN) study from age 10 to age 15, using multispectral quantitative MRI. The purpose of this study is to provide new qMRI markers of hydration and myelination changes in the EP brain.Materials and Methods
This study was approved by the Institutional Review Boards of the 12 participating institutions of the ELGAN study. A pilot cohort of seven extremely preterm born individuals at ages 9-11 and ages 14-16 were scanned with a 3T MRI protocol using the dual echo turbo spin echo pulse sequence. At age 9-11 scan parameters were TE1&2eff of 6.3ms and 107ms, and TR of 11s, while at ages 14-16 they were TE1&2eff of 12ms and 102ms, and TR of 10s. Multispectral qMRI and dual-clustering segmentation algorithms were developed with Python 3.5 in the Canopy integrated development environment (5,6), according to equations 1 & 2.Eq.1: $$T_{2} = \frac{abs(TE_{1eff} - TE_{2eff})}{abs(ln(\frac{pv_{E2}}{pv_{E1}}))}$$
E2. 2: $$PD = A_{cal}\times pv_{E1}\times e^\frac{TE_{1eff}}{T_{2}}$$
To ensure the data remained consistent, the pilot cohort was comprised only of subjects with no diagnosis of structural deformity and were free of neurological impairment, such as cerebral palsy, and major head trauma. Given the preservation of tissue integrity in the pilot cohort, average values of the entire white and grey matter were calculated for proton density and T2. Histograms of the outcomes were plotted to better elucidate changes in the distribution of hydration states and myelin composition within the tissue.
Results
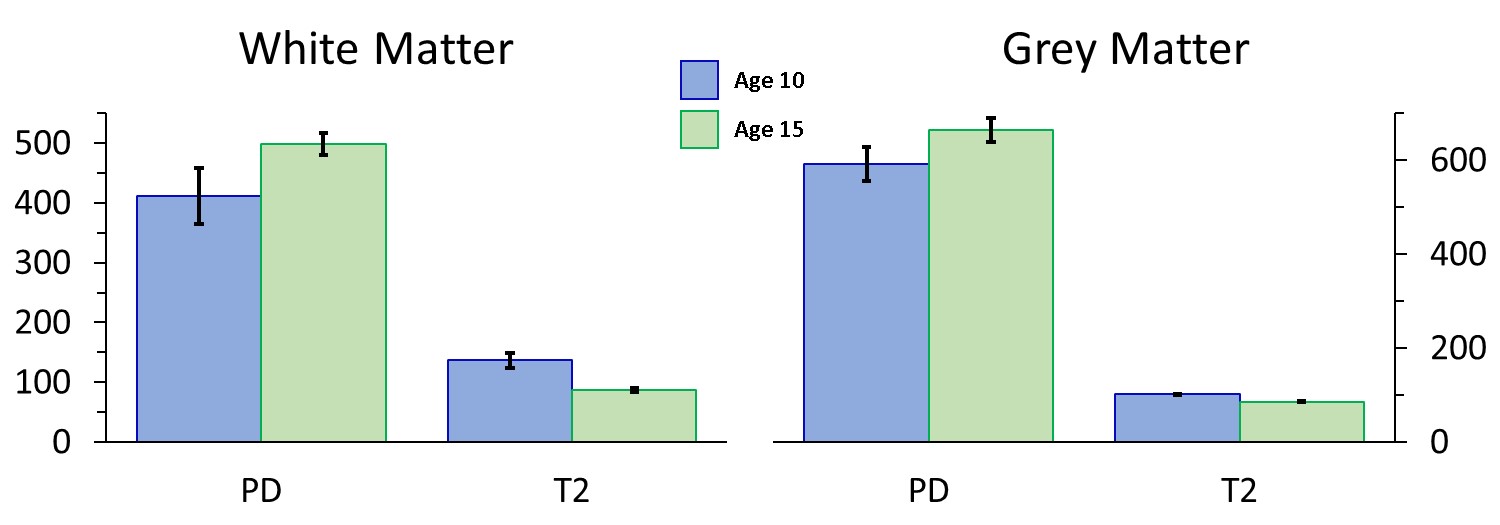
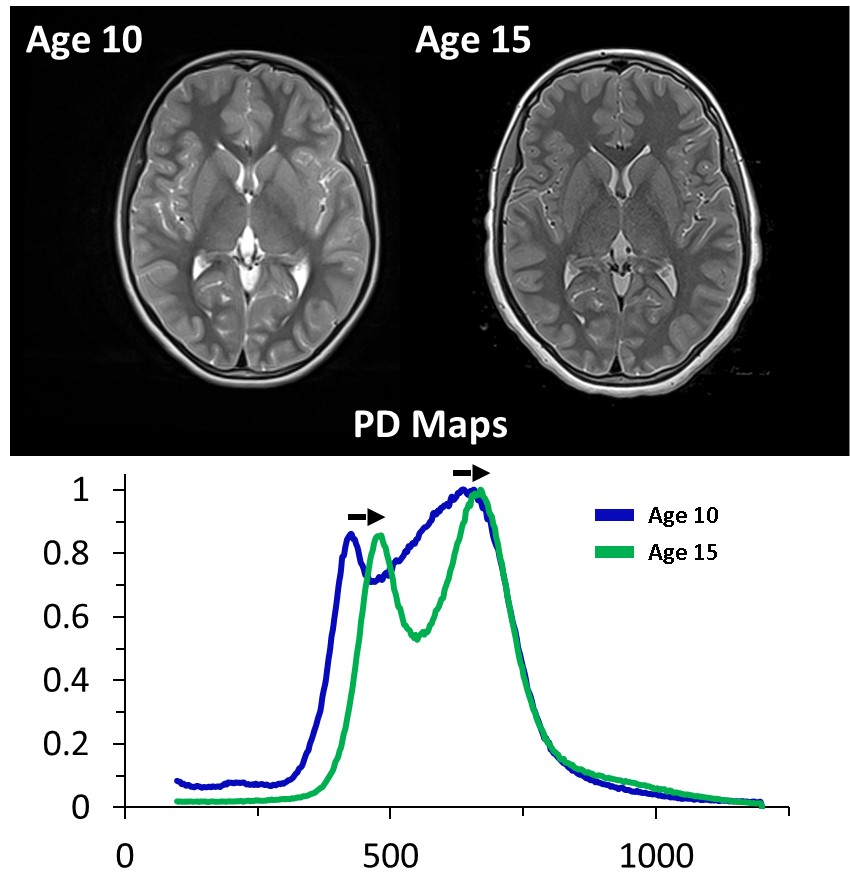
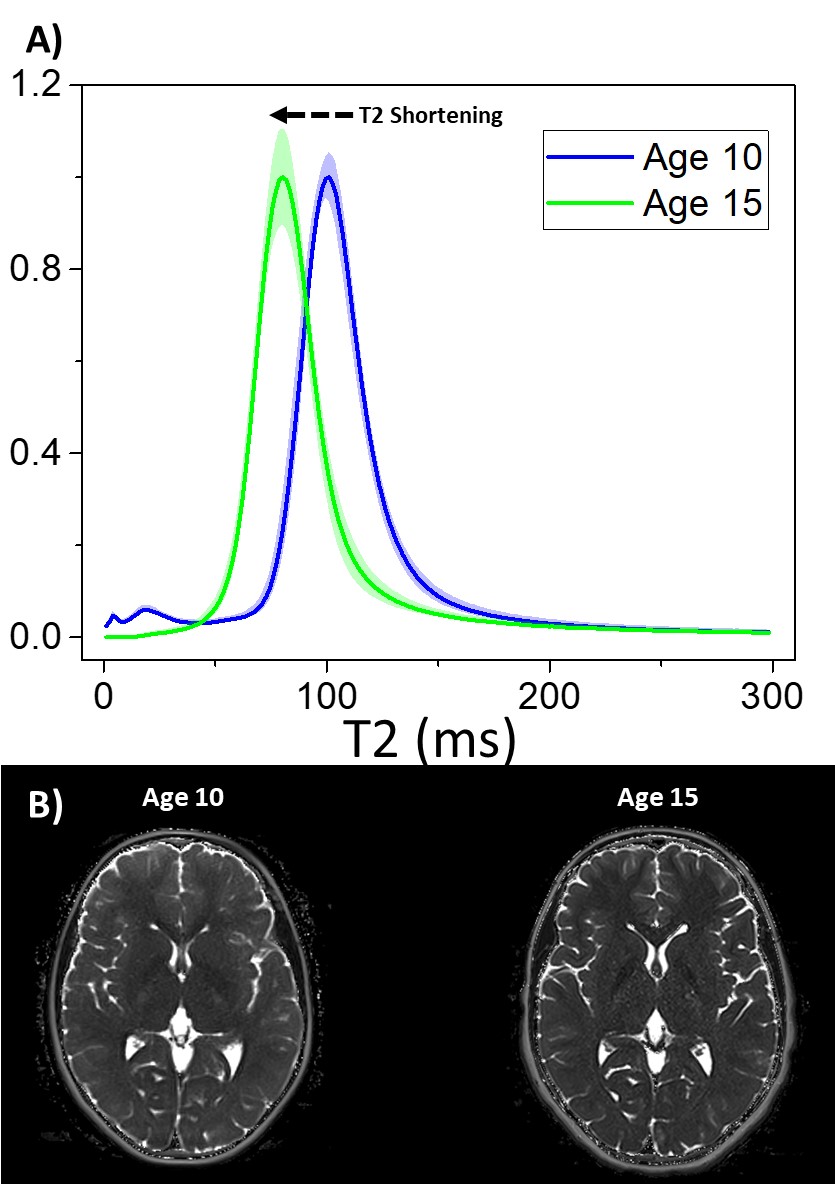
On average, the PD of white and grey matter increased between ages 10 and 15, while the T2 of both tissue types experiences a marked decrease (Figure 1). White matter was more susceptible with a 21.1% increase in PD and a 36.4% decrease in T2, over the whole tissue volume. Representative PD maps are shown in Figure 2, showing dramatic increases in hydration for the white matter peak of the distribution. The subcohort also exhibits Gaussian distributions of T2 (Figure 3A). The full width half maximum of the distribution at both ages is constant at 28.4ms. At age 10 a small peak exists at approximately 25ms, which agrees well with literature for myelin T2.Discussion and Conclusions
Quantitative analysis of the transverse relaxation time of the EP born brain demonstrated shortening while hydration levels increased, providing a mechanism to gain insight into the new markers of development for those born extremely preterm. Decreases in the T2 of white and grey matter indicates a higher prevalence of the short T2 components in the brain microstructure. Given the shortest T2 component of the microstructure correspond to myelin (approximately 20ms), it is likely this decrease can be attributed to an increased volume of myelin within the brain tissue. It should be noted a small peak exists at age 10 in this regime. Upon inspection on the T2 maps this peak is likely due to noise in the tissue surrounding the intracranial matter, and not directly to myelin. This would explain the peak’s disappearance by age 15. Since this work is predominantly a pilot study, future work is required to demonstrate equivalence to the state of the art technique in myelin imaging, myelin water fraction. For example, this study focuses on bulk white and grey matter, which allows noise from T2 sensitivity to changes in the bulk water content and cholesterol, as well as myelin. It is possible the consistency in full width half maximum can be directly attributed to changes in the overall environment in addition to increased myelination. Through further investigation, isolation of purely myelin water via heavy R1 weighting and synthetic MR will be implemented to precisely calculate the alterations to myelination in the EP brain. This work could help further the understanding of the developmental pathways in the extremely preterm brain from age 10 to age 15.Acknowledgements
This work was supported in part by the National Institute of Neurological Disorders and Stroke (5U01NS040069-05 and 2R01NS040069-09), National Institutes of Health Office of the Director (1UG3OD022348-01), and the National Institute of Child Health and Human Development (5P30HD018655-28).References
1. O'Shea TM, Allred EN, Dammann O, et al. The ELGAN study of the brain and related disorders in extremely low gestational age newborns. Early Human Development 2009;85(11):719-725.
2. Lebel, C. and C. Beaulieu. Longitudinal development of human brain wiring continues from childhood into adulthood. Journal of Neuroscience 2011;31(30).
3. Deoni, S. C., et al. Investigating white matter development in infancy and early childhood using myelin water faction and relaxation time mapping. Neuroimage 2012;63(3).
4. Dean, D. C., et al. Characterizing longitudinal white matter development during early childhood. Brain Structure and Function 2015;220(4).
5. Jara, H. (2006). Synthetic images for a magnetic resonance imaging scanner using linear combinations of source images, Google Patents.
6. Suzuki, S., et al.. Combined volumetric T1, T2 and secular-T2 quantitative MRI of the brain: age-related global changes (preliminary results). Magnetic resonance imaging 2006;24(7).
Figures