0229
Uncovering regional maturation of axon diameter across child and adolescent brain development1Cardiff University Brain Research Imaging Centre (CUBRIC), Cardiff University, Cardiff, United Kingdom, 2Mary MacKillop Institute for Health Research, Australian Catholic University, Melbourne, Australia
Synopsis
The maturation of white matter across childhood and adolescence is predominantly driven by the thickening of myelin and increasing axon density. Previous post-mortem studies have suggested that axon count in the corpus callosum reaches adult levels in the early post-natal period, suggesting that the radial growth of axons may be driving the apparent increases in axon density. In this novel application of paediatric microstructural development, we estimate apparent axon diameter using ultra-strong gradient MRI (300 mT/m) for the first time. Our findings reveal age-related maturation of axon diameter in the genu and body of the corpus callosum.
Introduction
White matter development over childhood and adolescence is a dynamic period of brain maturation, governed by axonal and myelin growth. Whilst it is known that the myelin sheath thickens with age1, developmental trends of axonal growth are currently unknown. Post-mortem studies suggest that axon count in the corpus callosum stabilises in the early post-natal period2, followed by synchronised axon diameter growth and myelination3. Using diffusion magnetic resonance imaging (dMRI) we can only be sensitive to imaging markers of axon density, which increase across childhood and pubertal onset4. However, it is difficult to disentangle two factors which affect axon density – axon diameter and axon count.A large proportion of the brain is composed of small axons approximately 1-2μm in diameter5. However, the smallest axon diameter that most MR scanners can detect is 4μm or bigger6. Recent advances in imaging technology allow us to get much closer to resolving smaller axon diameters7.
This novel in vivo application of axon diameter estimation in children and adolescents combined with the very latest in MRI gradient hardware (300 mT/m) is a first look into how axonal morphology can vary with age.
Methods
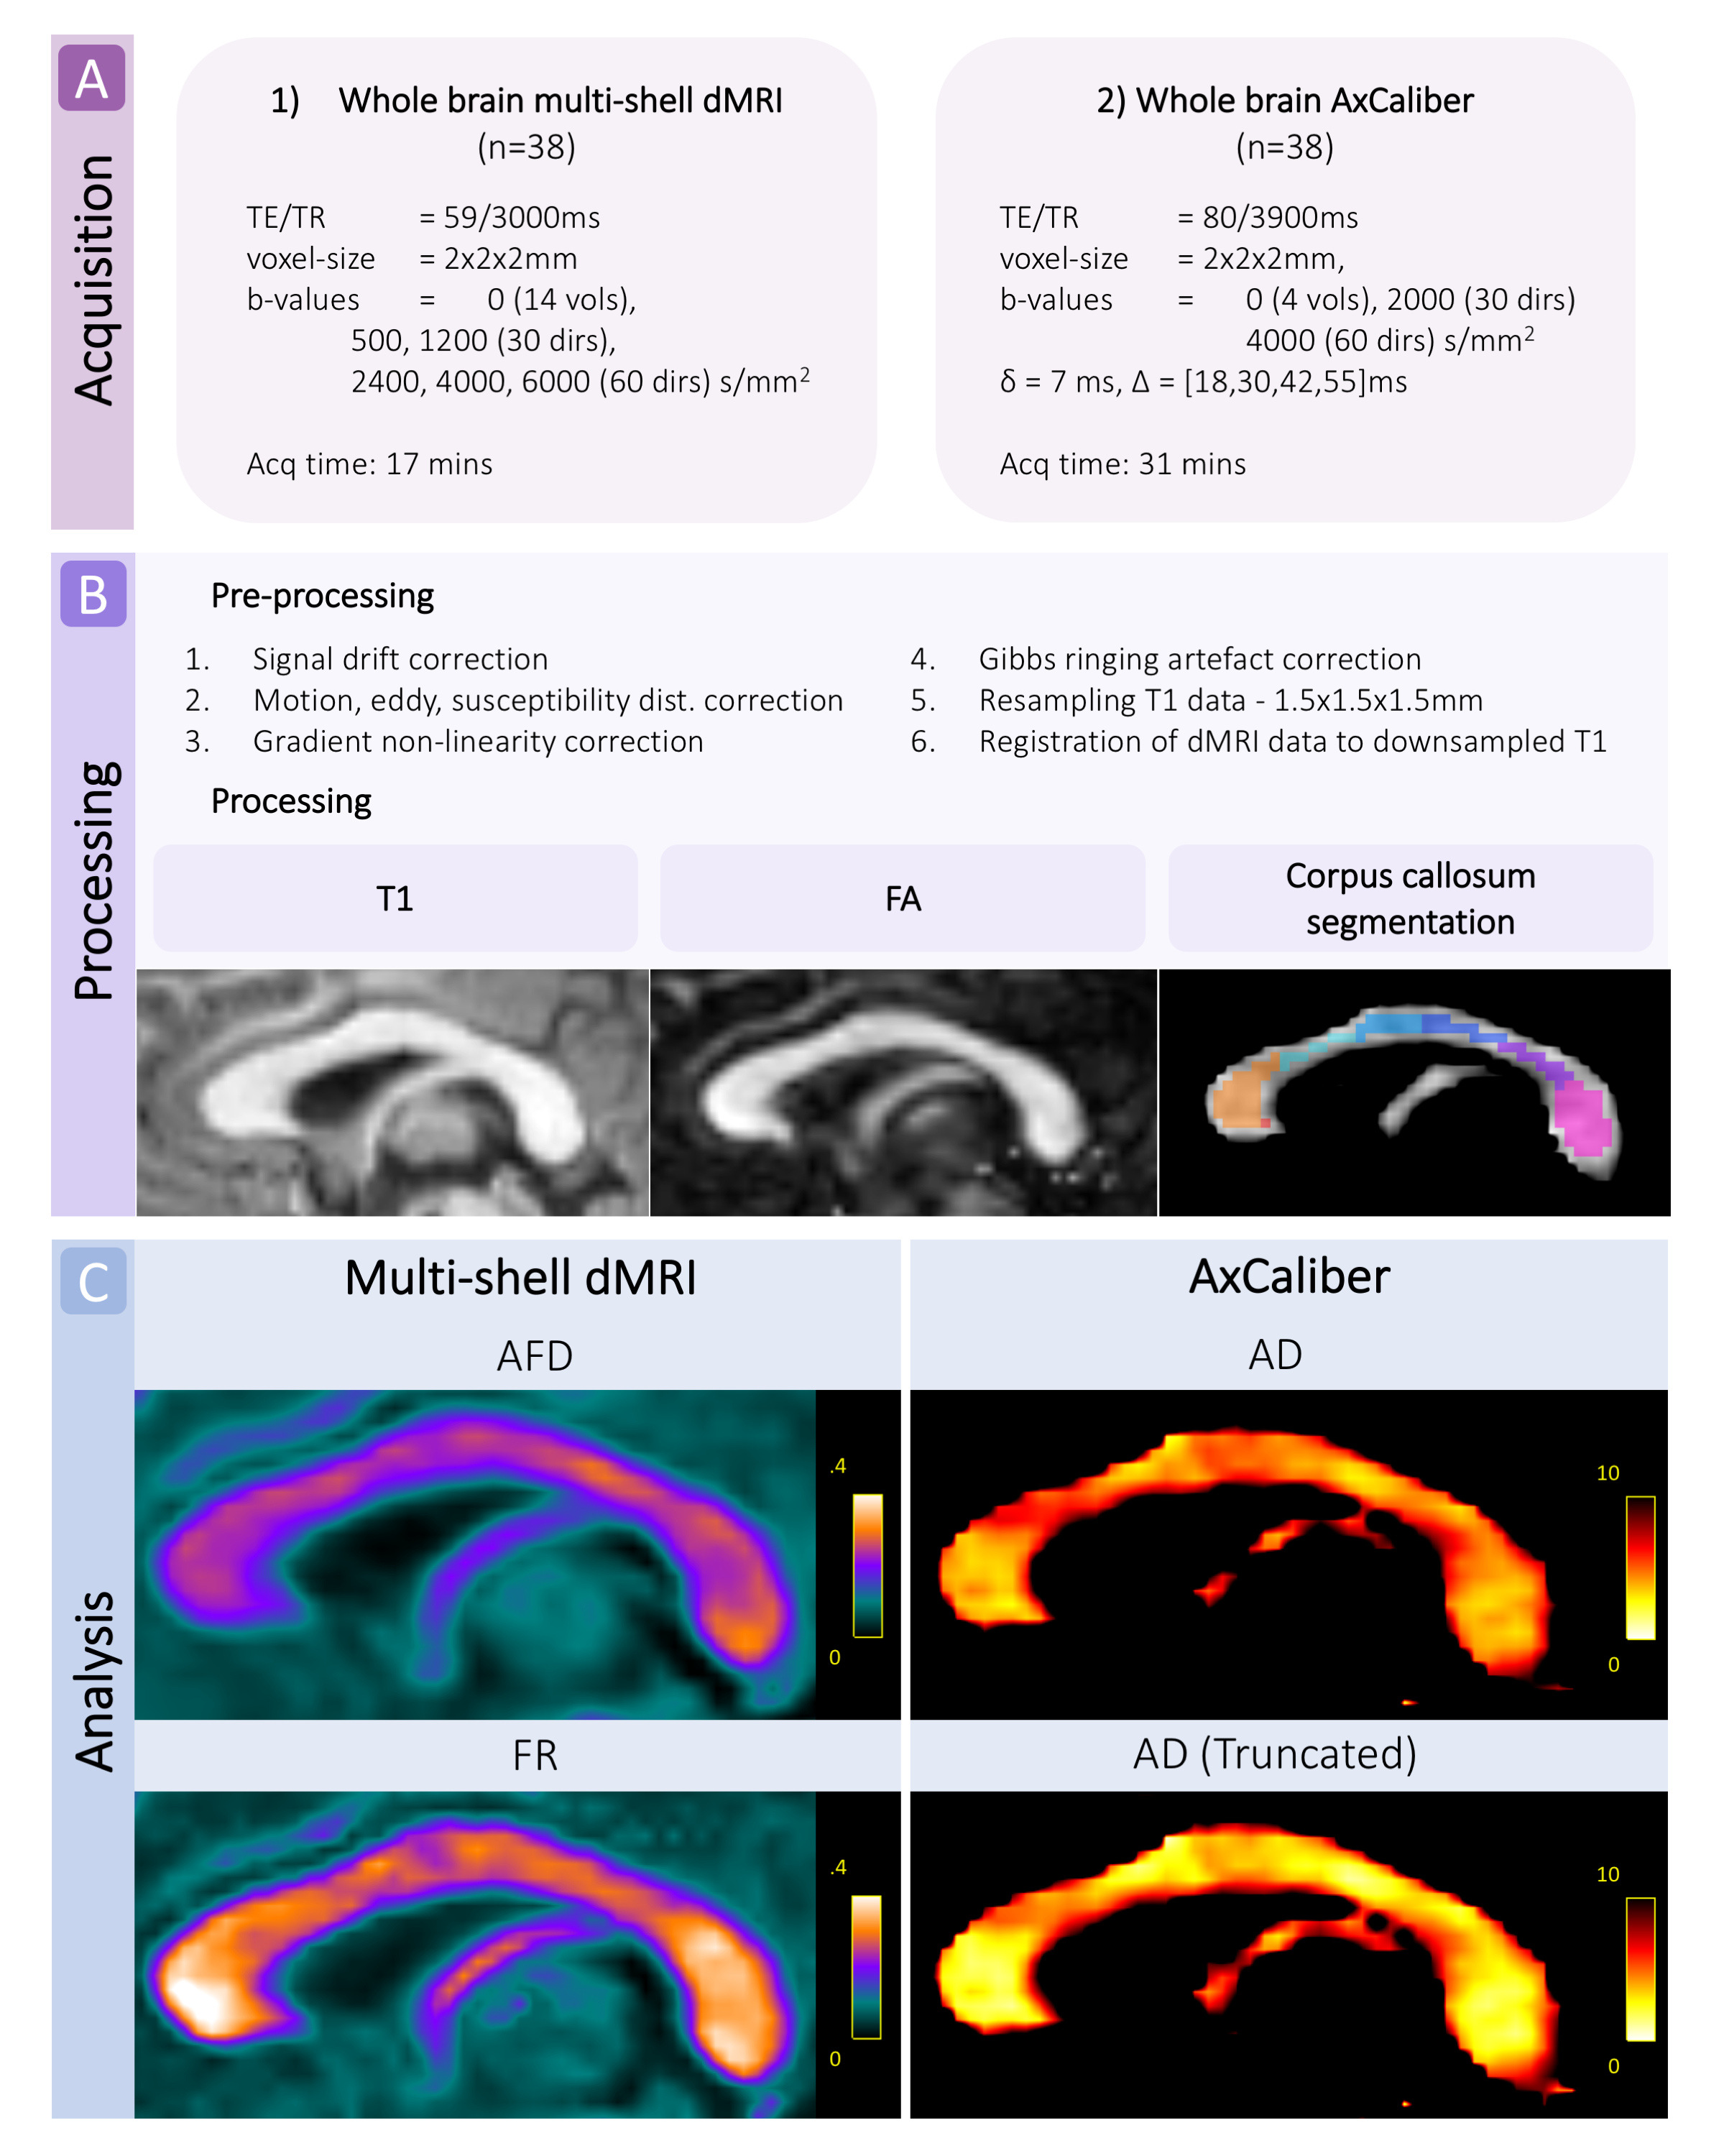
Acquisition and pre-processingWe scanned 38 typically developing children (25 female) aged 8-18 years on a 3.0T Siemens Connectom system with ultra-strong (300mT/m) gradients. Two multi-shell diffusion-weighted imaging acquisitions were collected ranging from b=0-6000 s/mm2. Full details of the acquisition protocol are in Figure 1. Data were acquired in an anterior-posterior (AP) phase-encoding direction, with two additional PA volumes. Pre-processing involved: correction for signal drift8; motion, eddy, and susceptibility-induced distortions9; gradient non-linearities10,11; and Gibbs ringing artefact12. All diffusion data were then registered to a skull-stripped structural T1-weighted image using EPIREG9.
Processing and analysis
Data were fitted to the CHARMED13 and AxCaliber models14 using MDT15. Apparent axon diameter (AD) was modelled by a continuous Poisson distribution with a time-dependent zeppelin modelling the extra-cellular space16, using both the full and truncated17 distributions. Measures of fractional anisotropy (FA), apparent fibre density (AFD), and restricted volume fraction (FR) were estimated from the whole-brain multi-shell dMRI data.
The corpus callosum was manually segmented into 7 regions (R: rostrum; G: genu; B1: anterior body; B2: mid body; B3: posterior body; ISTH: isthmus; S: splenium) on a template18, transformed to subject-specific maps, and manually edited to exclude voxels with partial voluming (Fig 1). Of the 38 cases, 7 were excluded owing to motion artefact. Multiple linear models were computed within R (v3.4.3) to test the relationship between AD and age for each corpus callosum segment, with sex and motion parameters included as covariates. The best fitting model for each region was chosen based on lowest Akaike information criterion (AIC).
Results
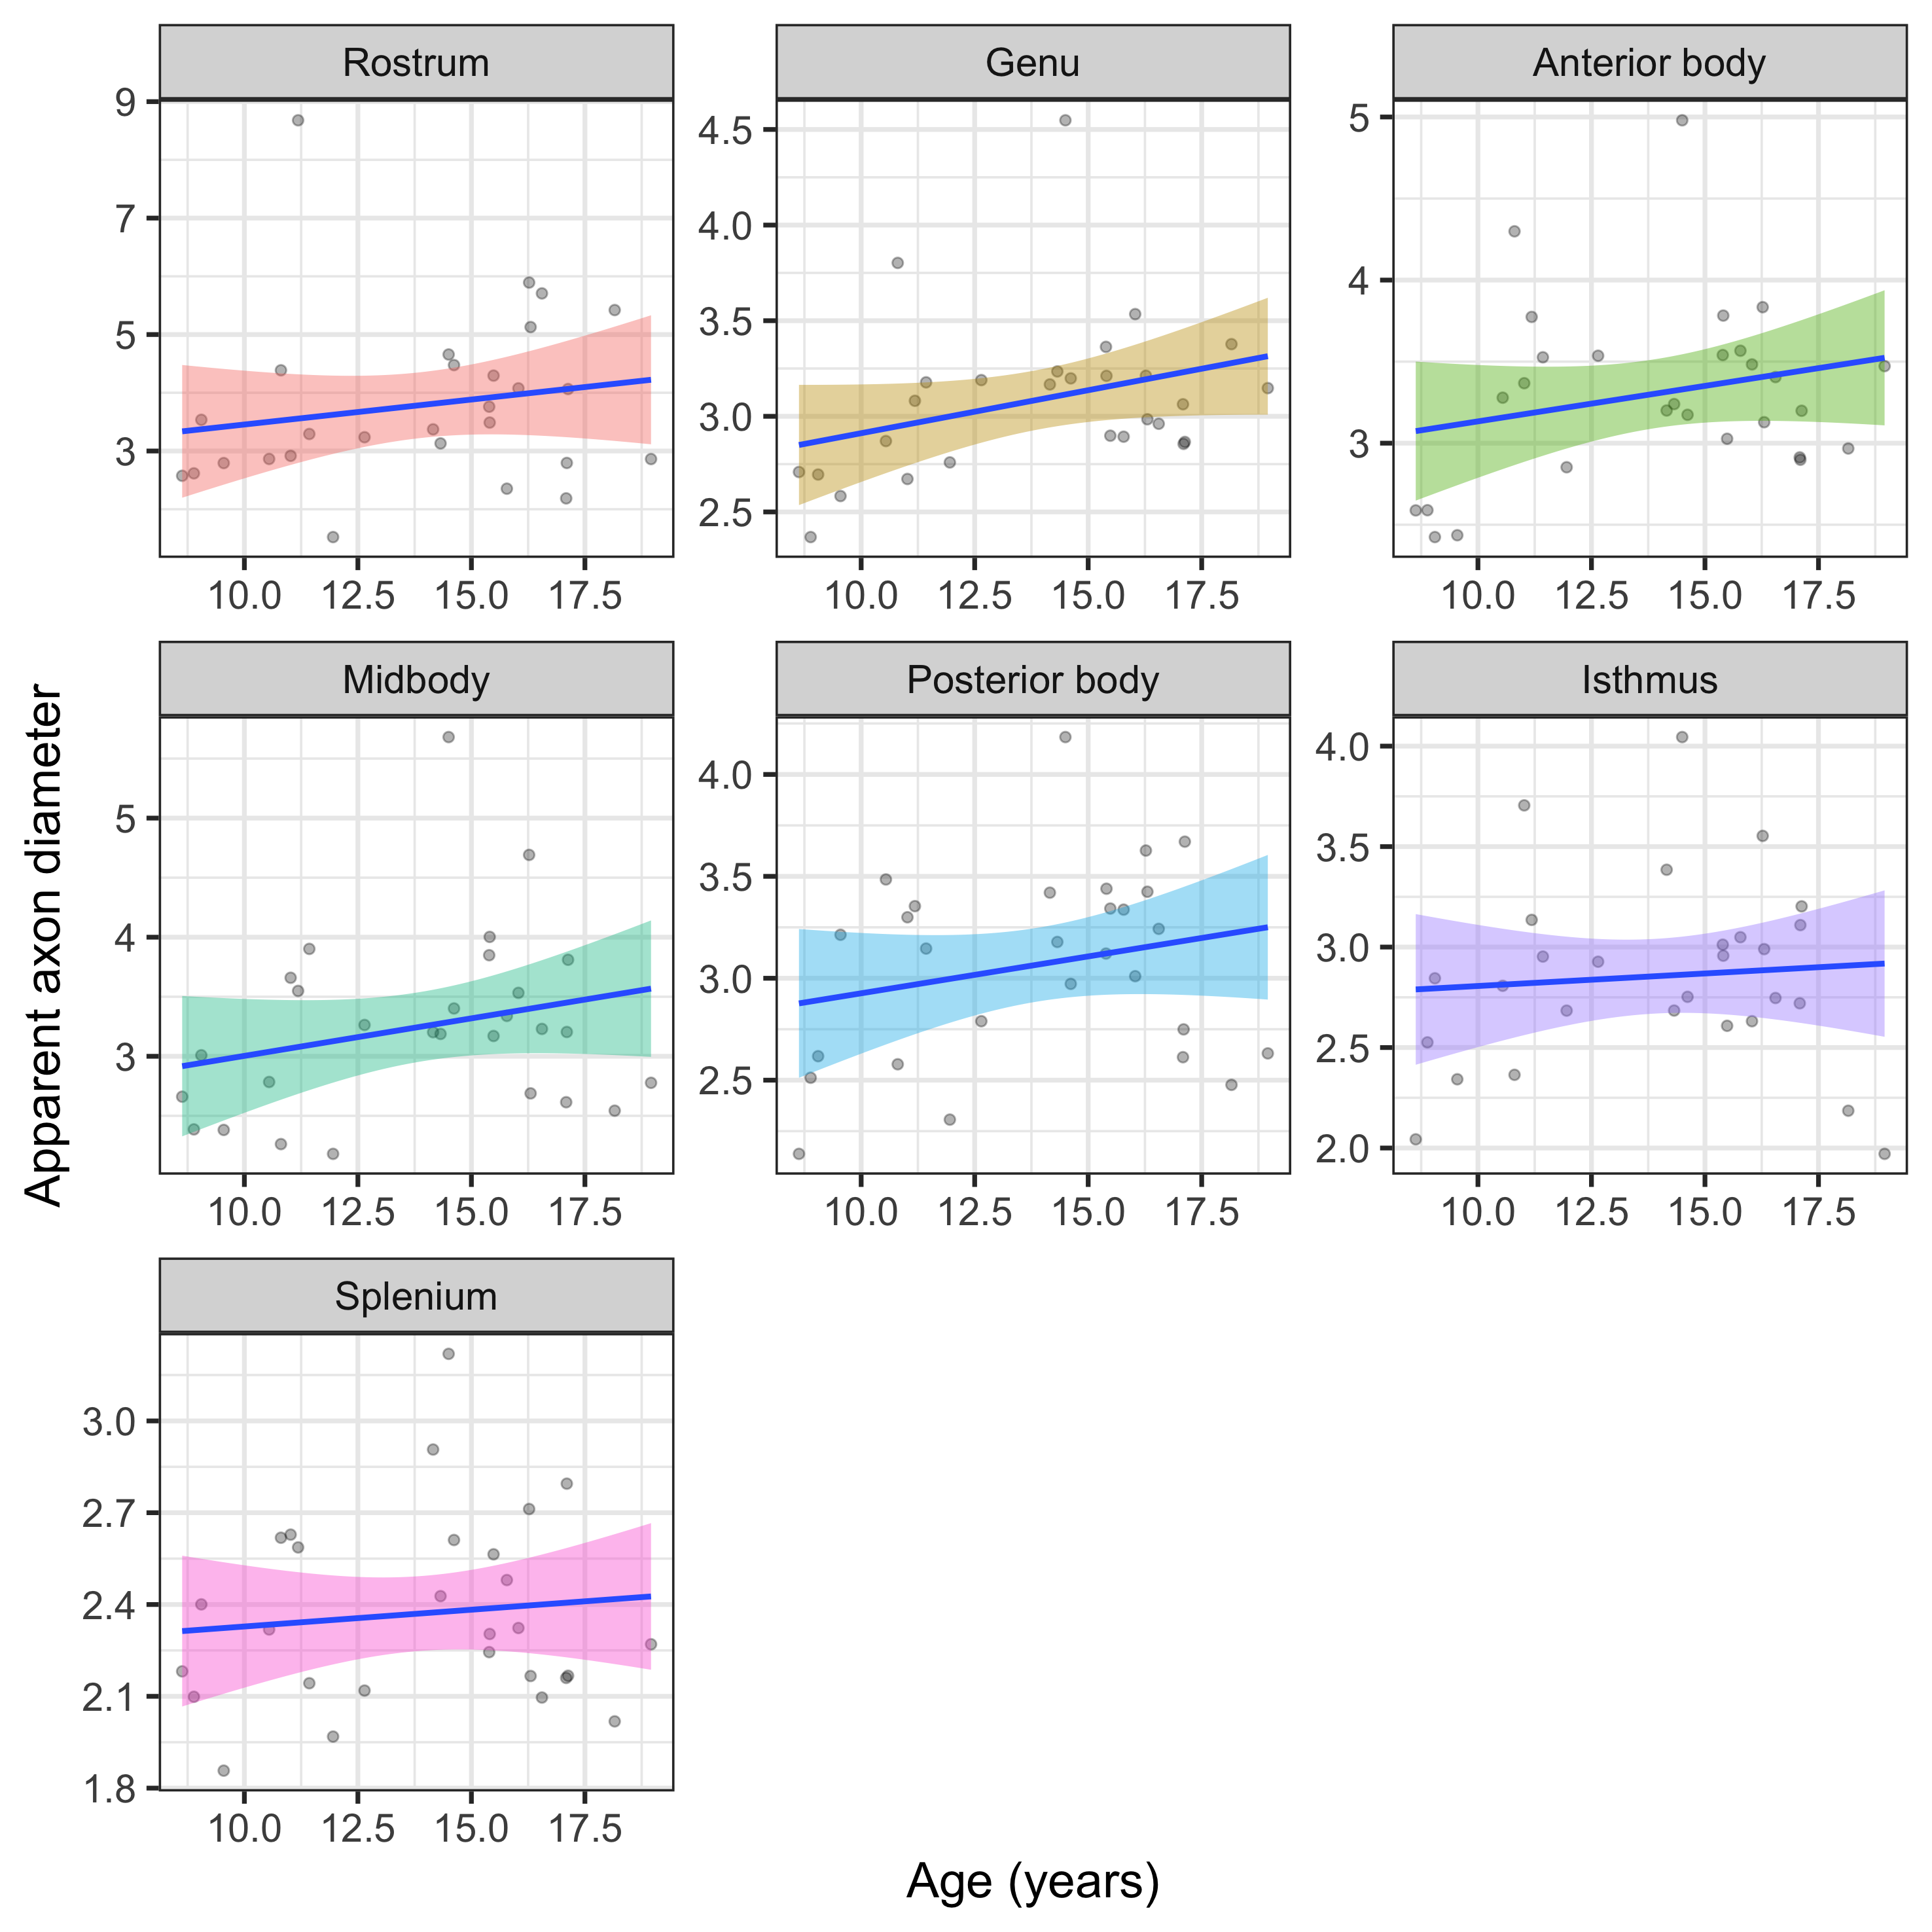
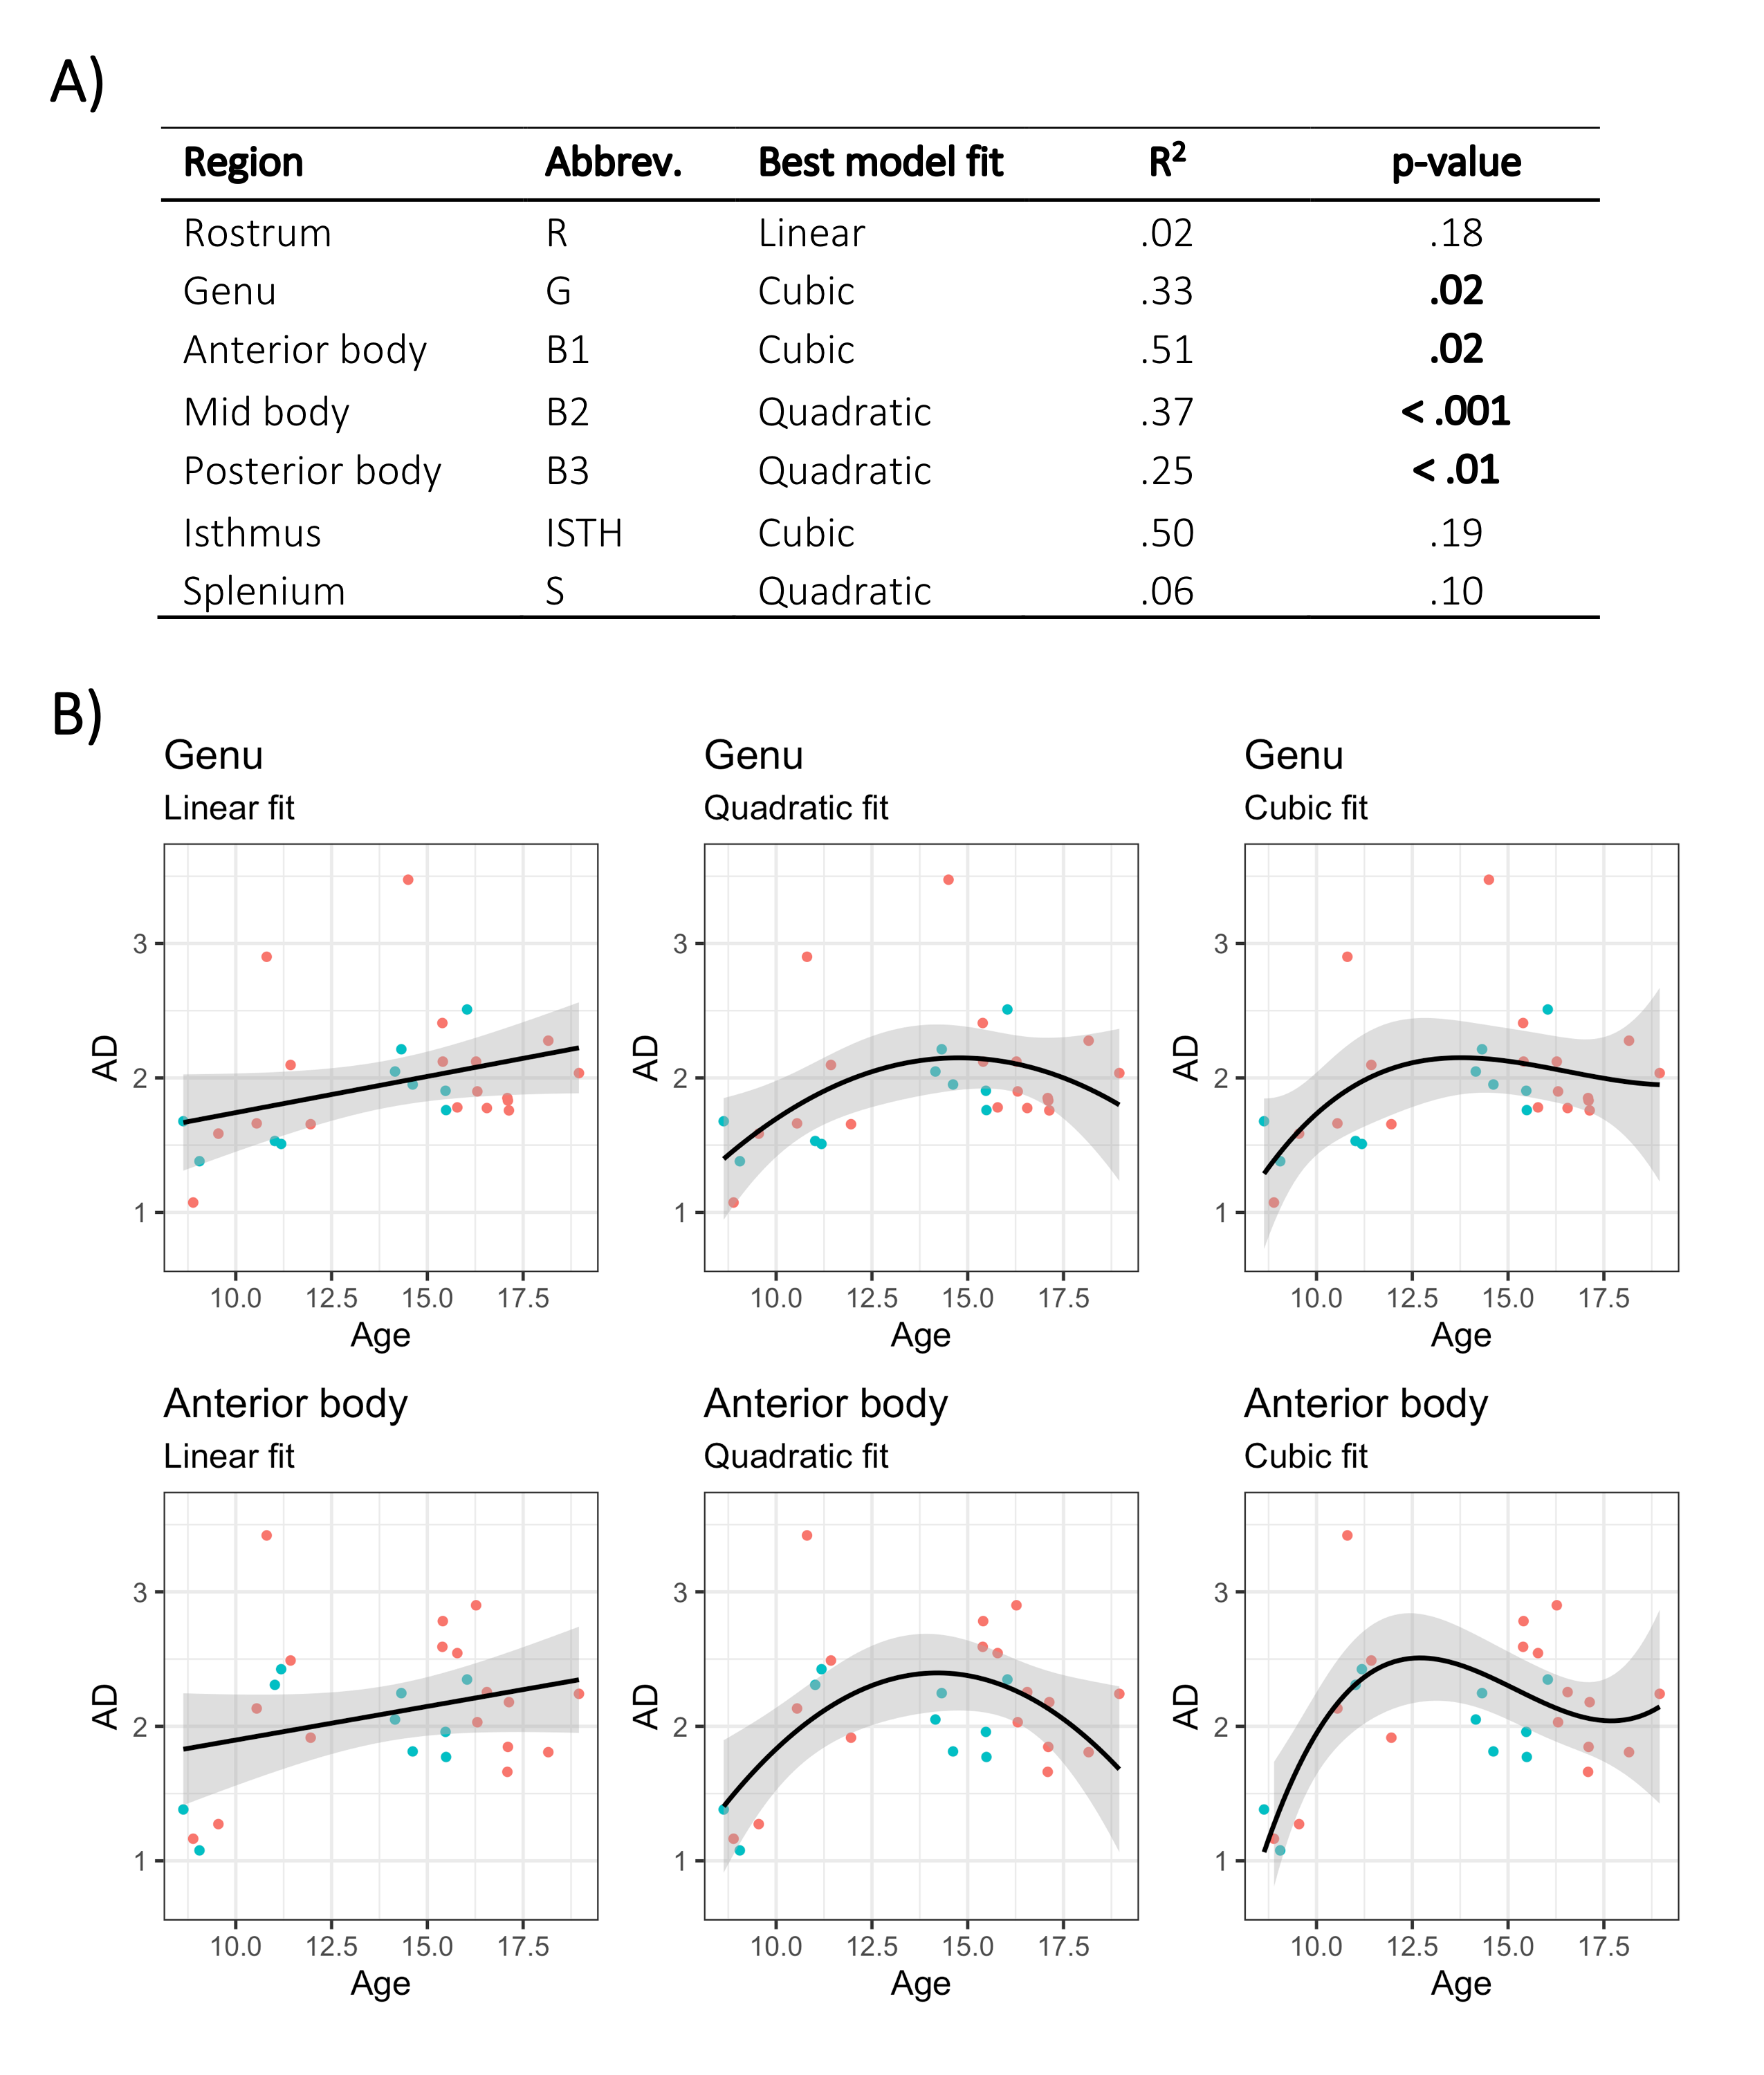
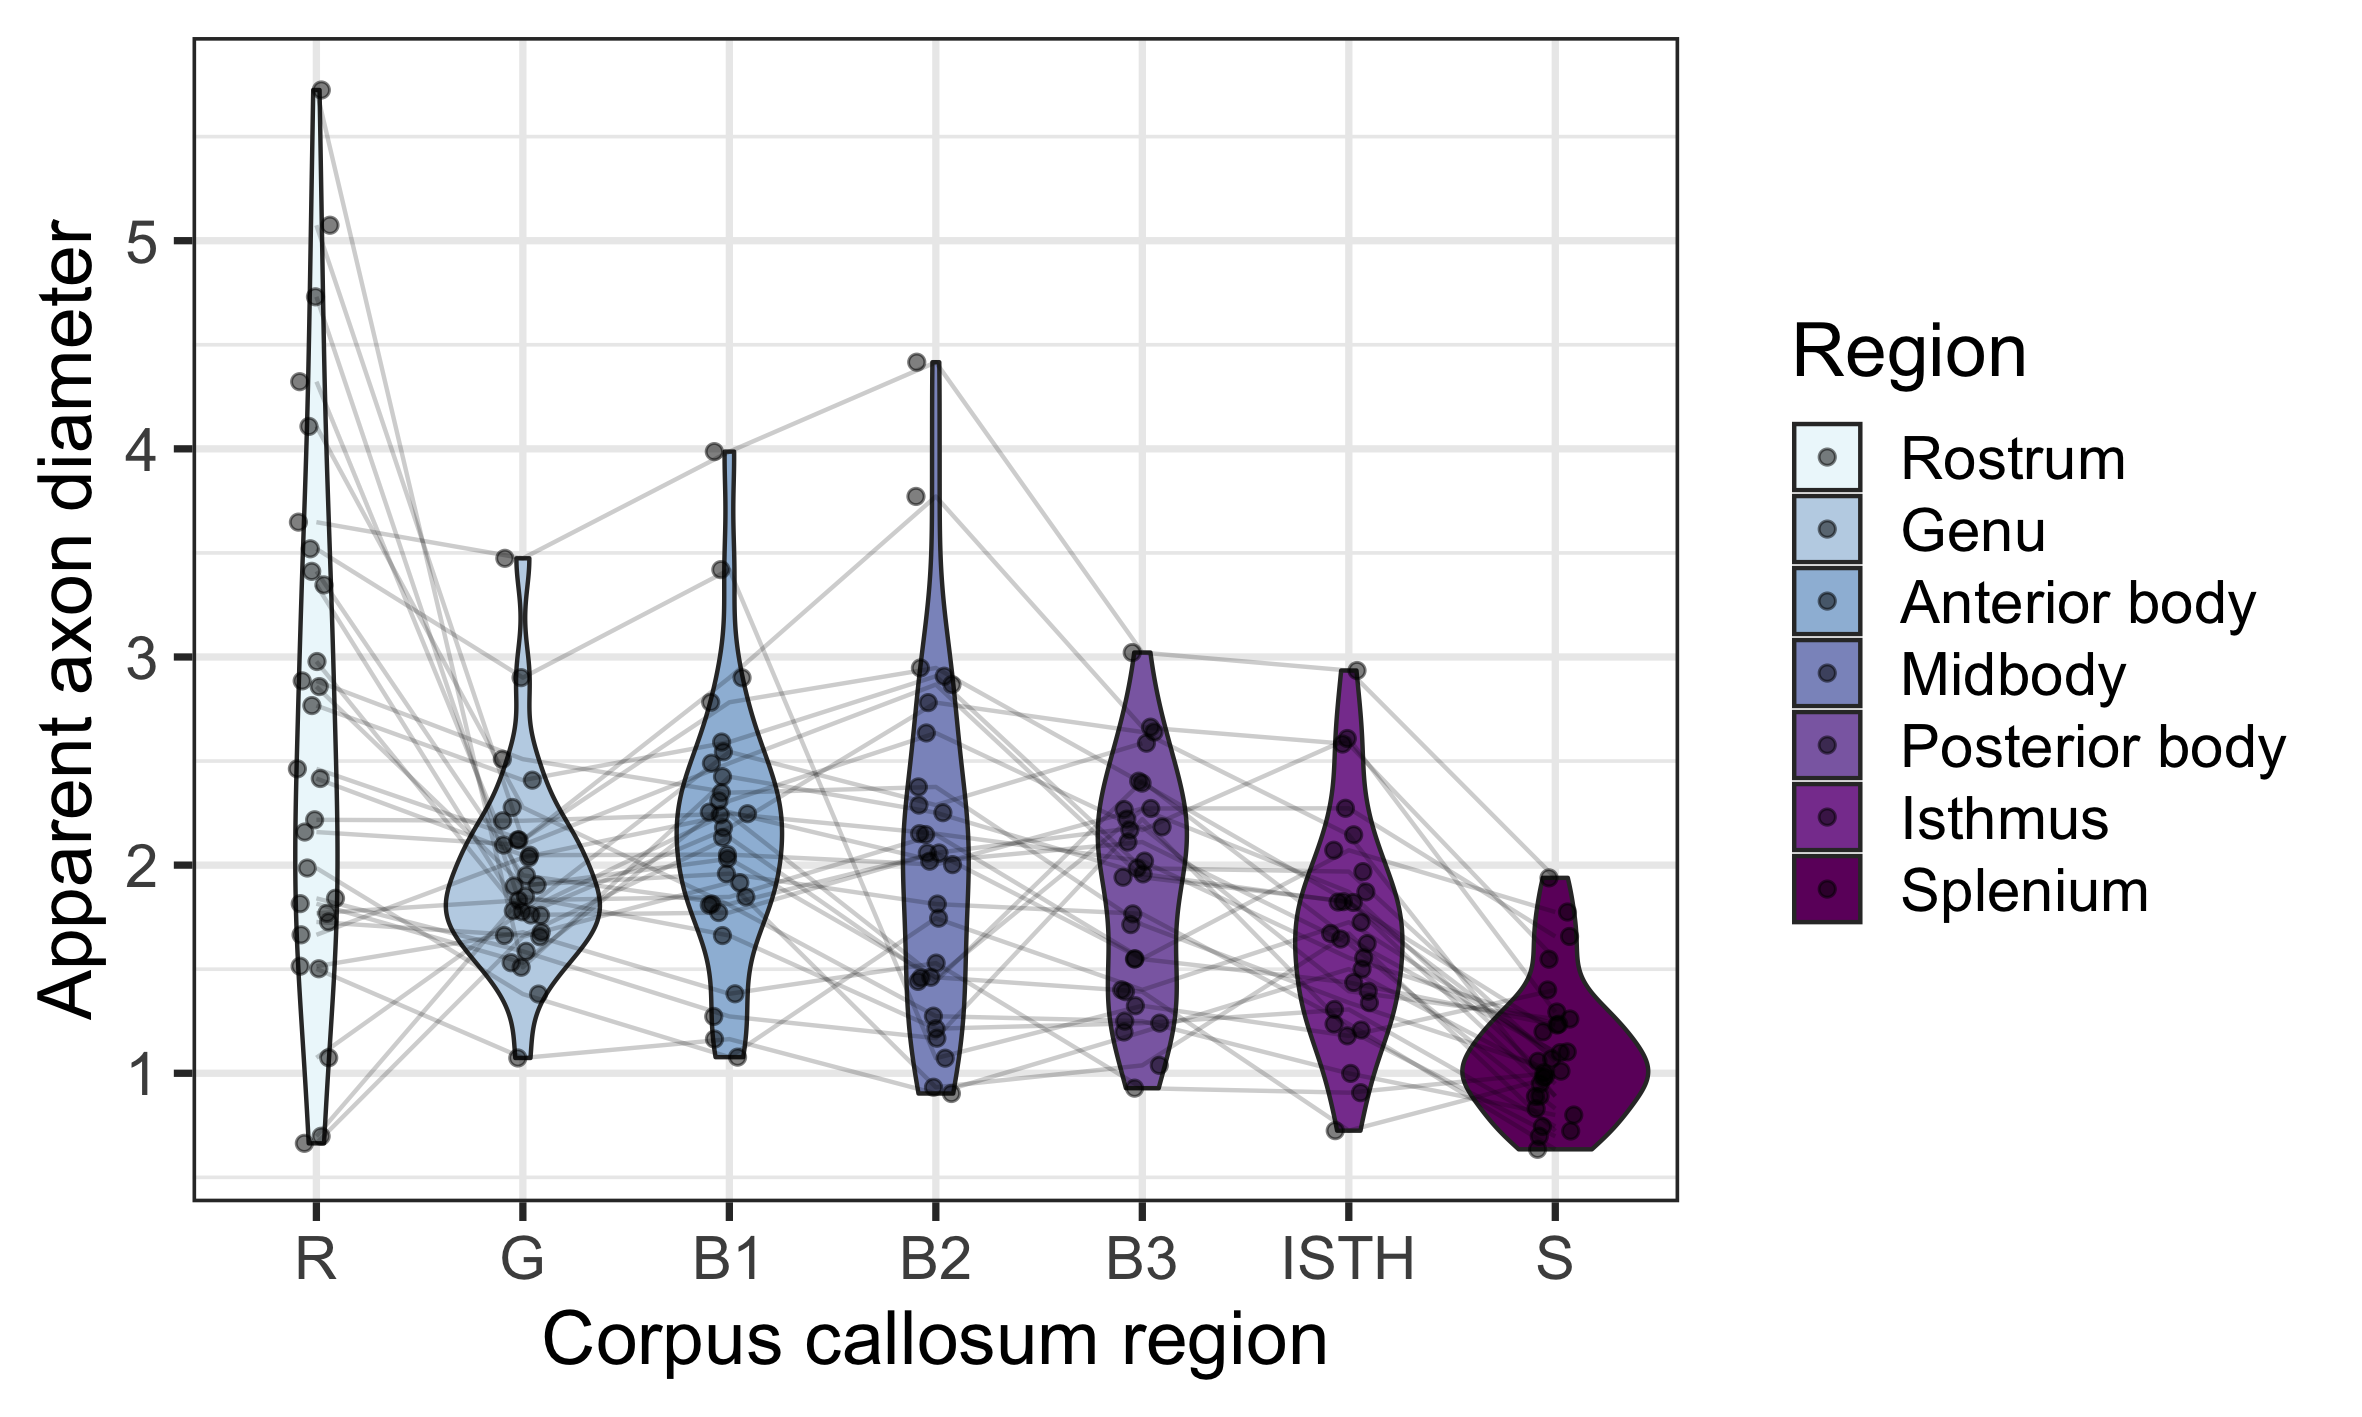
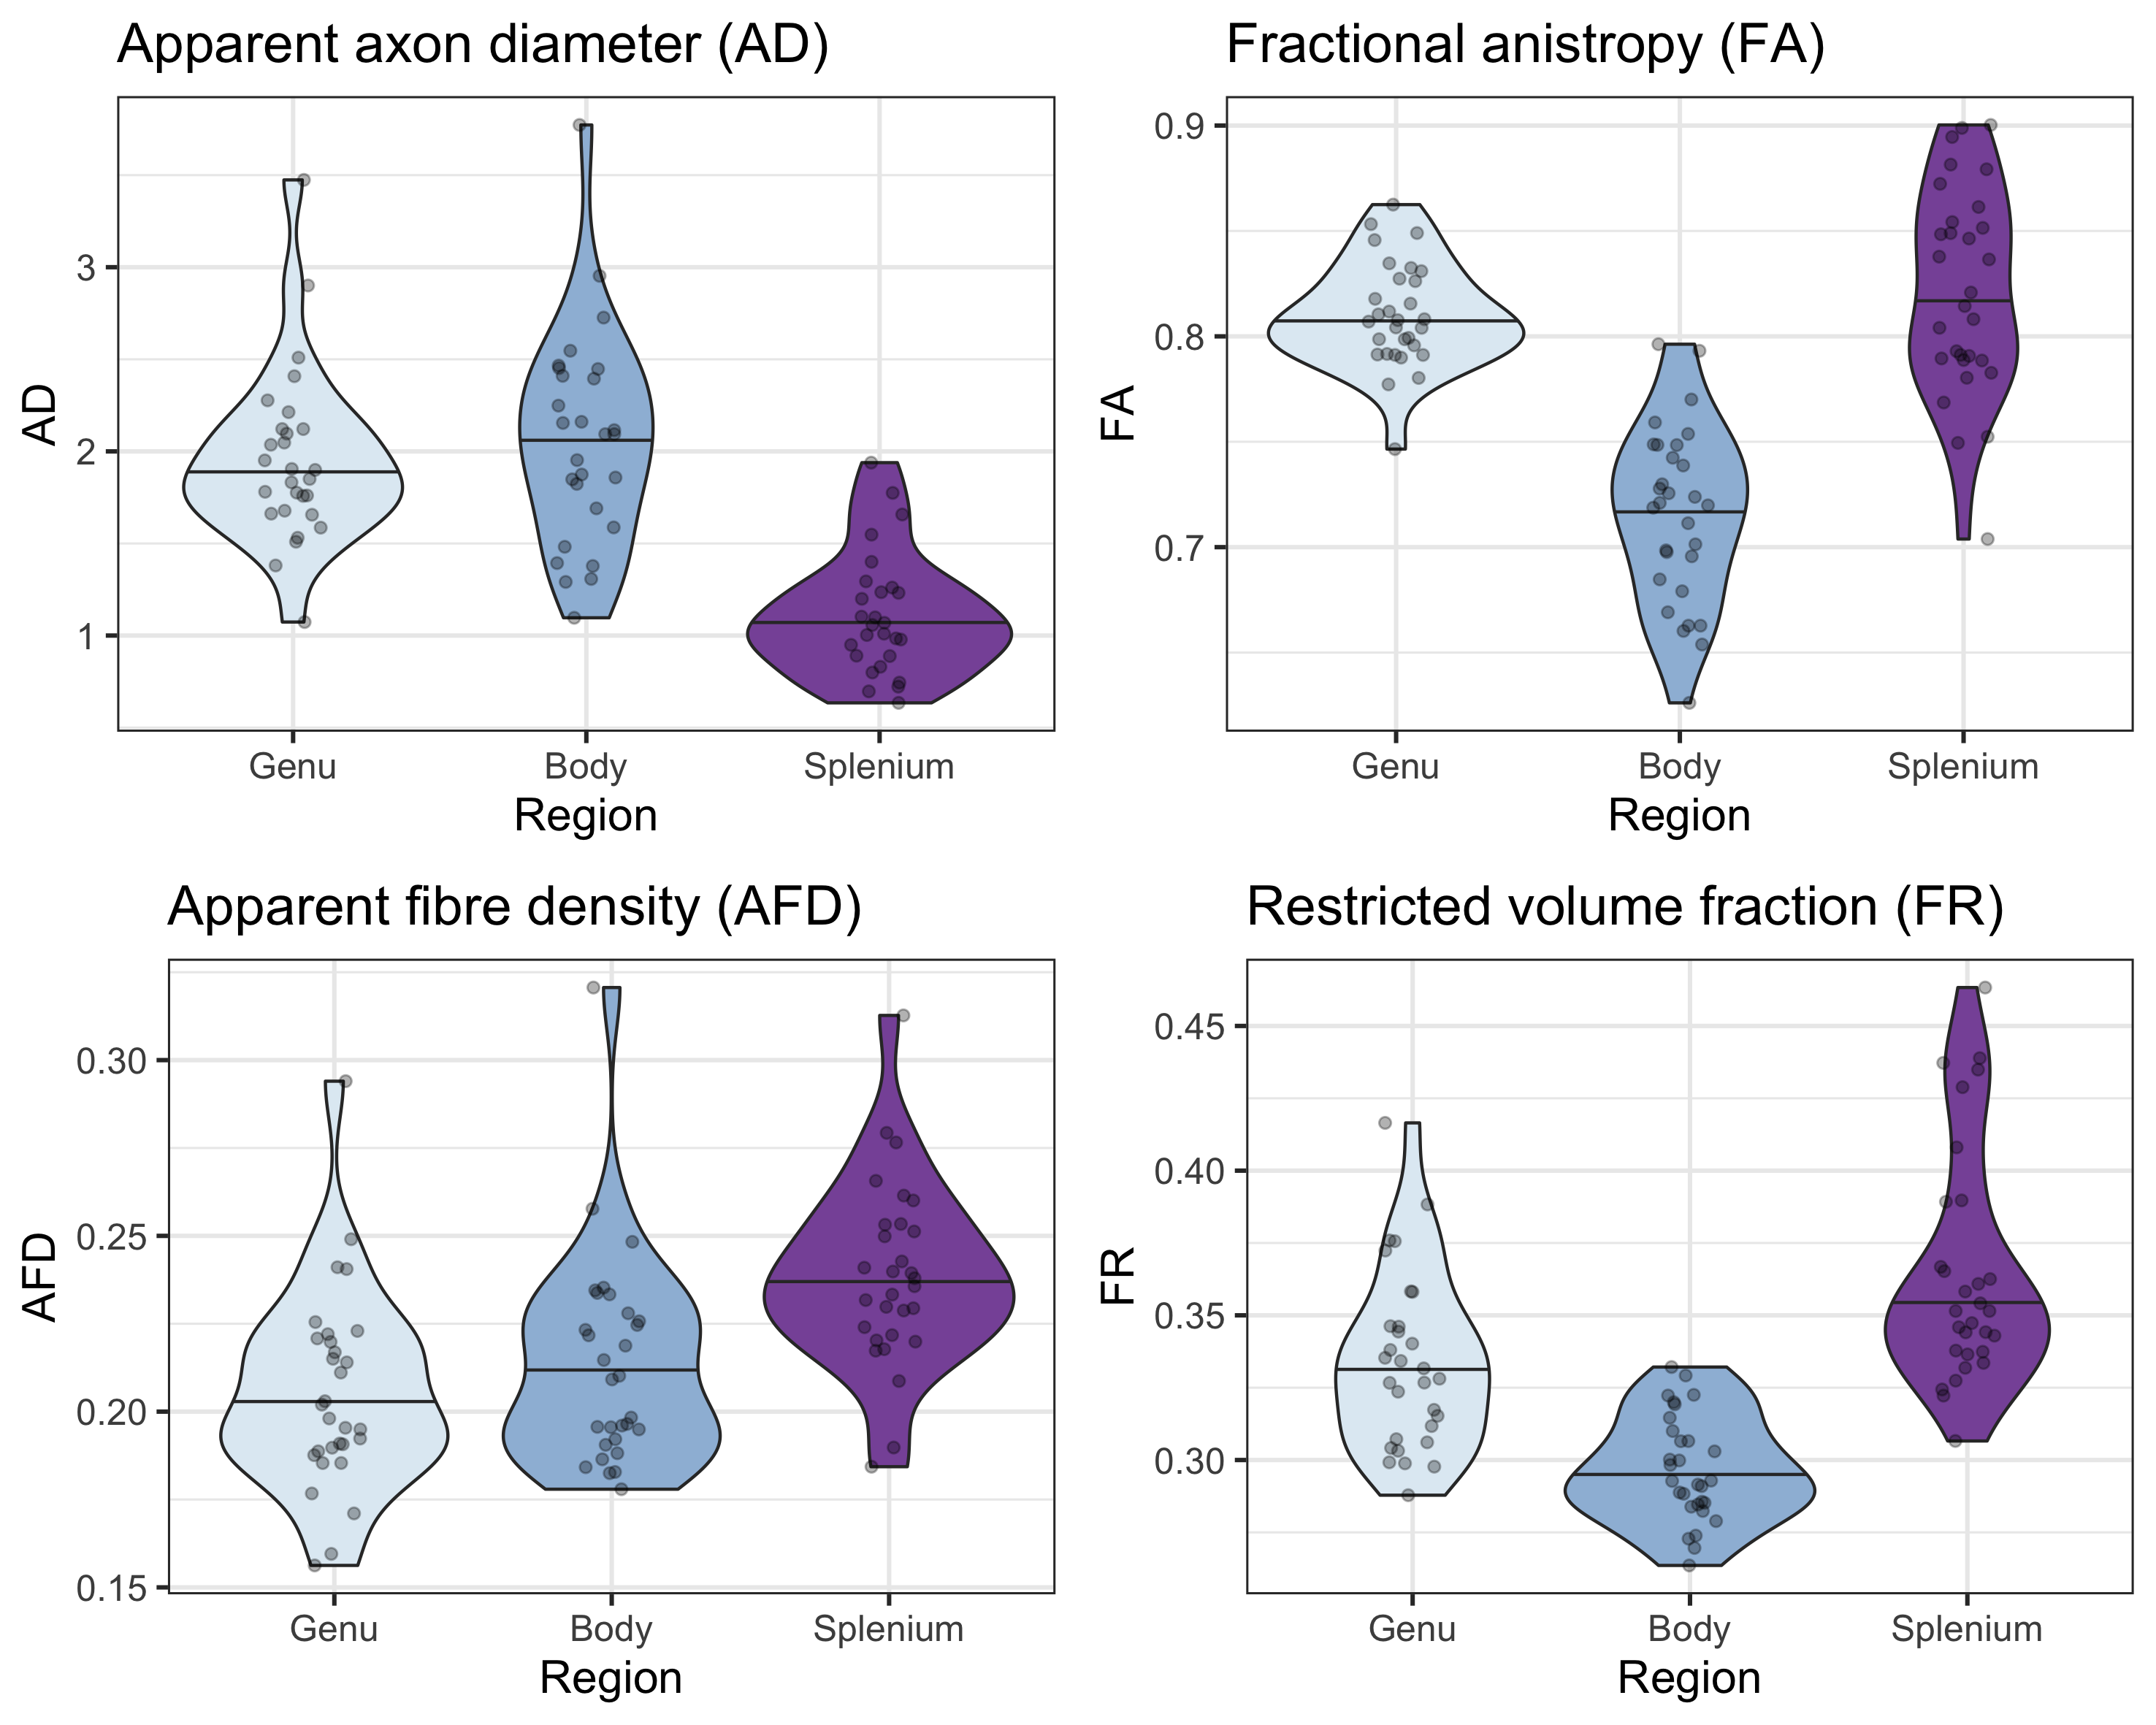
The linear relationship between age and AD is shown in Fig 2. Using the AIC of each model fit, we compared nested polynomial models to identify the most parsimonious representation of the diameter-age relationship within each region (Fig 3a). We observed a significant relationship between AD and age modelled as a third order polynomial in the genu (R2=.33, p=.02) and anterior body (R2=.51, p=.02). This was reflected as a steep increase in AD between ages 8-12, followed by a plateau over ages 12-18 (Fig 3b). We observed a significant relationship between AD and age modelled as a second order polynomial in the mid body (R2=.37, p<.001) and posterior body (R2=.25, p<.01). We observed no significant sex differences in AD across the regions.There was some evidence for a previously reported ‘low-high-low’ pattern of AD across the corpus callosum (Fig 4). Compared with other diffusion measures, higher AD was coupled with lower AFD, and higher FA was coupled with higher FR (Fig 5).
Discussion
Our findings of a positive relationship between age and apparent axon diameter across the corpus callosum suggest that radial axonal growth may contribute to the development of white matter microstructure. These effects were most pronounced in the genu and anterior body of the corpus callosum, regions known to have a protracted development of microstructure over adolescence19. Assessment of polynomial age relationships revealed that AD in anterior segments may increase until 12-13 years (coinciding with pubertal onset) and then plateau in adolescence. Our findings linked with recent work in adults may suggest that the genu undergoes prolonged radial axonal growth in childhood followed by selective axonal loss in later adulthood20.The AD estimates derived from the truncated model fits in the genu, body, and splenium were in line with expected patterns5. Although in vivo axon diameter estimates are inflated due to the resolution limit6, we still see the expected pattern of age-related differences in AD. Future work should incorporate measures of myelination to assess the relative contributions from each biophysical compartment, as AD estimation can be influenced by extra-axonal features21. While these preliminary data are promising, larger sample sizes and longitudinal data are also required to determine whether AD increases are yet to occur in the posterior segments of the corpus callosum, or whether they reach maximum size in childhood.
Conclusion
In this novel application of microstructural development, we observe an age-related maturation of axon diameter in the genu and body of the corpus callosum across childhood and adolescence.Acknowledgements
We are grateful to the participants and their families for their participation in this study. We would like to thank Umesh Rudrapatna and Isobel Ward for their support with data acquisition. We also thank Heather Hsu and Laura Bloomfield for assistance with data processing.References
1. Yakovlev PI, Lecours A-R. The myelogenetic cycles of regional maturation of the brain: F. A. Davis Company, Philadelphia, Pa.; 1967. 3-70 p.
2. LaMantia AS, Rakic P. Axon overproduction and elimination in the corpus callosum of the developing rhesus monkey. The Journal of neuroscience : the official journal of the Society for Neuroscience. 1990;10(7):2156-75.
3. Sherman DL, Brophy PJ. Mechanisms of axon ensheathment and myelin growth. Nature reviews Neuroscience. 2005;6(9):683-90.
4. Genc S, Smith RE, Malpas CB, Anderson V, Nicholson JM, Efron D, et al. Development of white matter fibre density and morphology over childhood: A longitudinal fixel-based analysis. Neuroimage. 2018;183:666-76.
5. Aboitiz F, Scheibel AB, Fisher RS, Zaidel E. Fiber composition of the human corpus callosum. Brain Res. 1992;598(1-2):143-53.
6. Nilsson M, Lasic S, Drobnjak I, Topgaard D, Westin CF. Resolution limit of cylinder diameter estimation by diffusion MRI: The impact of gradient waveform and orientation dispersion. NMR Biomed. 2017;30(7):e3711.
7. Jones DK, Alexander DC, Bowtell R, Cercignani M, Dell'Acqua F, McHugh DJ, et al. Microstructural imaging of the human brain with a 'super-scanner': 10 key advantages of ultra-strong gradients for diffusion MRI. Neuroimage. 2018;182:8-38.
8. Vos SB, Tax CM, Luijten PR, Ourselin S, Leemans A, Froeling M. The importance of correcting for signal drift in diffusion MRI. Magn Reson Med. 2017;77(1):285-99.
9. Andersson JLR, Sotiropoulos SN. An integrated approach to correction for off-resonance effects and subject movement in diffusion MR imaging. Neuroimage. 2016;125:1063-78.
10. Rudrapatna S, Parker G, Roberts J, Jones D, editors. Can we correct for interactions between subject motion and gradient-nonlinearity in diffusion MRI. Proc Int Soc Mag Reson Med; 2018.
11. Glasser MF, Sotiropoulos SN, Wilson JA, Coalson TS, Fischl B, Andersson JL, et al. The minimal preprocessing pipelines for the Human Connectome Project. Neuroimage. 2013;80:105-24.
12. Kellner E, Dhital B, Kiselev VG, Reisert M. Gibbs-ringing artifact removal based on local subvoxel-shifts. Magnetic Resonance in Medicine. 2016;76(5):1574-81.
13. Assaf Y, Basser PJ. Composite hindered and restricted model of diffusion (CHARMED) MR imaging of the human brain. Neuroimage. 2005;27(1):48-58.
14. Assaf Y, Blumenfeld-Katzir T, Yovel Y, Basser PJ. AxCaliber: a method for measuring axon diameter distribution from diffusion MRI. Magn Reson Med. 2008;59(6):1347-54.
15. Harms RL, Fritz FJ, Tobisch A, Goebel R, Roebroeck A. Robust and fast nonlinear optimization of diffusion MRI microstructure models. Neuroimage. 2017;155:82-96.
16. De Santis S, Jones DK, Roebroeck A. Including diffusion time dependence in the extra-axonal space improves in vivo estimates of axonal diameter and density in human white matter. Neuroimage. 2016;130:91-103.
17. Drakesmith M, Rudrapatna SU, Santis Sd, Jones DK. Estimating axon diameter distributions beyond the physical limits of acquisition capabilities. 5235. Proc Intl Soc Mag Reson Med (ISMRM); 2018; Paris, France.
18. Witelson SF. Hand and sex differences in the isthmus and genu of the human corpus callosum. A postmortem morphological study. Brain. 1989;112 ( Pt 3):799-835.
19. Krogsrud SK, Fjell AM, Tamnes CK, Grydeland H, Mork L, Due-Tonnessen P, et al. Changes in white matter microstructure in the developing brain--A longitudinal diffusion tensor imaging study of children from 4 to 11years of age. Neuroimage. 2016;124(Pt A):473-86.
20. Fan Q, Tian Q, Ohringer NA, Nummenmaa A, Witzel T, Tobyne SM, et al. Age-related alterations in axonal microstructure in the corpus callosum measured by high-gradient diffusion MRI. Neuroimage. 2019;191:325-36.
21. Lee H-H, Fieremans E, Novikov DS. What dominates the time dependence of diffusion transverse to axons: Intra- or extra-axonal water? Neuroimage. 2018;182:500-10.
Figures