0227
Longitudinal development of white matter fibre density and morphology in children born very preterm1Victorian Infant Brain Study (VIBeS), Murdoch Children's Research Institute, Melbourne, Australia, 2Developmental Imaging, Murdoch Children's Research Institute, Melbourne, Australia, 3Department of Paediatrics, The University of Melbourne, Melbourne, Australia, 4Florey Institute of Neuroscience and Mental Health, Melbourne, Australia, 5Cardiff University Brain Research Imaging Centre (CUBRIC), Cardiff University, Cardiff, United Kingdom, 6Department of Neurosurgery, The Royal Children's Hospital, Melbourne, Australia, 7Neuroscience Research, Murdoch Children's Research Institute, Melbourne, Australia, 8Newborn Research, The Royal Women’s Hospital, Melbourne, Australia, 9Department of Obstetrics and Gynaecology, The University of Melbourne, Melbourne, Australia, 10Turner Institute for Brain and Mental Health, Monash University, Melbourne, Australia
Synopsis
In this long-term follow-up of children following very preterm (VP) birth, we applied fixel-based analysis to study white matter development. At ages 7 and 13 years, VP children had reduced fibre density and cross-section throughout the white matter compared with full-term controls. Longitudinally, VP children had slower macrostructural development of commissural and motor pathways between ages 7 and 13 years. Younger gestational age, smaller birth weight and neonatal brain abnormalities were associated with lower fibre density and cross-section at both ages. Thus, VP birth and concomitant perinatal risk factors are associated with long-term delays and/or disruptions to white matter development.
Introduction
Very preterm (VP) birth is associated with altered brain development and neurodevelopmental delays.1, 2 Fixel-based analysis (FBA) is a quantitative diffusion magnetic resonance imaging (MRI) analysis method that enables investigation of brain white matter microscopic fibre density (FD), macroscopic fibre bundle morphology (fibre cross-section, FC), and their combination (fibre density and cross-section, FDC), along multiple fibre populations within an imaging voxel.3 FBA thus enables more specific inference on white matter structural properties than previous analysis methods. Previous studies applied FBA to examine white matter microstructure and macrostructure in preterm-born infants during the neonatal period (term-equivalent age).4, 5 In the current study, we applied FBA to investigate white matter development in childhood following VP birth. We aimed to: (1) compare FBA metrics between VP children and full-term (FT) control children cross-sectionally at ages 7 and 13 years; (2) compare the longitudinal development of FBA metrics from ages 7 to 13 years between VP and FT children, and; (3) examine associations between perinatal risk factors and cross-sectional and longitudinal development of FBA metrics in VP children.Methods
224 VP infants (born <30 weeks' gestation/<1250 g) and 77 FT infants (born ≥37 weeks' gestation) were recruited during the neonatal period into a prospective longitudinal study. Diffusion MRI data were acquired at two ages: (1) mean (SD) 7.6 (0.2) years [b-value=3000s/mm2, 45 gradient directions, six b=0s/mm2 volumes, TE/TR=106/7400ms, voxel size=2.3mm3], and; (2) mean (SD) 13.3 (0.4) years [b-value=2800s/mm2, 60 gradient directions, four b=0s/mm2 volumes, TE/TR=110/3200ms, voxel size=2.4mm3]. For cross-sectional analyses, 138 VP and 32 FT children had usable images at age 7 years; 130 VP and 45 FT children had usable images at age 13 years. For longitudinal analyses, 103 VP and 21 FT children had usable images at both ages.All diffusion images were processed using recommended steps for single-shell, single-tissue FBA with MRtrix3,6 including: motion and distortion correction, bias correction, global intensity normalisation, upsampling to 1.3mm3, constrained spherical deconvolution, registration to a study-specific template, fixel segmentation, and FBA metric calculation.
Statistical analyses of FBA metrics were performed using connectivity-based fixel enhancement7 and non-parametric permutation testing, with modifications for longitudinal analyses.8 We compared FBA metrics between VP and FT children, both cross-sectionally at ages 7 and 13 years, and longitudinally from ages 7 to 13 years. In the VP group, we examined associations between perinatal variables (gestational age at birth, birth weight z-score, sex, and neonatal global brain abnormality score9) and cross-sectional and longitudinal FBA metrics. All analyses were adjusted for age and sex. Secondary analyses were performed to adjust all analyses with FC and FDC for intracranial volume (ICV), consistent with previous studies.4, 5
Results
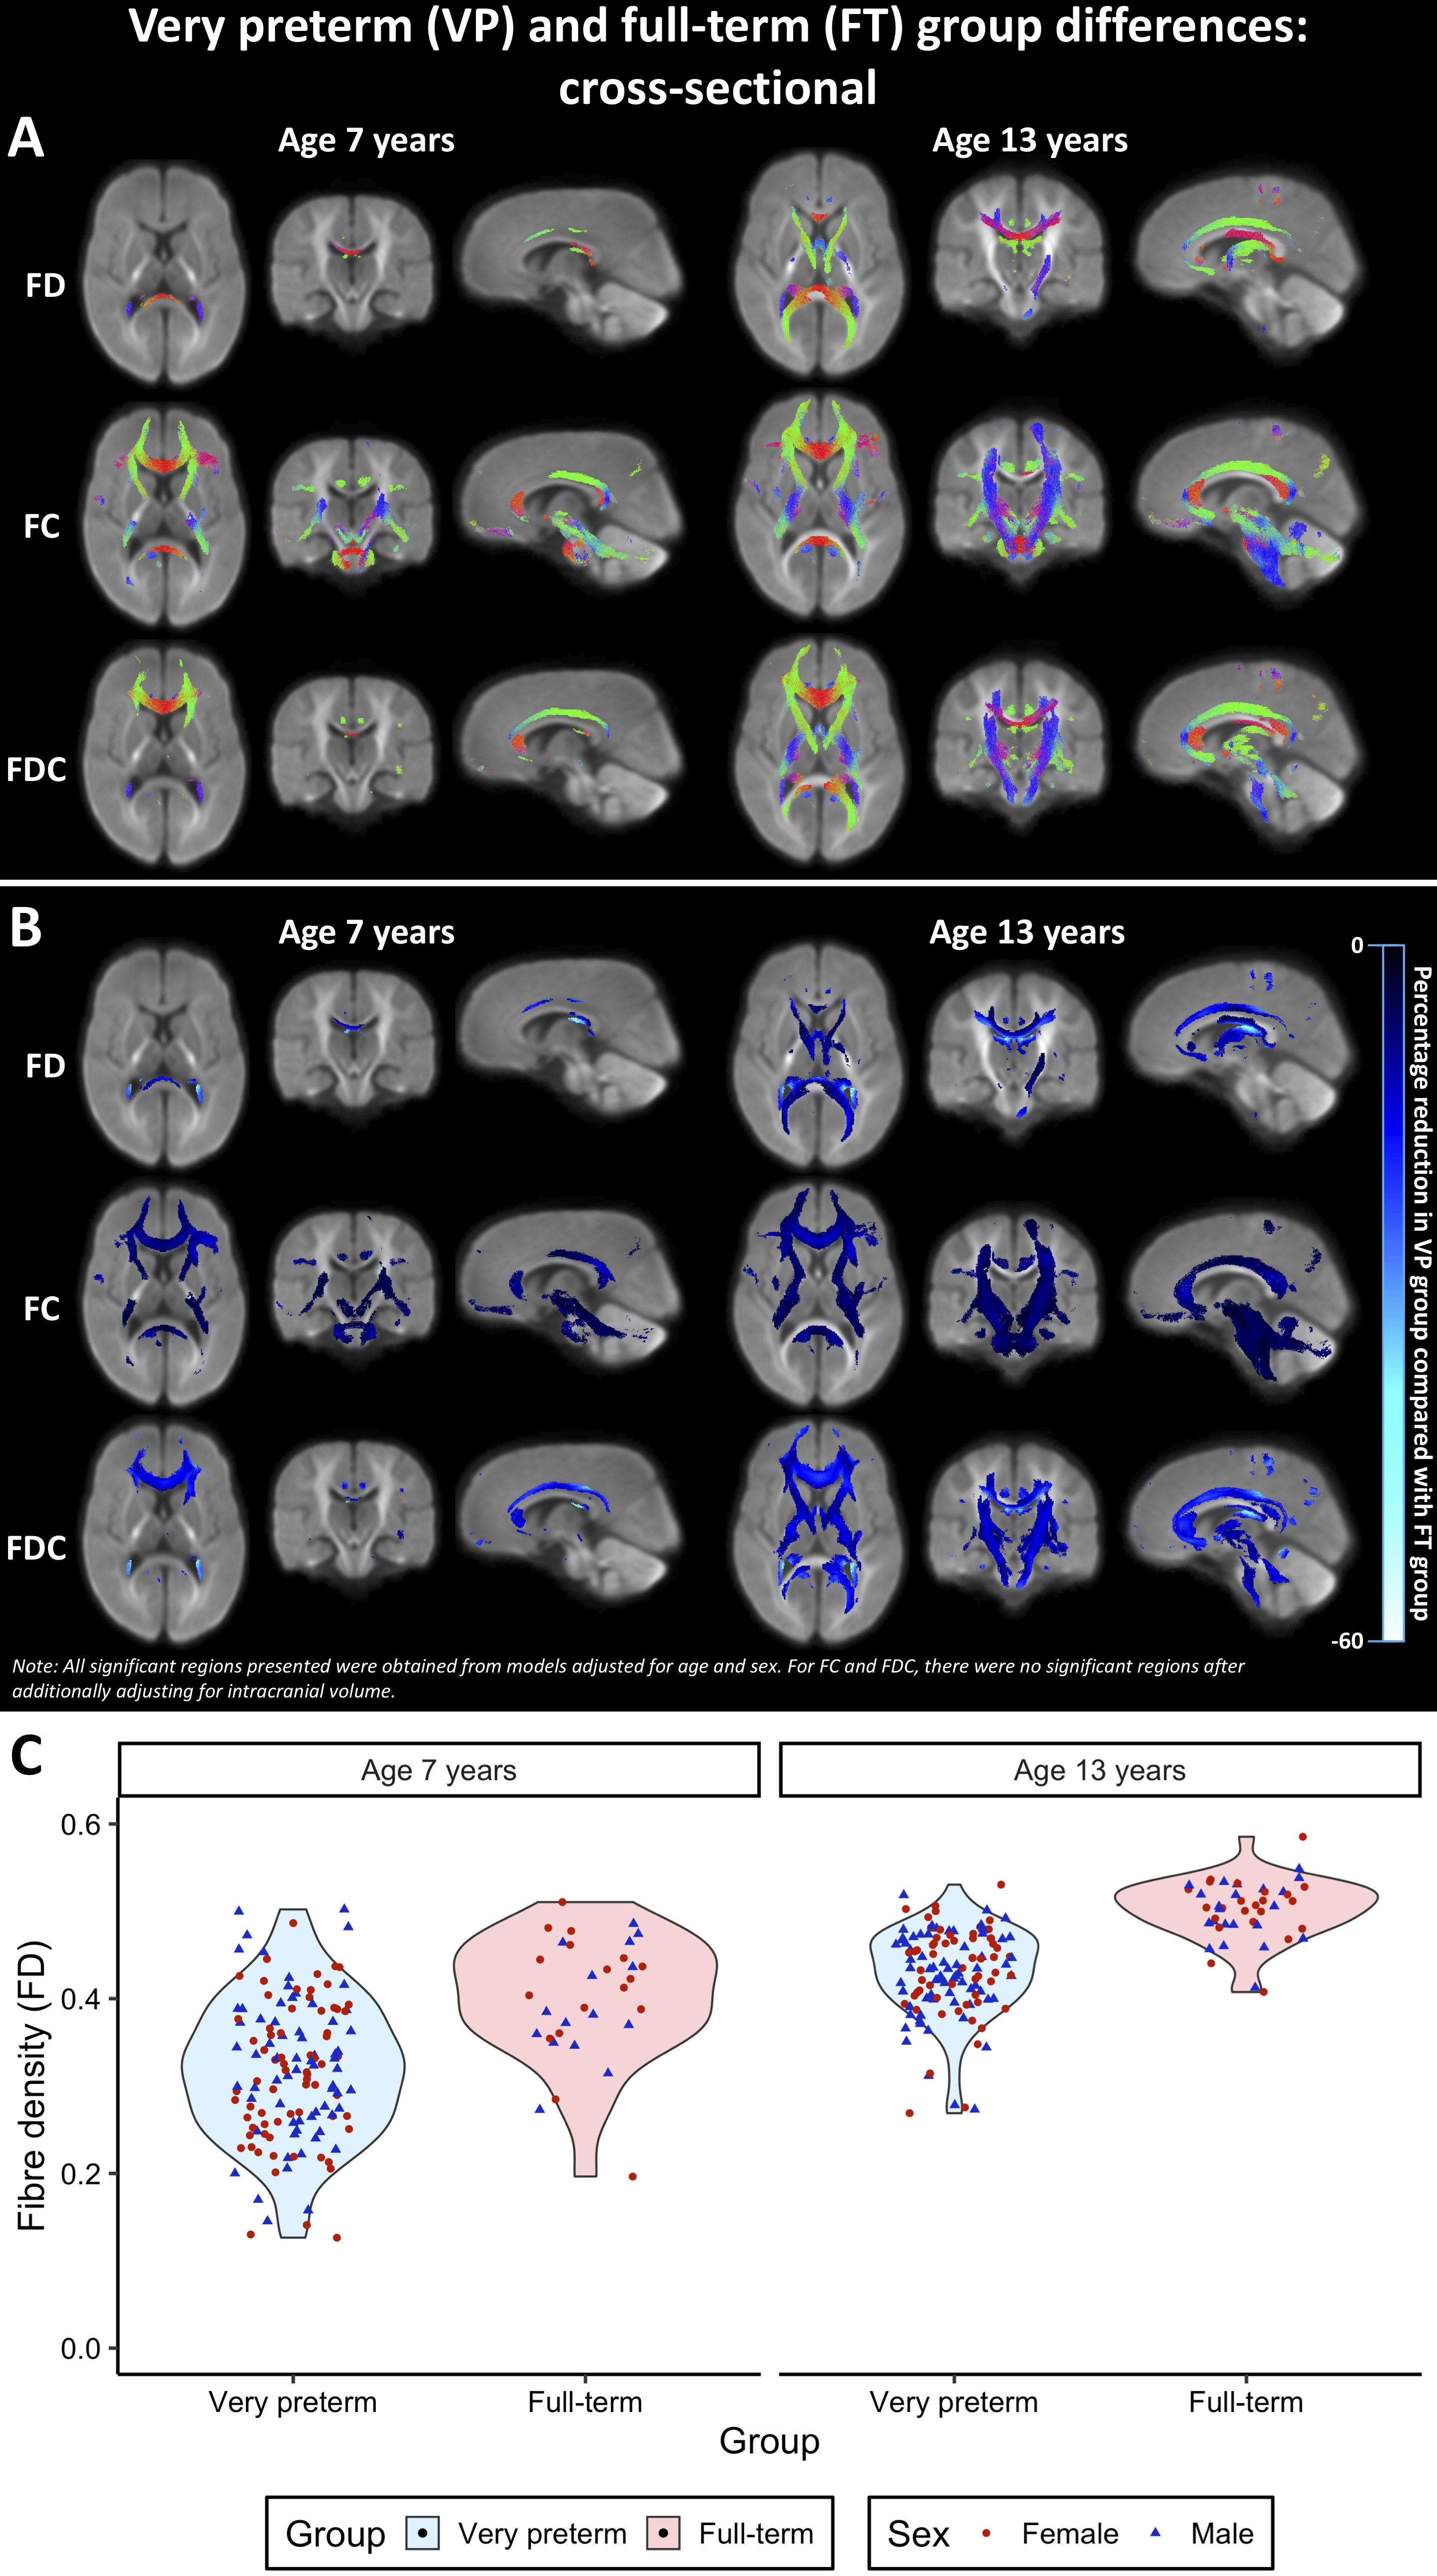
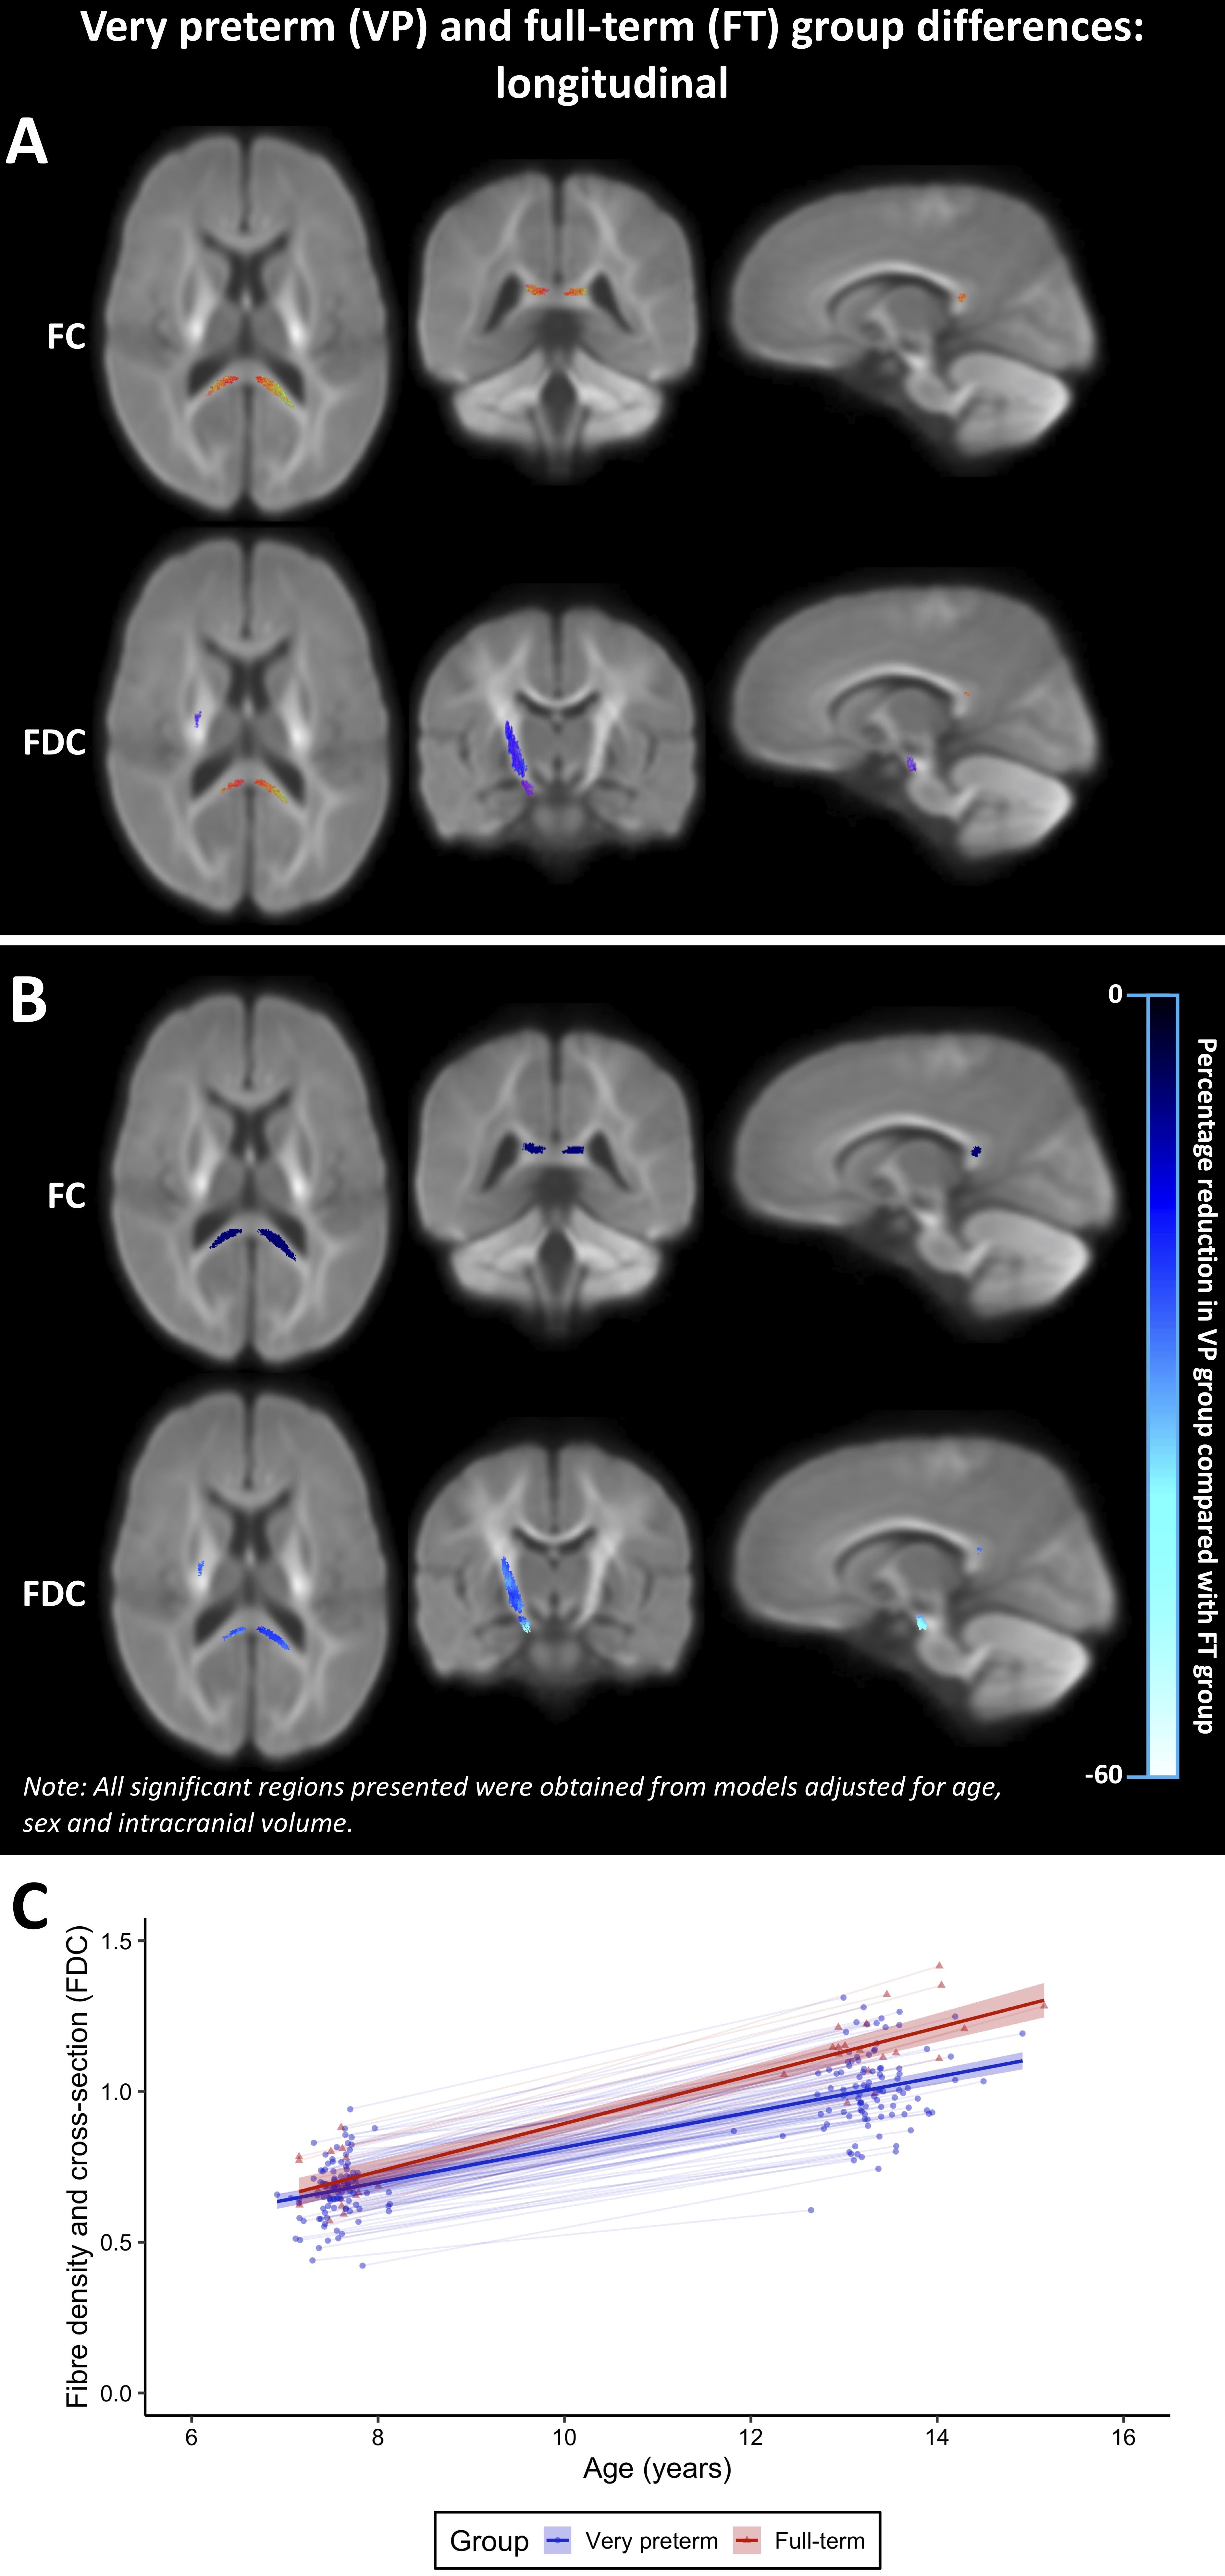
VP children had significantly lower FD, FC and FDC throughout the white matter compared with FT children at ages 7 and 13 years (Figure 1). These FC and FDC differences were not significant after adjusting for ICV.Between ages 7 and 13 years, FC and FDC in the splenium of the corpus callosum, right cerebral peduncle and right posterior limb of the internal capsule increased less in VP children compared with FT children, even after adjusting for ICV (Figure 2).
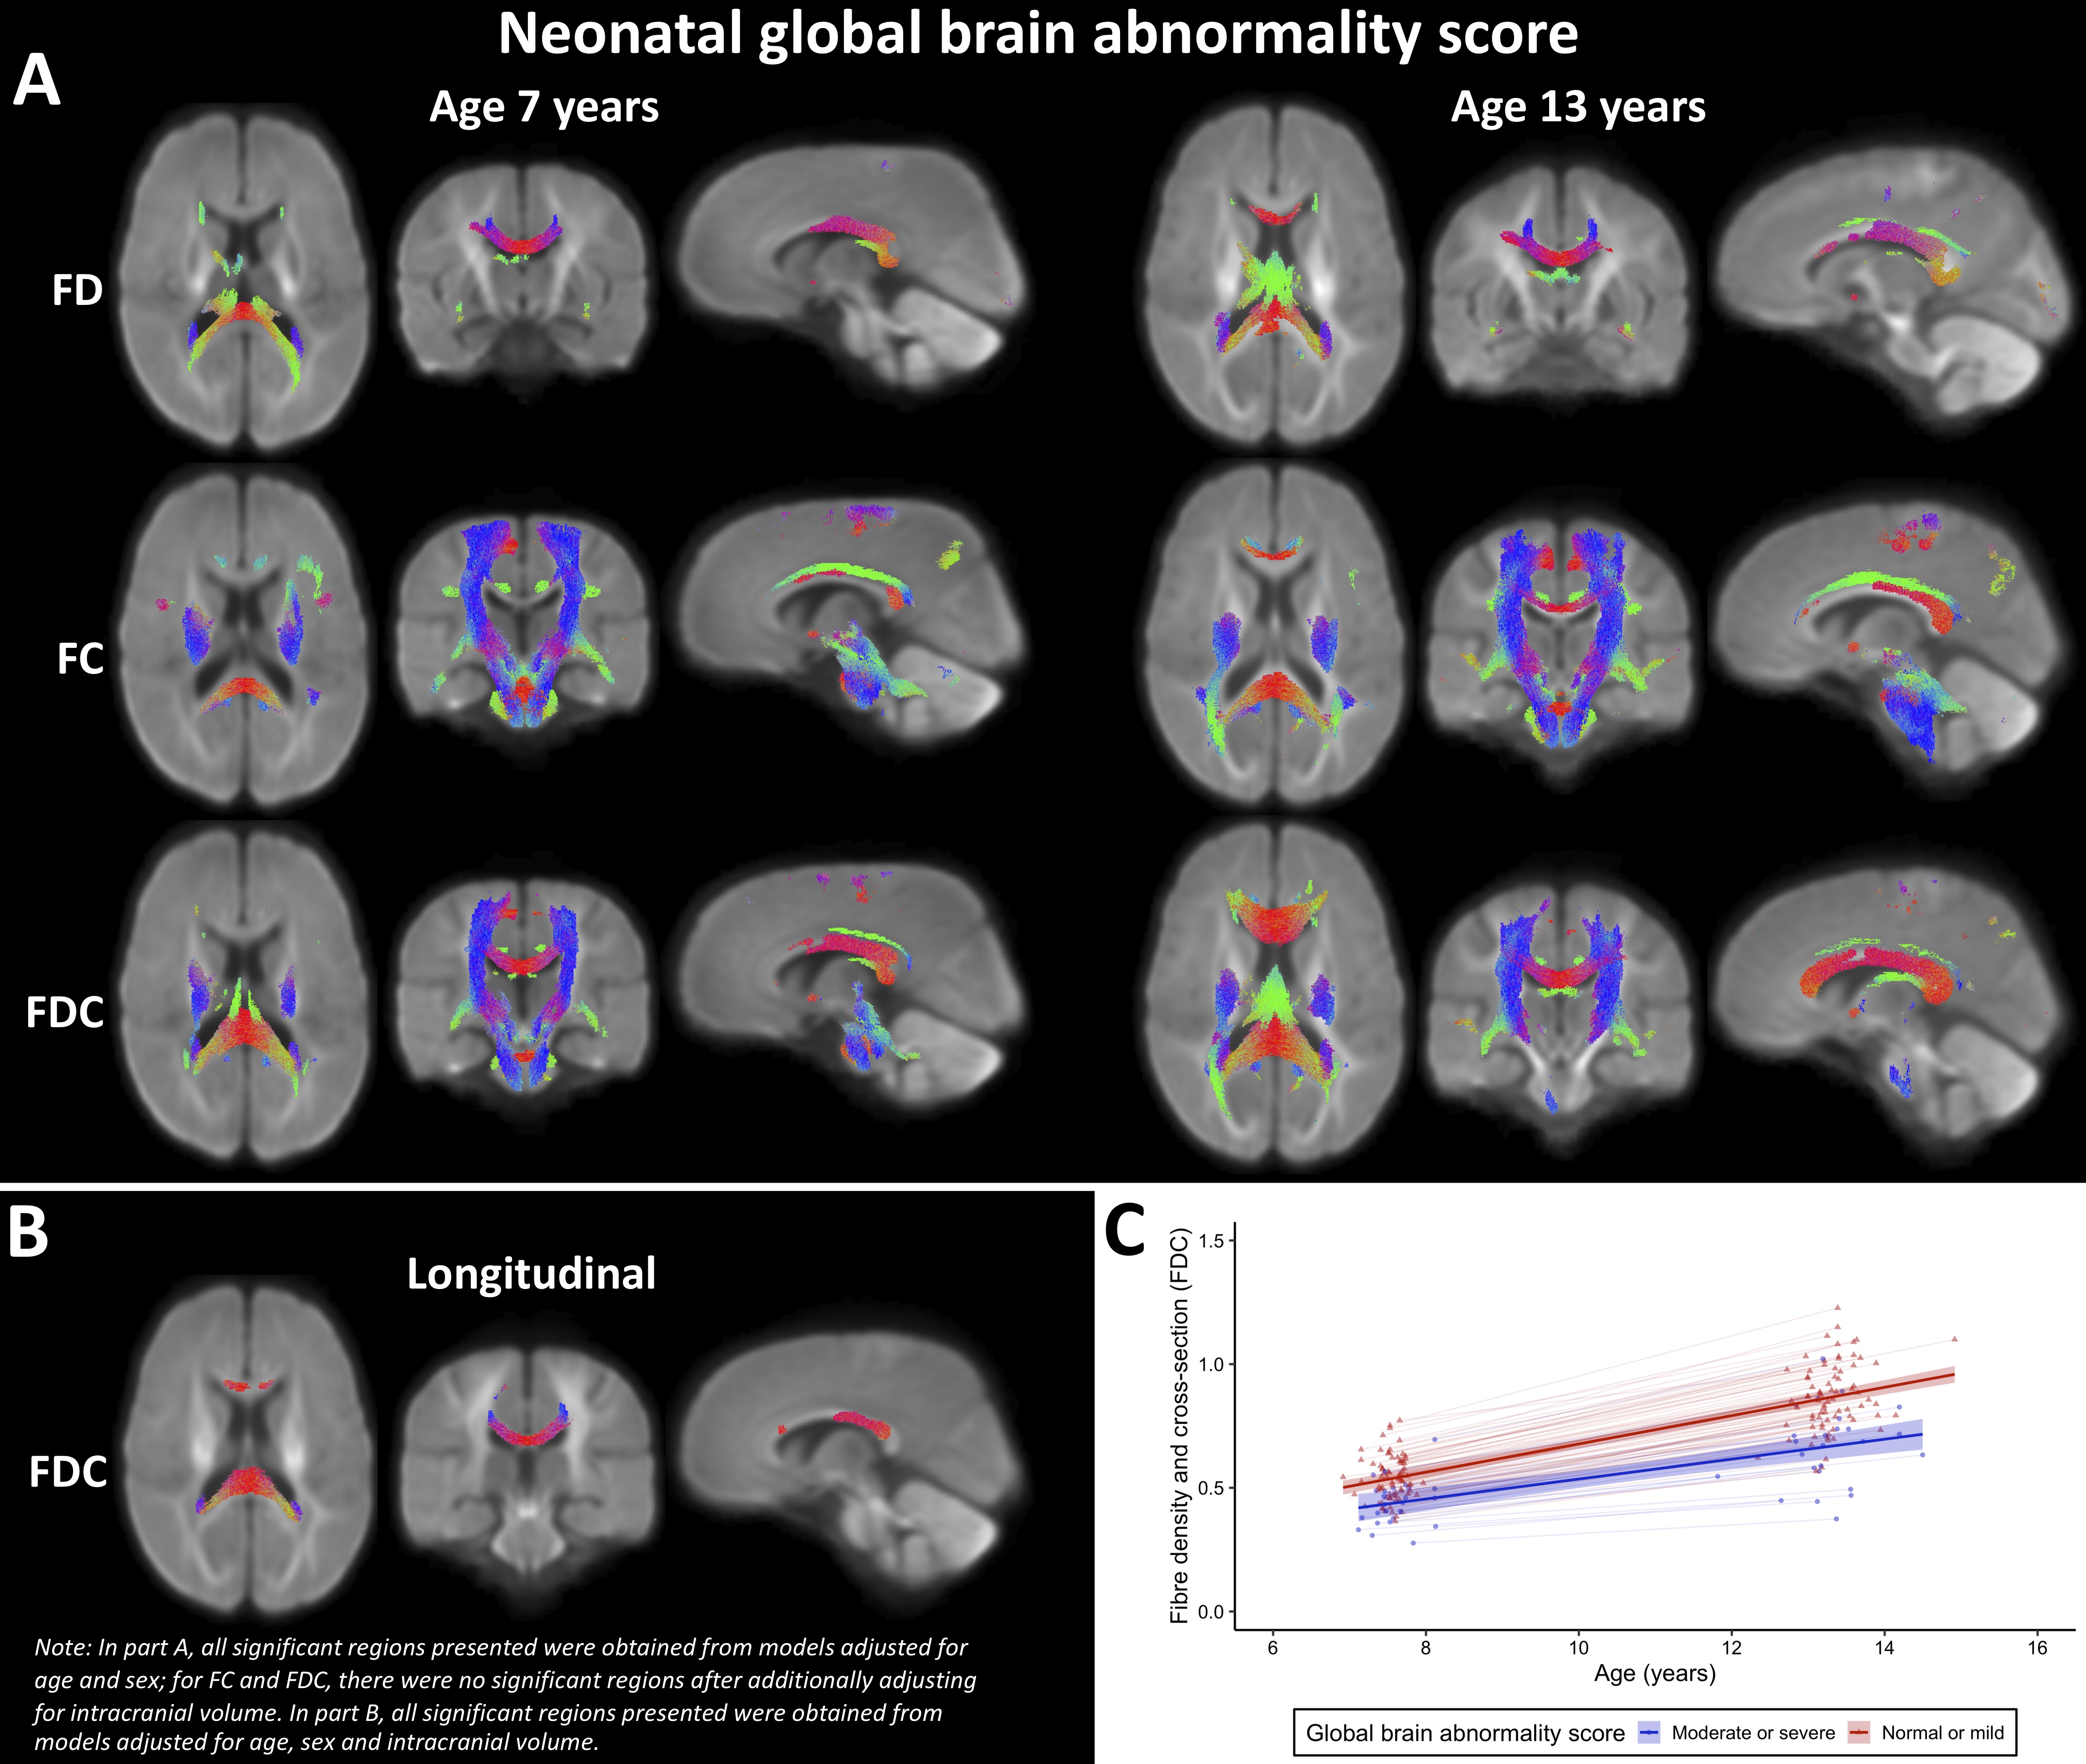
Within the VP group, younger gestational age at birth and smaller birth weight z-score were significantly associated with lower FD, FC and FDC in many fibres cross-sectionally at ages 7 and 13 years (Figure 3). VP males had larger FC and FDC throughout the white matter compared with VP females at ages 7 and 13 years, however, VP females had a significantly greater increase over time in FC in the corpus callosum and left superior corona radiata than VP males (Figure 4). More severe neonatal brain abnormalities were significantly associated with lower FD, FC and FDC throughout the white matter at ages 7 and 13 years, and with less increase in FDC in the corpus callosum and bilateral superior corona radiata between ages 7 and 13 years (Figure 5). After adjusting for ICV, all associations between perinatal variables and cross-sectional FC and FDC values were no longer significant, but associations between perinatal variables and longitudinal FC and FDC changes remained significant.
Discussion
Our results indicate that VP children have widespread microscopic FD and macroscopic FC reductions compared with FT controls. Macrostructural fibre reductions in VP children compared with FT children appeared to be proportional to the known smaller ICV in VP children.10 Furthermore, longitudinal analyses revealed that VP children had a reduced rate of macrostructural fibre development between ages 7 and 13 years than FT children, particularly in commissural and motor pathways.Younger gestational age, smaller birth weight, and neonatal brain abnormalities may predict later fibre microstructural and macrostructural deficits in VP children. Additionally, VP males had larger FC than VP females, proportional to their larger ICV. However, VP females had faster macrostructural development of some fibres than VP males, which may reflect influences of puberty,8, 11 or developmental vulnerability of VP males.5, 12
Conclusion
VP birth and concomitant perinatal risk factors are associated with long-term delays and/or disruptions to fibre microstructural and morphological development. This study provides a more comprehensive understanding of brain development following VP birth, and may help to explain the neurodevelopmental delays documented in the VP population.Acknowledgements
This research was conducted within the Victorian Infant Brain Study (VIBeS) and Developmental Imaging research groups, Murdoch Children’s Research Institute and the Children’s MRI Centre, the Royal Children's Hospital, Melbourne, Victoria. We thank members of the VIBeS and Developmental Imaging teams, the Royal Children’s Hospital Medical Imaging staff for their assistance and expertise in the collection of the MRI data included in this study, and the children and families who participated. This research was supported by the Australian National Health and Medical Research Council (NHMRC), the Murdoch Children’s Research Institute, the Royal Children’s Hospital, the Royal Children’s Hospital Foundation, the Department of Paediatrics at the University of Melbourne, and the Victorian Government's Operational Infrastructure Support Program.References
1. Volpe JJ. Brain injury in premature infants: a complex amalgam of destructive and developmental disturbances. Lancet Neurol. 2009;8(1):110–124.
2. Anderson PJ. Neuropsychological outcomes of children born very preterm. Semin Fetal Neonatal Med. 2014;19(2):90–96.
3. Raffelt DA, Tournier JD, Smith RE, et al. Investigating white matter fibre density and morphology using fixel-based analysis. Neuroimage. 2017;144(Pt A):58–73.
4. Pannek K, Fripp J, George JM, et al. Fixel-based analysis reveals alterations is brain microstructure and macrostructure of preterm-born infants at term equivalent age. Neuroimage Clin. 2018;18:51-59.
5. Pecheva D, Tournier JD, Pietsch M, et al. Fixel-based analysis of the preterm brain: Disentangling bundle-specific white matter microstructural and macrostructural changes in relation to clinical risk factors. Neuroimage Clin. 2019;23:101820.
6. Tournier JD, Smith R, Raffelt D, et al. MRtrix3: A fast, flexible and open software framework for medical image processing and visualisation. Neuroimage. 2019;202:116137.
7. Raffelt DA, Smith RE, Ridgway GR, et al. Connectivity-based fixel enhancement: Whole-brain statistical analysis of diffusion MRI measures in the presence of crossing fibres. Neuroimage. 2015;117:40–55.
8. Genc S, Smith RE, Malpas CB, et al. Development of white matter fibre density and morphology over childhood: A longitudinal fixel-based analysis. Neuroimage. 2018;183:666-676.
9. Kidokoro H, Neil JJ, Inder TE. New MR imaging assessment tool to define brain abnormalities in very preterm infants at term. Am J Neuroradiol. 2013;34(11):2208-2214.
10. Monson BB, Anderson PJ, Matthews LG, et al. Examination of the Pattern of Growth of Cerebral Tissue Volumes From Hospital Discharge to Early Childhood in Very Preterm Infants. JAMA Pediatr. 2016;170(8):772-779.
11. Genc S, Seal ML, Dhollander T, et al. White matter alterations at pubertal onset. Neuroimage. 2017;156:286-292.
12. Wood NS, Costeloe K, Gibson AT, et al. The EPICure study: associations and antecedents of neurological and developmental disability at 30 months of age following extremely preterm birth. Arch Dis Child Fetal Neonatal Ed. 2005;90(2):F134-140.
Figures