0225
Multivariate Evaluation of White Matter Maturation on Neonates and Toddlers by Diffusion Kurtosis Imaging with Mahalanobis Distance1Department of Radiology, the First Affiliated Hospital of Xi’an Jiaotong University, Xi'an, China
Synopsis
Mahalanobis distance is a feasible multivariate approach. This work compared performances of Mahalanobis distances based on different combinations of metrics in assessing the white matter maturation on neonates and toddlers. Mahalanobis distance based on the combination of diffusion tensor and kurtosis tensor metrics demonstrated various advantages: stronger correlation with the postmenstrual age and higher developmental speeds could be revealed; distances from the developing to the adult brains and the changes from neonates to toddlers were enlarged. Results in the current work suggest that diffusion kurotsis imaging with the Mahalanobis distance would benefit the characterization of white matter maturation.
Introduction
White matter maturation underpins the development of cognitive functions and behaviors [1]. Mahalanobis distance with diffusion tensor imaging (DTI) is a powerful multivariate strategy in assessing white matter development [2, 3]. As an extension of DTI, diffusion kurtosis imaging (DKI) could also provide kurtosis tensor (KT) metrics (axial kurtosisn, AK; radial kurtosis, RK, etc), besides diffusion tensor (DT) metrics (fractional anisotropy, FA; axial diffusivity, AD; radial diffusivity, RD) [4, 5]. However, the influence of KT metrics on the Mahalanobis distance remains to be investigated. This work compared performances of Mahalanobis distances based on different combinations of metrics in assessing the white matter maturation on neonates and toddlers.Methods
This study is approved by the local institutional review board. Informed written consents have been obtained from adult participants and the parents of neonates and toddlers.This study enrolled two cross-sectional developing subjects: neonates (age at MRI ≤ 28 days) and toddlers (12 months ≤ age at MRI < 24 months). This study also enrolled adults with age from 18 to 30 years as the reference. Subjects with MRI abnormalities and/or any disease that may affect white matter structure have been excludes. MRI was performed on a 3T scanner (Signa HDxt; GE Healthcare; Milwaukee, Wisconsin, USA) with an 8-channel head coil. DKI was performed by using SS-EPI with following parameters: b values=0, 500, 1000, 2000, 2500 s/mm2; 18 gradient directions per nonzero b value; Repetition time/Echo time =11000/91.7 ms; voxel size= 1.41 × 1.41 × 4 mm3.
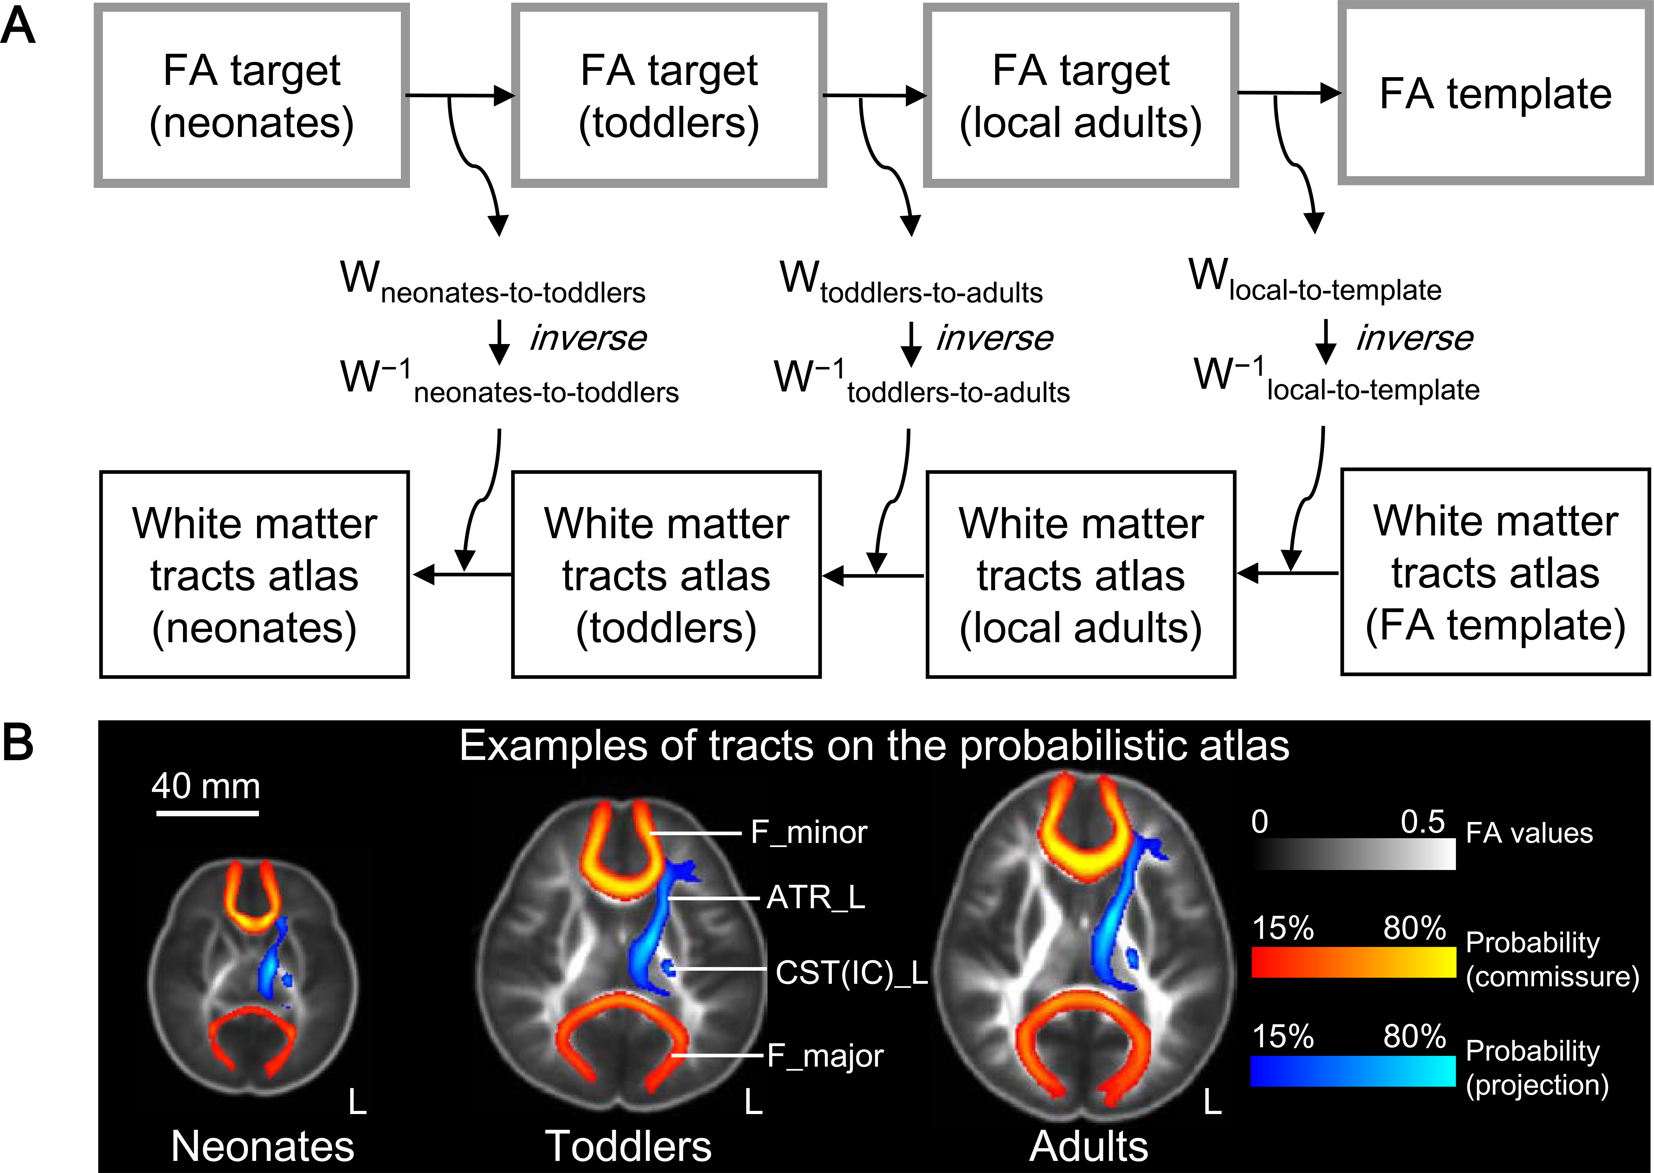
Post-processing of DKI was performed by using a robust workflow [6]. To normalize the derived metric images, this study created FA targets for neonates, toddlers and adults, separately [7]. For the atlas-based analysis, FA template and atlas available in FSL were back registered to the local FA target of adults, and then to the FA target of toddlers, and finally to the FA target of neonates (Figure 1). The white matter structures of interest included left and right regions of 2 projection tracts: corticospinal tract at the internal capsule level (CST(IC)) and anterior thalamic radiation (ATR); 2 commissural tracts: forceps major (F_major) and forceps minor (F_minor); left and right regions of 4 association tracts, inferior fronto-occipital fasciculus (IFOF), inferior longitudinal fasciculus (ILF), superior longitudinal fasciculus (SLF), and uncinate fasciculus (UF). Mahalanobis distances was calculated by using 'independent' DT metrics (DM,DT) and the combination of DT and KT metrics (DM,DT-KT), separately. Inter-group differences of the gestational age, age at MRI, postmenstrual age, and regional values in Mahalanobis distances were investigated by using the Mann-Whitney U test. The Chi-square test was used to explore the inter-group differences of the gender ratio. The correlation between Mahalanobis distances and the postmenstrual age was performed by using the Spearman correlation. The Wilcoxon signed rank test was used to assess differences between DM,DT and DM,DT-KT. All the tests were taken to be statistically significant at P<0.05.
Results
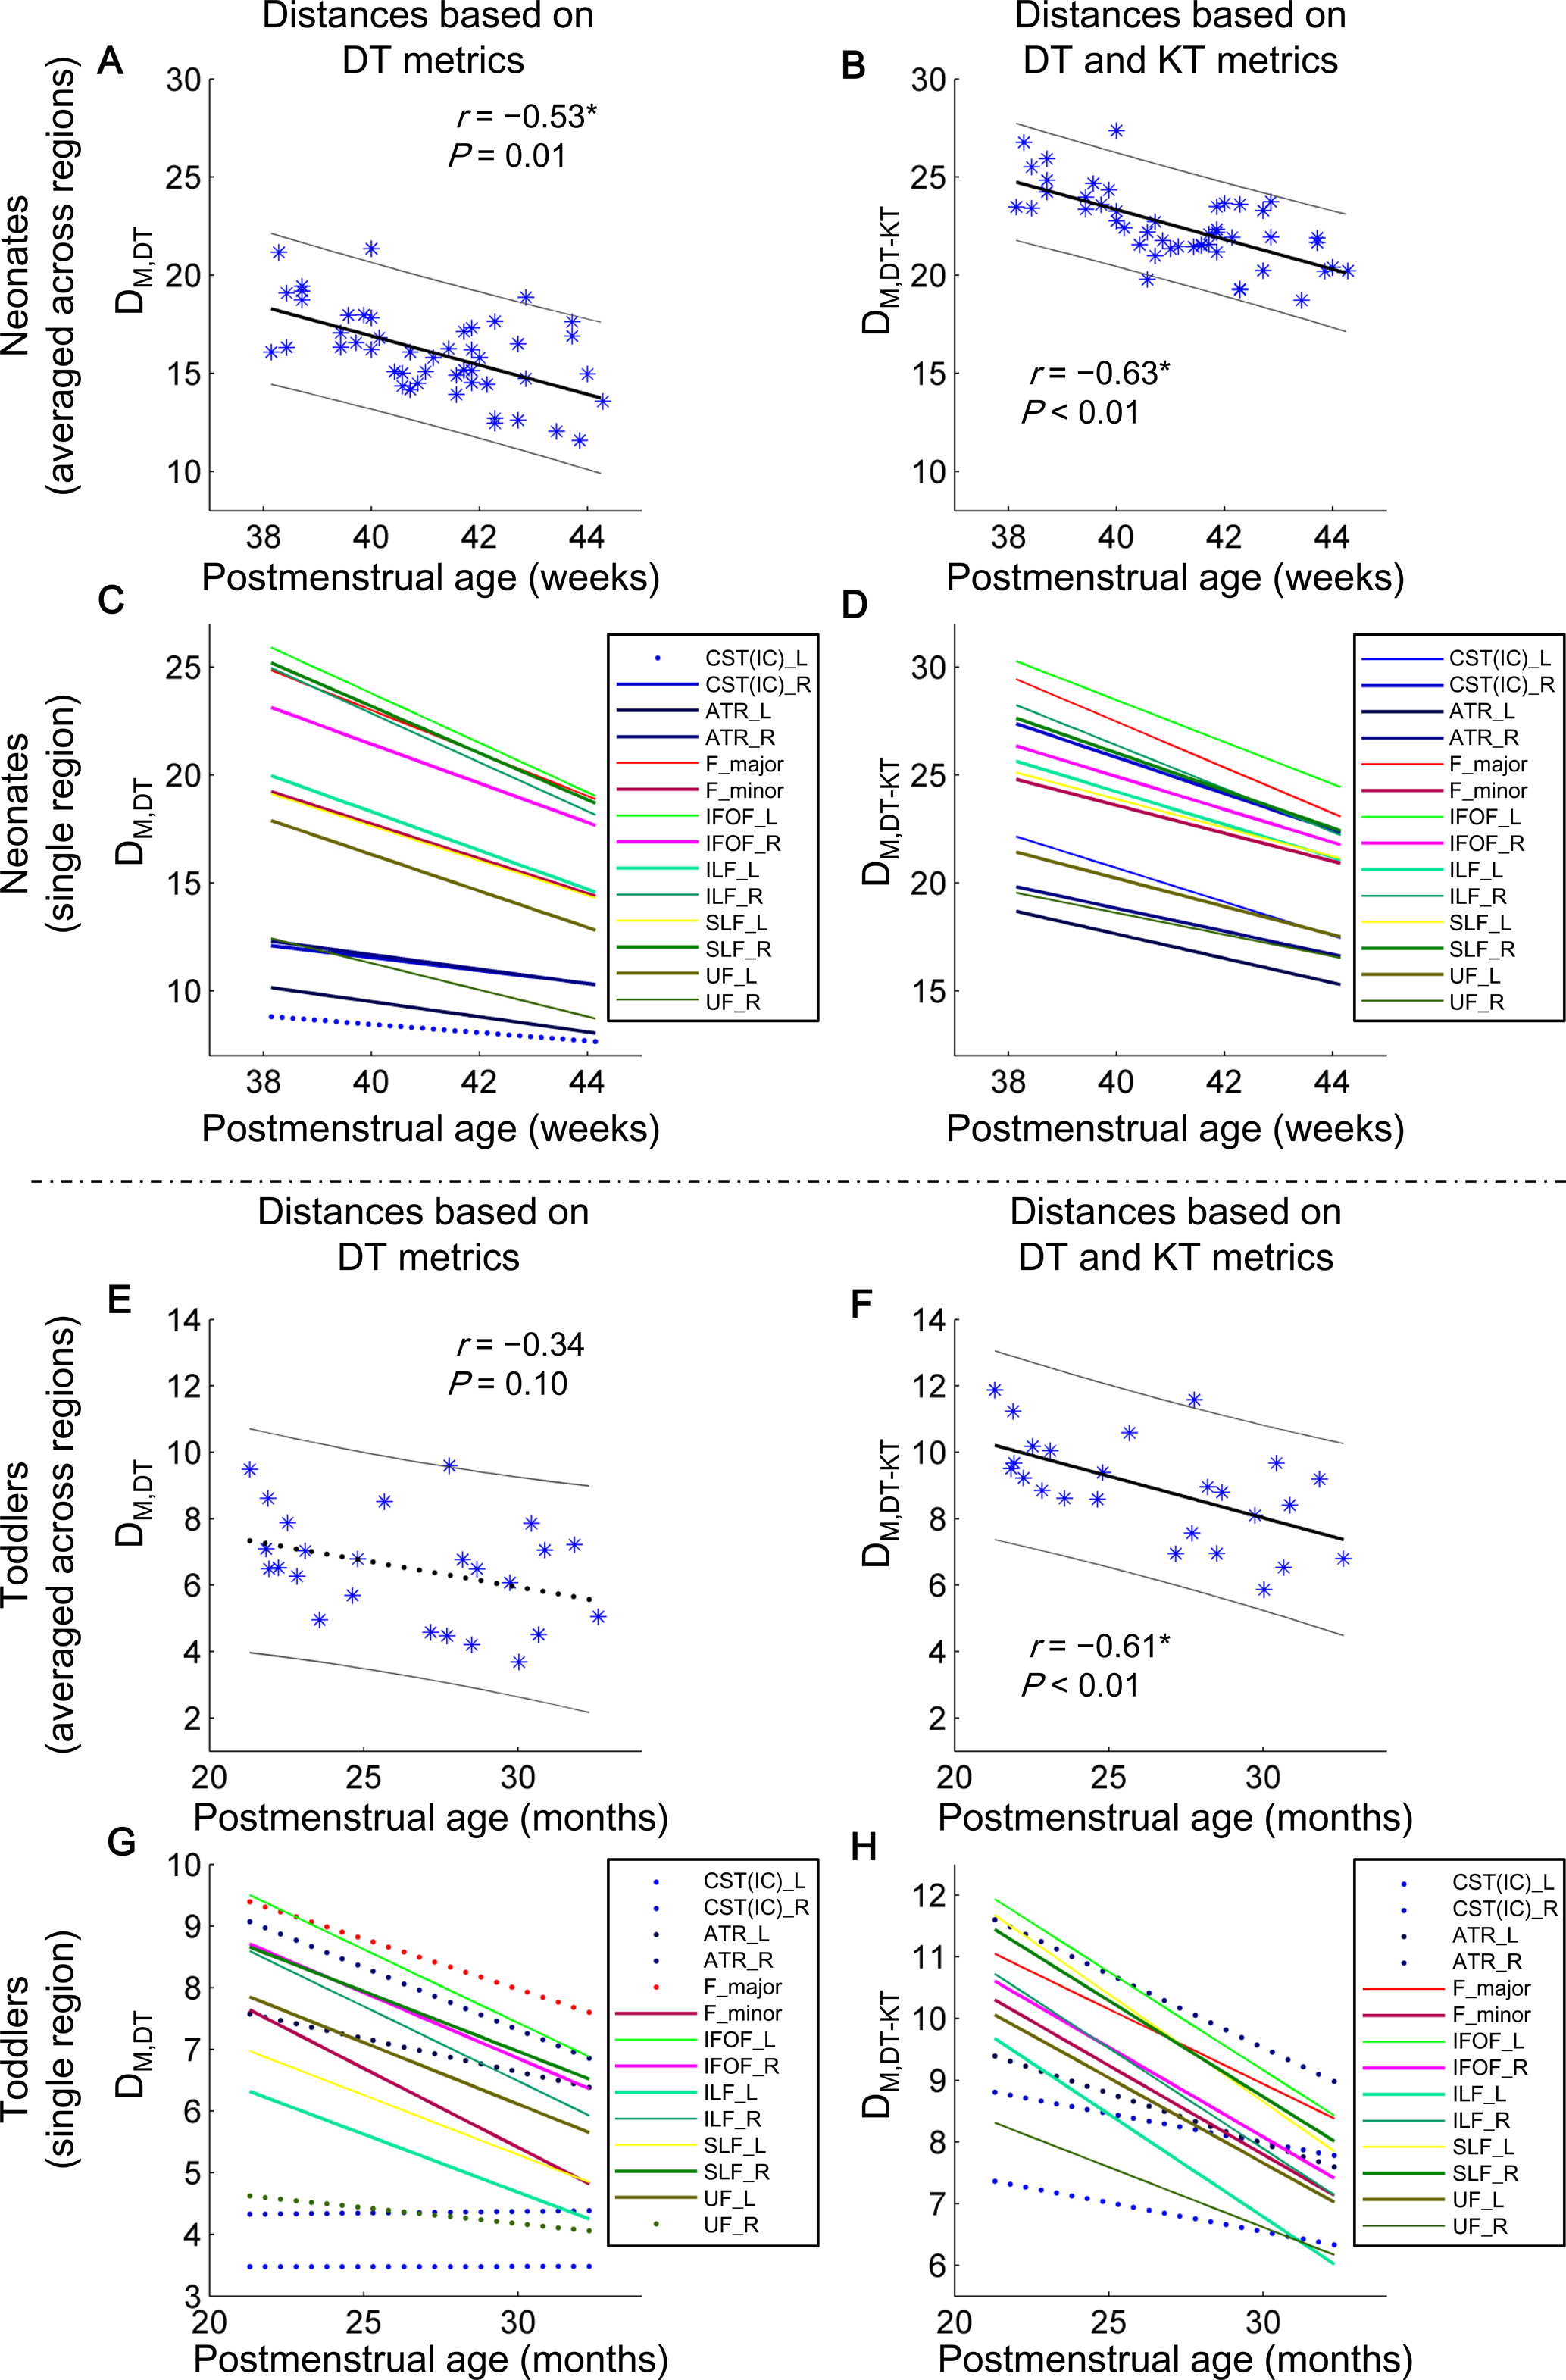
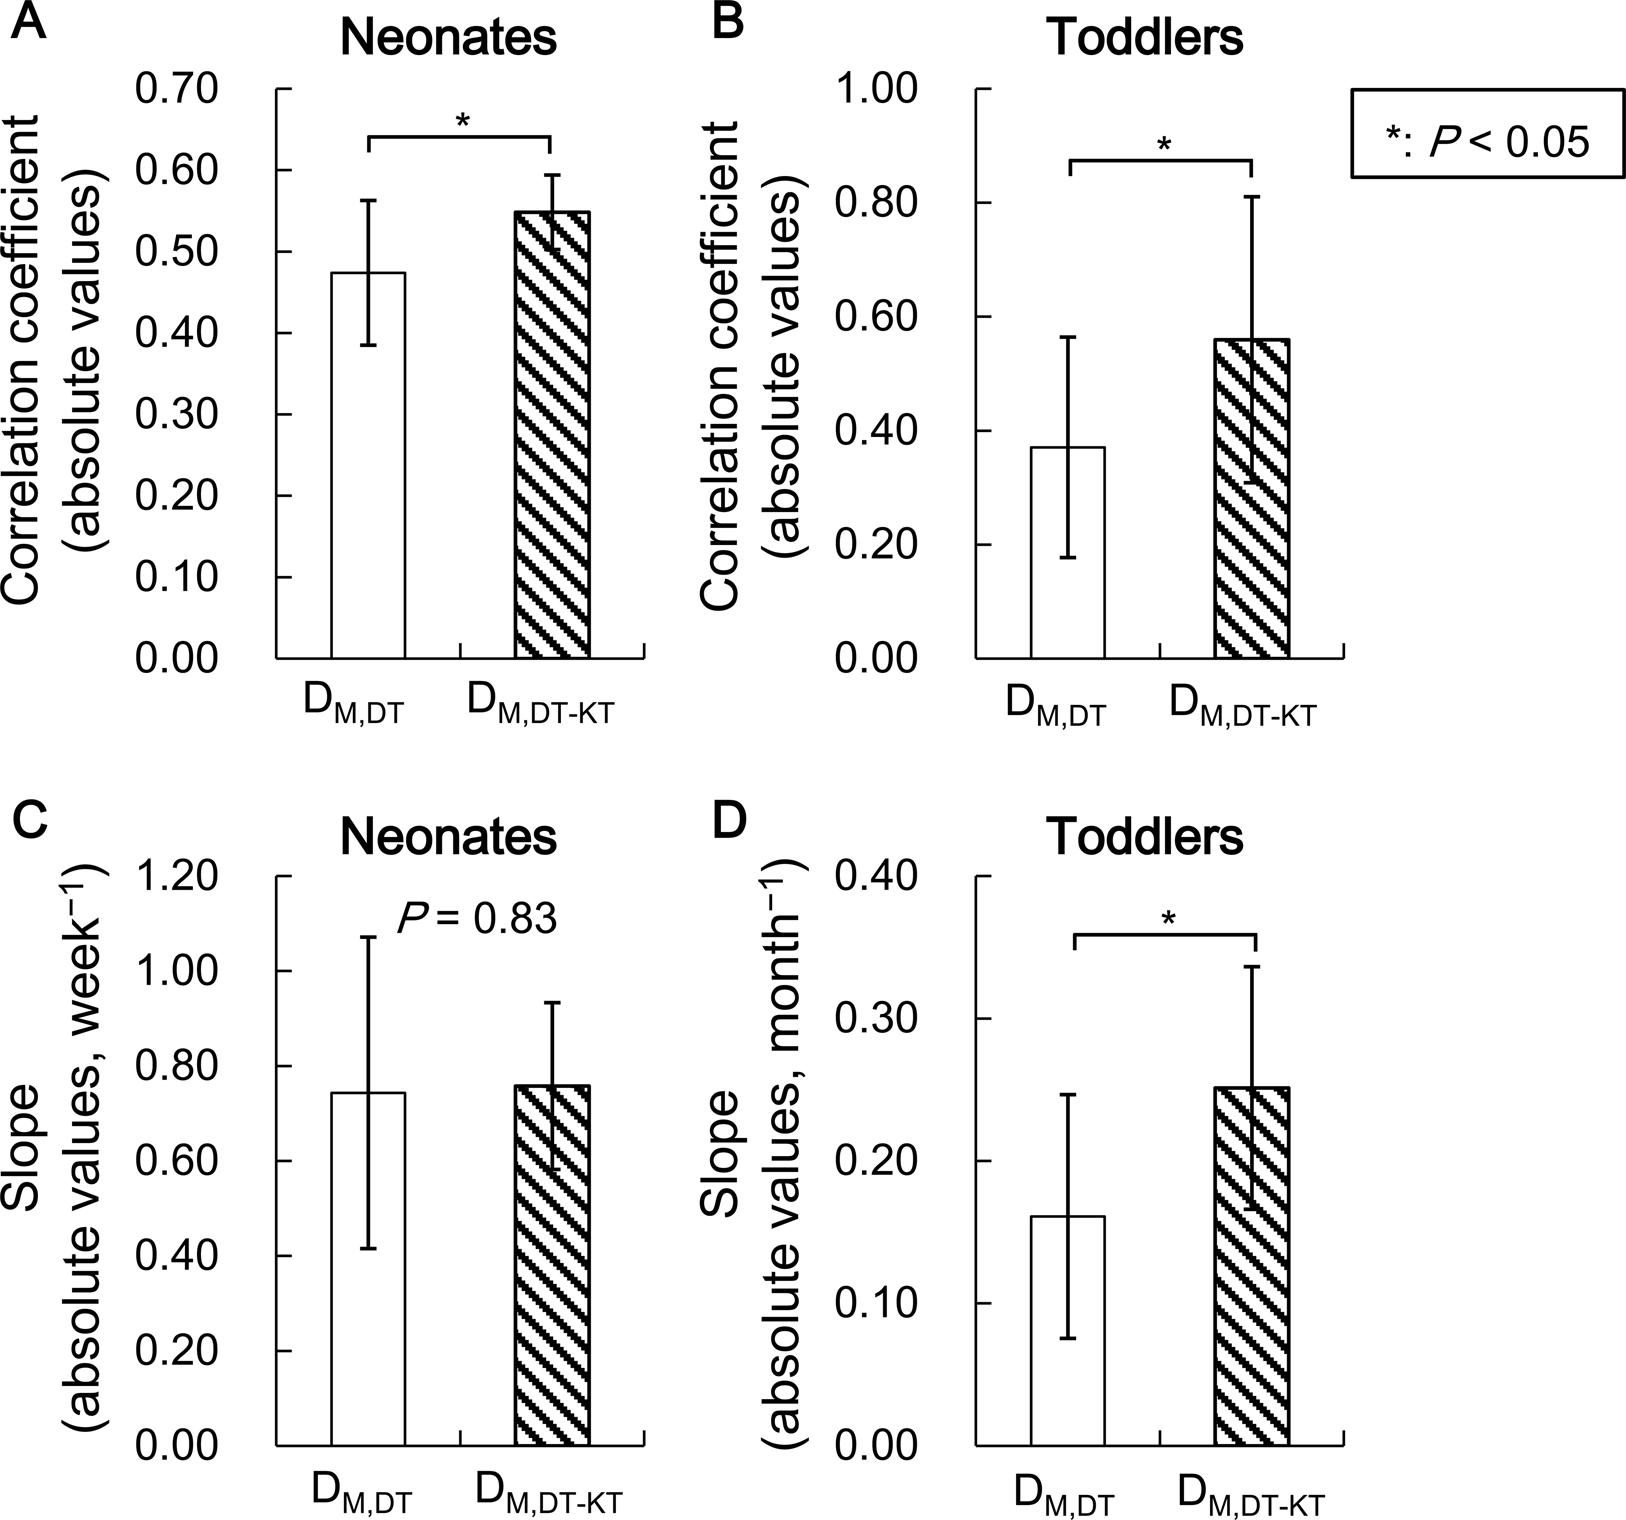
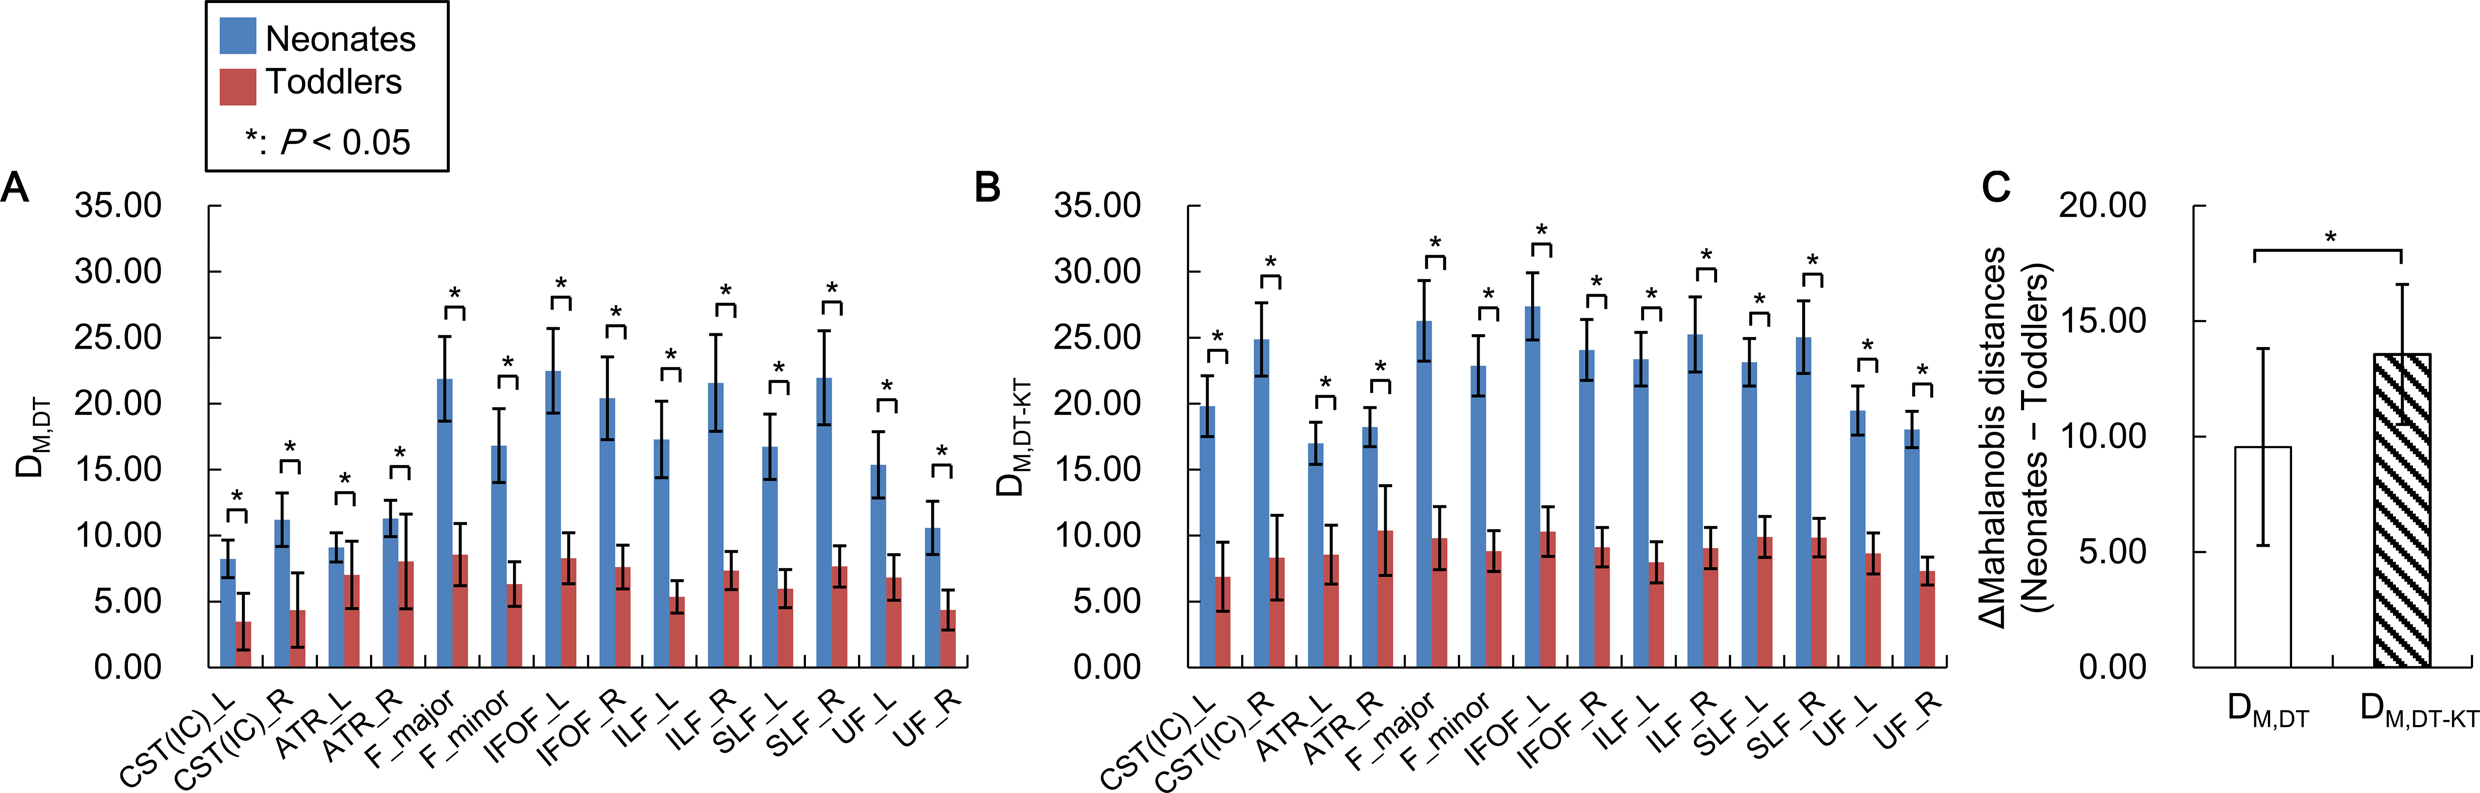
A total of 103 term subjects, including 48 neonates (males/females, 28/20; age, 3-28 days), 25 toddlers (males/females, 13/12; age, 12-23 months), and 30 adults (males/females, 13/17; age, 18-26 years) were enrolled in this study. No significant differences in the gender ratio across groups could be found (P>0.05).Significant negative correlations could be found between Mahalanobis distances and the postmenstrual age on most of the investigative white matter tracts (Figure 2). The absolute values of correlation coefficients were larger revealed by DM,DT-KT than DM,DT (Figure 3). Furthermore, more regions with significant correlations could be revealed by DM,DT-KT. DM,DT-KT demonstrated relatively higher changing speeds than DM,DT, especially on toddlers. Larger absolute changes from neonates to toddlers could be revealed by DM,DT-KT than DM,DT (Figure 4).
Discussion
Similar to results of the comparison between univariate and multivariate Mahalanobis distances [2, 3], the dependency of the Mahalanobis distance on the metric selection was also found in the comparison between DM,DT and DM,DT-KT. Regional values of DM,DT-KT were higher than those of DM,DT. The enlarged values in distances may be due to the additional information provided by KT metrics [8]. DT metrics could provide information related to microstructure alterations during the white matter development, such as oligodendrocyte proliferation and myelination [9]. Besides these developmental events, KT metrics are also sensitive to diffusion heterogeneity associated with axonal packing and/or isotropic diffusion barriers [8, 10]. Therefore, combing the DT and KT metrics could reasonably enlarge values of Mahalanobis distances. Furthermore, DM,DT-KT demonstrated larger changes from neonates to toddlers. These results may be due to the high sensitivity of KT metrics. Previous studies have found that DKI could offer more sensitive evaluation of the structural alterations during brain maturation, in comparisons with DTI [8, 11, 12]. In summary, the enlarged values and the improved sensitivity would benefit the characterization of the slowly developmental process.Conclusion
Including more metrics could improve the performance of Mahalanobis distance. Mahalanobis distance based on the combination of DT and KT metrics in DKI is powerful to characterize white matter maturation on neonates and toddlers.Acknowledgements
This study was supported by the National Natural Science Foundation of China (81901823, 81771810, and 81971581), National Key Research and Development Program of China (2016YFC0100300), the 2011 New Century Excellent Talent Support Plan of the Ministry of Education of China (NCET-11-0438), the Project Funded by China Postdoctoral Science Foundation (2019M653659), and the Natural Science Basic Research Plan in Shaanxi Province of China (2019JQ-198).References
[1] Gilmore JH, Knickmeyer RC, Gao W. Imaging structural and functional brain development in early childhood. Nat Rev Neurosci 2018;19(3):123-137.
[2] Kulikova S, Hertzpannier L, Dehaenelambertz G, Buzmakov A, Poupon C, Dubois J. Multi-parametric evaluation of the white matter maturation. Brain Struct Funct 2015;220(6):3657-3672.
[3] Iii DCD, Lange N, Travers BG, Prigge MB, Matsunami N, Kellett KA, et al. Multivariate characterization of white matter heterogeneity in autism spectrum disorder. Neuroimage Clin 2017;14(1):54-66.
[4] Jensen JH, Helpern JA. MRI quantification of non-Gaussian water diffusion by kurtosis analysis. NMR Biomed 2010;23(7):698-710.
[5] Jensen JH, Helpern JA, Ramani A, Lu H, Kaczynski K. Diffusional kurtosis imaging: the quantification of non-gaussian water diffusion by means of magnetic resonance imaging. Magn Reson Med 2005;53(6):1432-1440.
[6] Li X, Yang J, Gao J, Luo X, Zhou Z, Hu Y, et al. A robust post-processing workflow for datasets with motion artifacts in diffusion kurtosis imaging. PLoS One 2014;9(4):e94592.
[7] Li X, Gao J, Wang M, Wan M, Yang J. Rapid and reliable tract-based spatial statistics pipeline for diffusion tensor imaging in the neonatal brain: applications to the white matter development and lesions. Magn Reson Imaging 2016;34(9):1314-1321.
[8] Paydar A, Fieremans E, Nwankwo JI, Lazar M, Sheth HD, Adisetiyo V, et al. Diffusional kurtosis imaging of the developing brain. AJNR Am J Neuroradiol 2014;35(4):808-814.
[9] Ouyang M, Dubois J, Yu Q, Mukherjee P, Huang H. Delineation of early brain development from fetuses to infants with diffusion MRI and beyond. Neuroimage 2019;185:836-850.
[10] Ouyang M, Jeon T, Sotiras A, Peng Q, Mishra V, Halovanic C, et al. Differential cortical microstructural maturation in the preterm human brain with diffusion kurtosis and tensor imaging. Proc Natl Acad Sci U S A 2019;116(10):4681-4688.
[11] Grinberg F, Maximov II, Farrher E, Neuner I, Amort L, Thönneßen H, et al. Diffusion kurtosis metrics as biomarkers of microstructural development: a comparative study of a group of children and a group of adults. Neuroimage 2017;144(Pt A):12-22.
[12] Cheung MM, Hui ES, Chan KC, Helpern JA, Qi L, Wu EX. Does diffusion kurtosis imaging lead to better neural tissue characterization? A rodent brain maturation study. Neuroimage 2009;45(2):386-392.
Figures