0224
High-resolution infant cerebral blood flow map measured with 3D multi-shot, stack-of-spirals pCASL1Department of Radiology, The Children's Hospital of Philadelphia, Philadelphia, PA, United States, 2Department of Radiology, Perelman School of Medicine, University of Pennsylvania, Philadelphia, PA, United States
Synopsis
During early infancy, dramatic structural and functional maturation of infant brains requires rapid increases of regional cerebral blood flow (rCBF). In this study, we optimized a 3D multi-shot, stack-of-spirals pCASL sequence to obtain high-resolution rCBF maps at isotropic 2.5mm for infants at different maturational stages. Distinctive rCBF distribution patterns at different infant stages of 0-6 months and 7-18 months were revealed. The age-dependent trend lines of rCBF at specific regions were charted. Infant rCBF increases heterogeneously across brain regions, with rCBF increasing faster in visual, prefrontal and parietal cortices than that in precentral and thalamus during this critical period.
Purpose
Cerebral blood flow (CBF), an essential quantitative measure of brain physiology, has been shown tightly coupled with regional metabolism (e.g. 1, 2). Rapid human brain development from birth to 24 months is characterized by dramatic increases in brain size and the emergence of brain functions (3, 4). Infant brain regional CBF (rCBF) meets the metabolic needs in this maturational period. Quantifying rCBF across different brain regions may offer insight into the physiological aspects of brain maturation during this critical period. Given the small size of the infant brain, higher-resolution images are needed to delineate brain structure with an anatomical detail similar to that of adult brain images. In this study, we aimed to acquire high-resolution rCBF at isotropic 2.5mm with a state-of-the-art 3D multi-shot, stack-of-spirals pseudo-continuous arterial spin labeled (pCASL) sequence optimized for infant brains, and to delineate the growth charts of rCBF during infancy.Methods
Infant subjects and acquisition of pCASL perfusion MRI: Twelve infants (6 females, age range: 1 to 17 months) were recruited. High-resolution ASL images were acquired with a 3D multi-shot, stack-of-spirals pCASL sequence (5, 6) in a 3T Siemens Prisma system. The pCASL perfusion MRI parameters were: four-shot acquisition, field of view (FOV) = 192×192 mm2, matrix = 76×76, in-plane resolution = 2.53×2.53 mm2, 48 slices, slice thickness = 2.5 mm, no gap between slices, labeling duration = 1600ms, post labeling delay (PLD) = 1800ms, center of labeling slab located between cervical vertebrae C2 and C3, repetition time = 4s, echo time = 12ms, number of controls/labels = 10 pairs. In addition, high-resolution T1- and T2-weighted images (T1w and T2w) with a voxel size of 0.8 mm3 were acquired for anatomical guidance. rCBF quantification: rCBF were calculated using the single-compartment model (7): $$$f(x,y,z)=(6000*λ*∆M(x,y,z)*exp(PLD/T_1a ))/(2α∙M_b^0∙T_1a∙(1-exp((-LabelDur)/T_1a )))$$$ where $$$f(x,y,z)$$$ is the blood flow at voxel (x,y,z); ∆M(x,y,z) is the difference between dynamic-averaged signal intensity in control image and that in the label image at voxel (x, y, z); labeling efficiency was assumed to be 0.85, and blood T1 value of arterial blood was assumed to be 1800ms (8), $$$M_b^0$$$ values were estimated with the M0 images from the acquisition. CBF values at different brain regions: The cortical and subcortical regions of interests (ROIs) of each infant in the native CBF space were obtained by transferring the parcellated regions from JHU brain atlas (9) using the contrasts of T1w to drive the registration. Briefly, infants’ T1w images were first registered to their M0 images in the native CBF space. Then, a 12-parameter affine registration transformed the co-registered T1w image of each infant to the template T1w image in the JHU atlas space, followed by a non-linear transformation. The atlas labels were mapped to the infants’ native space using the inverse transformations. Registration procedures were conducted using DiffeoMap software (www.mristudio.org). Averaged rCBF values at selected regions and whole brain were correlated with subject age using linear regression.Results
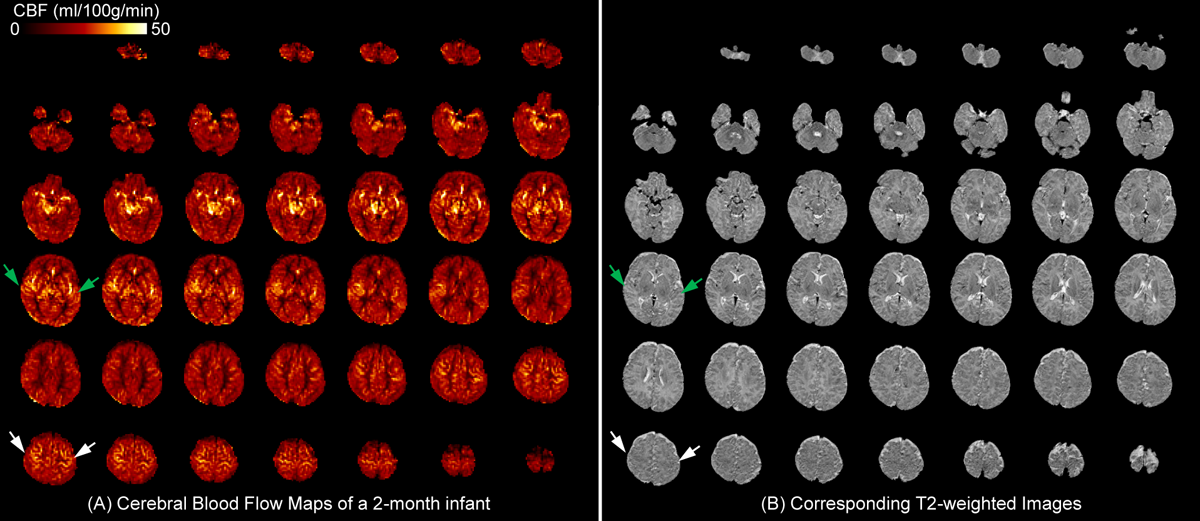
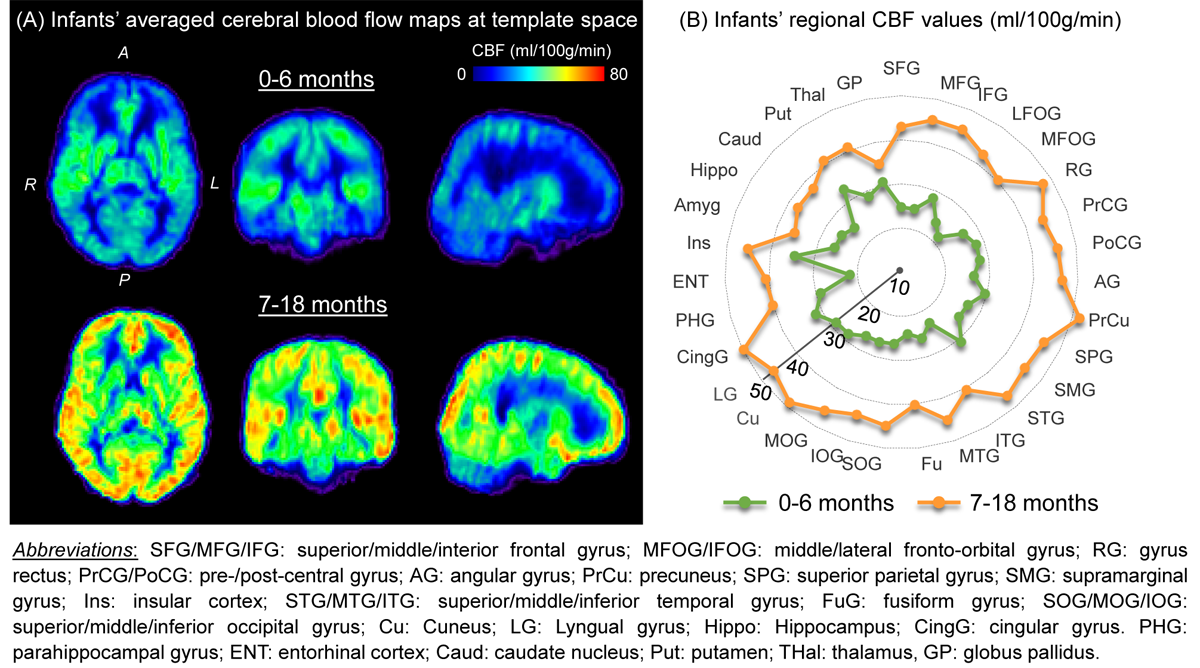
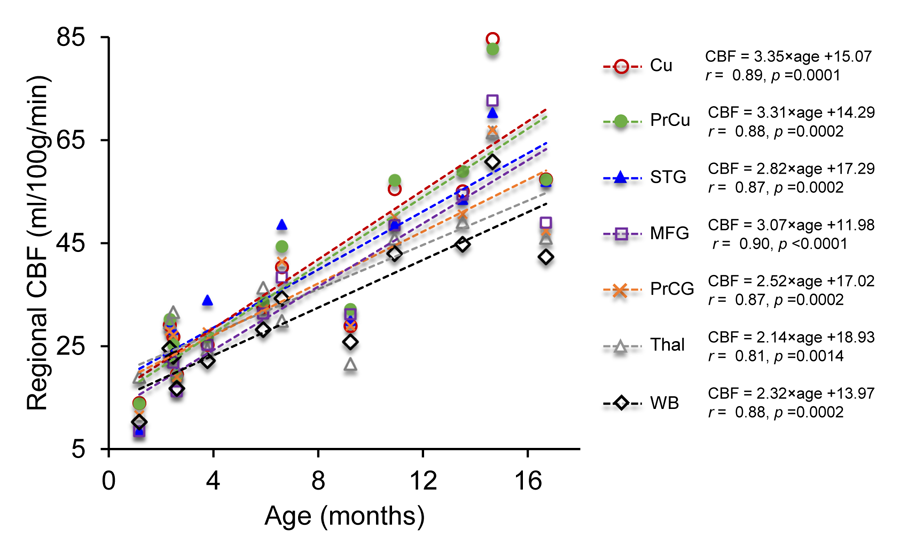
Fig. 1A shows the high-resolution rCBF maps, with densely acquired axial slices, from a representative infant aged 2months. Regional heterogeneity can be clearly seen from the rCBF maps. For instance, high rCBF values are found in the deep grey matter (GM), superior temporal (green arrows) and pre-/post-central (white arrows) regions with T2w images shown in Fig. 1B as anatomical reference. Such rCBF distribution pattern can be easily appreciated after mapping to the infant’s cortical surface, with high rCBF values prominent at primary auditory/sensorimotor cortices (green/white arrows in Fig. 2) and low rCBF values in frontal and parietal cortices. To demonstrate the distinctive but also rapidly changing rCBF patterns during early infancy, twelve infants were separated into two groups based on their ages (0-6months and 7-18months). The younger group kept the similar rCBF distribution as that of the 2-month infant shown in Fig. 1-2, characterized by high rCBF values in deep GM and primary sensorimotor regions (upper panel of Fig. 3A). The 7-18month group had a different rCBF pattern, with high rCBF values in parietal, frontal and occipital lobes (lower panel of Fig 3A). The overall rCBF increased significantly between these two groups, and their averaged rCBF values across brain regions are provided in Fig. 3B. We further illustrate the heterogeneous rCBF increases in early infancy for six selected brain regions (Fig. 4). Notably, rCBF seems to increase faster in cuneus, precuneus, middle frontal, and superior temporal gyri compared to the precentral gyrus, thalamus and averaged whole brain.Discussion and conclusion
High-resolution pCASL make it possible to delineate the rCBF distribution in infant brains despite of their small size. Regional CBF distribution patterns differ even within the limited time period examined in this study. In infants under 6 months, high rCBF values at deep GM and pre-/post-central gyri suggest earlier maturation in these regions. We also found that rCBF increases rapidly and heterogeneously across brain regions. The heterogeneous rCBF maturation pattern may underlie the regionally differentiated metabolic needs that drive increases in blood supply during infant development. Acquisition of more infant pCASL data is underway, and the differences of rCBF maturation rates across regions will be further tested with larger samples.Acknowledgements
This study is funded by NIH MH092535, MH092535-S1, HD086984 and HD093776.References
[1] Fox, P.T. and Raichle, M.E., 1986. Focal physiological uncoupling of cerebral blood flow and oxidative metabolism during somatosensory stimulation in human subjects. Proc Natl Acad Sci USA 83(4):1140-1144.
[2] Vaishnavi, S.N., Vlassenko, A.G., Rundle, M.M., Snyder, A.Z., Mintun, M.A. and Raichle, M.E., 2010. Regional aerobic glycolysis in the human brain. Proc Natl Acad Sci USA, 107(41): 17757-17762.
[3] Pfefferbaum A, Mathalon DH, Sullivan EV, Rawles JM, Zipursky RB, Lim KO, 1994. A quantitative magnetic resonance imaging study of changes in brain morphology from infancy to late adulthood. Arch Neurol 51(9): 874-887.
[4] Ouyang M, Dubois J, Yu Q, Mukherjee P, Huang H, 2019. Delineation of early brain development from fetuses to infants with diffusion MRI and beyond. Neuroimage, 185: 836-850.
[5] Chang YV, Vidorreta M, Wang Z, Detre JA, 2017. 3D-Accelerated, Stack-of-Spirals acquisitions and reconstruction of arterial spin labeling MRI. Magn Reson Med 78:1405-1419.
[6] Vidorreta M, Wang Z, Chang YV, Wolk DA, Ferandez-Seara MA, Detre JA, 2017. Whole-brain background suppressed pCASL MRI with 1D-accelerated 3D RARE stack-of-spirals readout. PLoS one 12(8): e0183762.
[7] Alsop DC, Detre JA, Golay X, Günther M, Hendrikse J, Hernandez-Garcia L, Lu H, et al, 2015. Recommended implementationof arterial spin-labeled perfusion MRI for clinical applications: a consensus of the ISMRM perfusion study group and the European consortium for ASL in dementia. Magn Reson Med 73:102–116.
[8] Varela M, Hajnal JV, Petersen ET, Golay X, Merchant N, Larkman DJ, 2011. A method for rapid in vivo measurement of blood T1. NMR Biomed. 24: 80–88.
[9] Oishi K, Faria A, Jiang H, Li X, Akhter K, Zhang J, et al, 2009. Atlas-based whole brain white matter analysis using large deformation diffeomorphic metric mapping: application to normal elderly and Alzheimer's disease participants. Neuroimage, 46(2): 486-499.
Figures