0223
Hierarchical complexity of the neonatal brain1University of Edinburgh, Edinburgh, United Kingdom, 2Royal Hospital for Sick Children, Edinburgh, United Kingdom
Synopsis
Preterm birth is associated with long term cognitive deficits and alterations to structural connectivity of developing brain networks. Diversity of connectivity patterns within hierarchically equivalent nodes (hierarchical complexity, HC), is a prominent feature of the adult human connectome. In this work, we show that HC of the structural connectome at birth shares similar properties to HC seen in the adult connectome. Infants born preterm have different HC to infants born at term. In addition, we show that high-level order may be necessary to create structural stability, and this high-level order is resilient to environmental challenges such as preterm birth.
Introduction
Preterm birth is associated with long term cognitive deficits and alterations to structural connectivity of developing brain networks. Global network characteristics that model topological properties of brain regions and the connections between them reveal architectures that are shared across the life course. These include small-worldness, clustering coefficient or rich-club coefficient1-3. In recent work, it was shown that a rich diversity of connectivity patterns within hierarchically equivalent nodes (hierarchical complexity, HC)4, is a prominent feature of the adult human connectome and not a general property of real-world networks like several of the other standard global network metrics5. We aimed to determine whether the neonatal connectome shares similar HC properties to those observed in adulthood, and if so, whether HC is altered in association with early exposure to extrauterine life caused by preterm birth.Methods
Neonatal dataset: 136 neonates (77 preterm and 59 term) underwent MRI at term equivalent age at the Edinburgh Imaging Facility Royal Infirmary of Edinburgh. A Siemens MAGNETOM Prisma 3 T MRI clinical scanner (Siemens Healthcare Erlangen, Germany) and 16-channel phased-array paediatric head coil were used to acquire: 3D T2-weighted SPACE (T2w) (voxel size = 1mm isotropic) and axial dMRI with volumes/b = 3/200, 6/500, 64/750 and 64/2500 s/mm2 and 16 non-weighted images (2mm isotropic).Adult dataset: The HCP test-retest dataset consisting of T1-weighted and DW-MRI data from 45 healthy subjects. The data consist of three shells with b = 1,000, 2,000 and 3,000 s/mm2 in 90 DW volumes and six non-weighted images per shell (1.25 mm isotropic).
Processing: The neonatal dMRI volumes were denoised6; the eddy current, head movement and EPI geometric distortions were corrected7-9, and bias field inhomogeneity correction was applied10. The T2w images were processed using the minimal processing pipeline of the dHCP11. For parcellation, ten manually labelled subjects of the M-CRIB atlas12 were registered to the bias field corrected T2w using affine and SyN13, and then the registered labels of the ten atlases were merged using joint label fusion14 resulting in 84 ROIs. The HCP dataset was already preprocessed, with the Desikan-Killany parcellation15, 16.
Tractography was performed using CSD with multi-tissue response function, using ACT and SIFT217-21. The resulting matrices were then thresholded to a density of 0.3 and binarized.
Hierarchical complexity: Let $$$G=(V,E)$$$ be a graph with nodes $$$V=\left\{1,…,n\right\}$$$ and links $$$E=\left\{(i,j):i,j ∈V)\right\}$$$, and let $$$K=\left\{k_1,…,k_n\right\}$$$ be the set of degrees of $$$G$$$, where $$$k_i$$$ is the number edges adjacent to node $$$i$$$. Further, let $$$K_p$$$ be the set of nodes of degree $$$p$$$. For neighbourhood degree sequence $$$s_i^p \left\{s_i^p (1),…,s_i^p (p)\right\}$$$ of node $$$i$$$ of degree $$$p$$$, the HC is: $$R= \frac{1}{D} \sum_{k_p,|k_p |>1}\frac{1}{p(|k_p |-1)}(\sum_{j-1}^p(\sum_{i\epsilon k_p}(s_i^p (j)-μ^p (j))^2))$$ where $$$D$$$ is the number of distinct degrees in the network and $$$\mu^p(j)$$$ is the mean of the $$$j$$$th entries of all $$$p$$$ length neighbourhood degree sequences22.
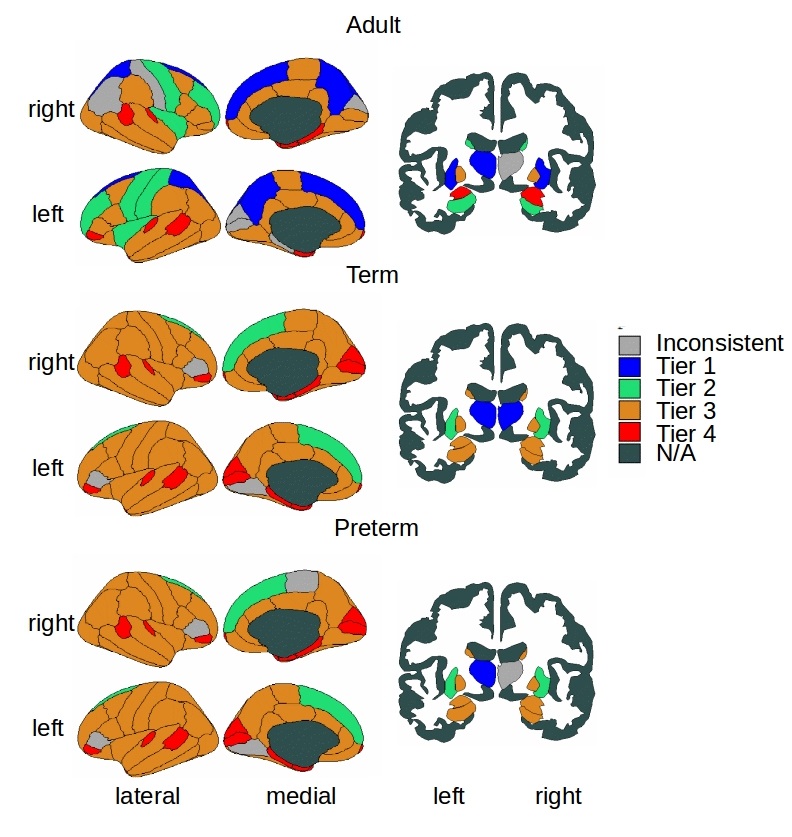
Tier analysis: A more refined analysis of HC was performed through different degree strengths in the network. The tiers were chosen based on peaks of the group-aggregated degree distributions, 4 tiers were chosen in each population (1-4) and were combined then into 3 Tiers (A-C) to be able to compare neonates and adults. Once tiers were defined, we implemented tier-based analysis comparing Tiers 1-4 between term and preterm born and A-C between neonates and adults.
Statistical analysis: To control for the differences in degree distribution between individual connectomes and the different populations (term and preterm born and adult), we used configuration models23. Wilcoxon rank sum tests were carried out to assess the significance of the differences of distributions of network index values between the structural connectomes and configuration models. FDR threshold was 0.0264. The effect sizes were computed with Cohen's .
Results
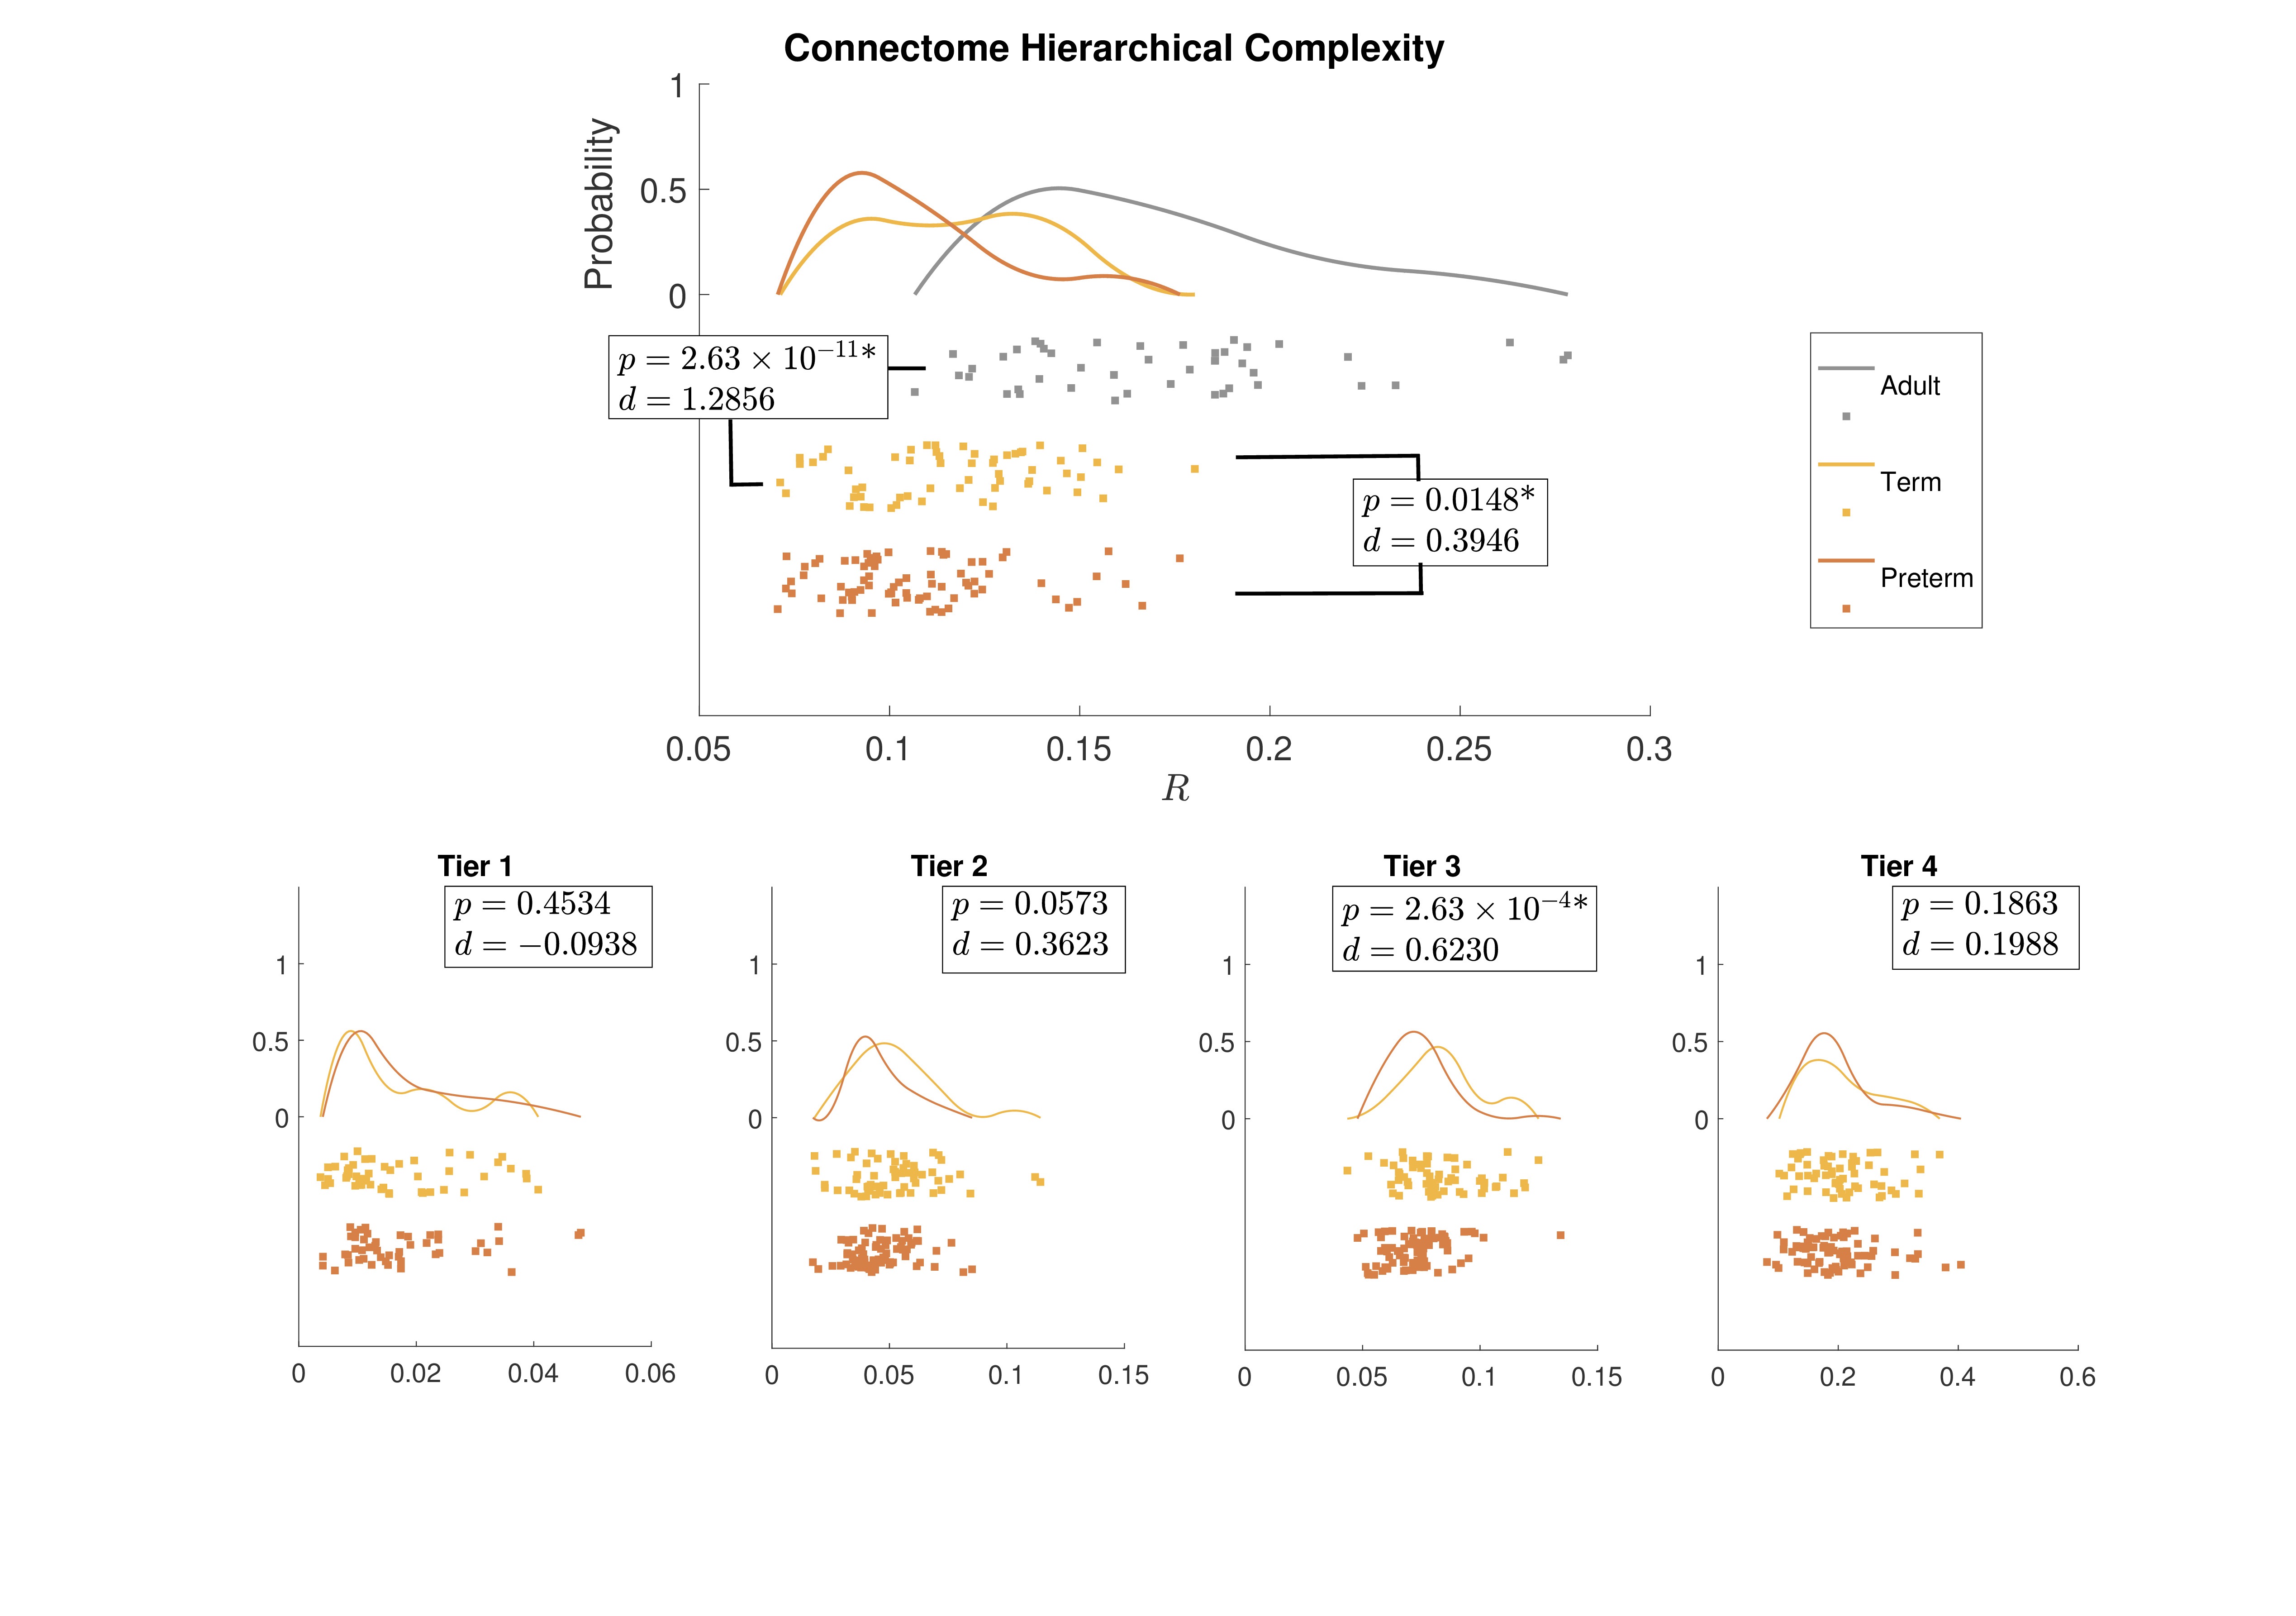
Figure 1 shows group-aggregated degree distributions.HC was significantly larger in term-born neonates than preterm-born neonates (p = 0.0148, d = 0.3946). Tier 3 showed a corresponding significant difference in HC with a stronger effect size (p = 2.63×10⁻⁴, d = 0.6230), while no difference was evident in any other tier. Tier 3 is the largest and is a distributed network of heterogenous neural systems (Fig 2). Global HC of adults was larger than term born neonates (p = 2.63×10⁻¹¹, d = 1.2859) (Fig 3). The findings were confirmed in comparisons with configuration models with term-born connectomes having significantly larger HC than their configuration models, effect which was not seen in preterm infants (Fig 4).
Discussion
Hierarchical complexity of the structural connectome at birth shares similar properties to HC seen in the adult connectome. Infants born preterm have different HC to infants born at term, and this is driven predominantly by differences in Tier 3. Interestingly, Tier A shows lower HC than a random network, indicating that the high levels of hierarchy present a highly organized structure. These findings are in agreement with intuitive notions of natural and human hierarchies: high-level order may be necessary to create structural stability, and this high-level order is resilient to environmental challenges such as preterm birth. Because HC patterns align with diversity of functional roles across the brain, alterations in HC of the structural connectome observed in preterm infants could contribute to the prevalence of cognitive impairment experienced by people born preterm.Acknowledgements
Data were provided [in part] by the Human Connectome Project, WU-Minn Consortium (Principal Investigators: David Van Essen and Kamil Ugurbil; 1U54MH091657) funded by the 16 NIH Institutes and Centers that support the NIH Blueprint for Neuroscience Research; and by the McDonnell Center for Systems Neuroscience at Washington University. Individual parcellated templates and structural MRI images from the M-CRIB atlas were supplied by the Murdoch Children’s Research Institute.
This work was supported by Theirworld (www.theirworld.org) and by Health Data Research UK (MRC ref Mr/S004122/1), which is funded by the UK Medical Research Council, Engineering and Physical Sciences Research Council, Economic and Social Research Council, National Institute for Health Research (England), Chief Scientist Office of the Scottish Government Health and Social Care Directorates, Health and Social Care Research and Development Division (Welsh Government), Public Health Agency (Northern Ireland), British Heart Foundation and Wellcome. MJT was supported by NHS Lothian Research and Development Office. Part of the work was undertaken in the MRC Centre for Reproductive Health, which is funded by MRC Centre Grant (MRC G1002033). Participants were scanned in the University of Edinburgh Imaging Research MRI Facility at the Royal Infirmary of Edinburgh which was established with funding from The Wellcome Trust, Dunhill Medical Trust, Edinburgh and Lothians Research Foundation, Theirworld, The Muir Maxwell Trust and many other sources.We are grateful to the families who consented to take part in the study and to all the University’s imaging research staff for providing the infant scanning.References
1 M. P. Van Den Heuvel, K. J. Kersbergen, M. A. De Reus, K. Keunen, et al., The neonatal connectome during preterm brain development, Cerebral Cortex 25 (2015) 3000–3013
2 D. Batalle, E. J. Hughes, H. Zhang, J.-D. Tournier, N. Tusor, others., Early development of structural networks and the impact of prematurity on brain connectivity, NeuroImage 149 (2017) 379–392.
3 G. Ball, P. Aljabar, S. Zebari, N. Tusor, T. Arichi, N. Merchant, E. C. Robinson, E. Ogundipe, D. Rueckert, A. D. Edwards, S. J. Counsell, Rich-club organization of the newborn human brain, Proceedings of the National Academy of Sciences 111 (2014) 7456–7461.
4 K. Smith, M. Bastin, S. Cox, M. Valdes-Hernandez, S. Wiseman, J. Escudero, C. Sudlow, Hierarchical complexity of the adult human structural connectome, Neuroimage 191 (2019) 205–215.
5 K. Smith, On neighbourhood degree sequences of complex networks, Scientific Reports 9 (2019) 8340.
6 J. Veraart, D. S. Novikov, D. Christiaens, B. Ades-aron, J. Sijbers, E. Fieremans, Denoising of diffusion MRI using random matrix theory, NeuroImage 142 (2016b) 394–406
7 J. L. Andersson, S. N. Sotiropoulos, An integrated approach to correction for off-resonance effects and subject movement in diffusion MR imaging, NeuroImage 125 (2016) 1063–107
8 J. L. Andersson, M. S. Graham, E. Zsoldos, S. N. Sotiropoulos, Incorporating outlier detection and replacement into a non-parametric framework for movement and distortion correction of diffusion MR images, NeuroImage 141 (2016) 556–572.
9 J. L. Andersson, M. S. Graham, I. Drobnjak, H. Zhang, N. Filippini, M. Bastiani, Towards a comprehensive framework for movement and distortion correction of diffusion MR images: Within volume movement, NeuroImage 152 (2017) 450–466.
10 N. J. Tustison, B. B. Avants, P. A. Cook, Y. Zheng, A. Egan, P. A. Yushkevich, J. C. Gee, N4ITK: Improved N3 bias correction, IEEE Transactions on Medical Imaging 29 (2010) 1310–1320.
11 A. Makropoulos, E. C. Robinson, A. Schuh, R. Wright, S. Fitzgibbon, et al., The developing human connectome project: A minimal processing pipeline for neonatal cortical surface reconstruction, NeuroImage 173 (2018) 88–112
12 B. Alexander, A. L. Murray, W. Y. Loh, L. G. Matthews, C. Adamson, R. Beare, J. Chen, C. E. Kelly, S. Rees, S. K. Warfield, P. J. Anderson, L. W. Doyle, A. J. Spittle, J. L. Cheong, M. L. Seal, D. K. Thompson, A new neonatal cortical and subcortical brain atlas: the melbourne children’s regional infant brain (m-crib) atlas, NeuroImage 147 (2017) 841 – 851.
13 B. Avants, C. Epstein, M. Grossman, J. Gee, Symmetric diffeomorphic image registration with cross-correlation: Evaluating automated labeling of elderly and neurodegenerative brain, Medical Image Analysis 12 (2008) 26 – 41. Special Issue on The Third International Workshop on Biomedical Image Registration WBIR 2006.
14 H. Wang, J. W. Suh, S. R. Das, J. B. Pluta, C. Craige, P. A. Yushkevich, Multi-atlas segmentation with joint label fusion, IEEE Transactions on Pattern Analysis and Machine Intelligence 35 (2013) 611–623
15 M. F. Glasser, S. N. Sotiropoulos, J. A. Wilson, T. S. Coalson, B. Fischl, J. L. Andersson, J. Xu, S. Jbabdi, M. Webster, J. R. Polimeni, D. C. V. Essen, M. Jenkinson, The minimal preprocessing pipelines for the human connectome project, NeuroImage 80 (2013) 105 – 124. Mapping the Connectome.
16 R. S. Desikan, F. Sgonne, B. Fischl, B. T. Quinn, B. C. Dickerson, D. Blacker, R. L. Buckner, A. M. Dale, R. P. Maguire, B. T. Hyman, M. S. Albert, R. J. Killiany, An automated labeling system for subdividing the human cerebral cortex on mri scans into gyral based regions of interest, NeuroImage 31 (2006) 968 – 980
17 J.-D. Tournier, F. Calamante, A. Connelly, Robust determination of the fibre orientation distribution in diffusion mri: Non-negativity constrained super-resolved spherical deconvolution, NeuroImage 35 (2007) 1459 – 1472.
18 T. Dhollander, D. Raffelt, A. Connelly., Unsupervised 3-tissue response function estimation from single-shell or multi-shell diffusion mr data without a co-registered t1 image., in: ISMRM Workshop on Breaking the Barriers of Diffusion MRI.
19 B. Jeurissen, J.-D. Tournier, T. Dhollander, A. Connelly, J. Sijbers, Multi-tissue constrained spherical deconvolution for improved analysis of multi-shell diffusion mri data, NeuroImage 103 (2014) 411 – 426
20 R. E. Smith, J.-D. Tournier, F. Calamante, A. Connelly, Anatomically-constrained tractography: Improved diffusion mri streamlines tractography through effective use of anatomical information, NeuroImage 62 (2012) 1924 – 1938.
21 R. E. Smith, J.-D. Tournier, F. Calamante, A. Connelly, Sift2: Enabling dense quantitative assessment of brain white matter connectivity using streamlines tractography, NeuroImage 119 (2015) 338 – 351.
22 K. Smith, J. Escudero, The complex hierarchical topology of eeg functional connectivity, Journal of Neuroscience Methods 276 (2017) 1–12.
23 S. Maslov, K. Sneppen, Specificity and stability in topology of protein networks, Science 910 (2002) LP–913.
Figures