0222
THE NEONATAL PRETERM BRAIN: A CONNECTOME ANALYSIS1Department of Women-Children-Teenagers, Hôpitaux Universitaires de Genève, Genève, Switzerland, 2Institute of Mathematics, Ecole Polytechnique Fédérale de Lausanne, Lausanne, Switzerland, 3Institute of Bioengineering, Ecole Polytechnique Fédérale de Lausanne, Lausanne, Switzerland, 4Department of Radiology and Medical Informatics, CIBM, University of Geneva, Genève, Switzerland
Synopsis
Prematurity disrupts brain maturation during a critical period of development, leading to structural brain alterations that might underlie the observed later neurodevelopmental impairments in preterm children. Using diffusion MRI based whole-brain constrained spherical deconvolution tractography, we constructed structural connectomes to study the impact of prematurity on neonatal brain network organization at term-equivalent age. We found that, globally, in comparison to full-term infants, structural networks of very-preterm infants at term showed an increased segregation and decreased capacity to integrate information across brain regions and, in particular, a diminished connectivity strength in subnetworks localized mainly in frontal, limbic and para-limbic regions.
INTRODUCTION
The third trimester of gestation is characterized by a rapid brain growth, neurogenesis1-4 and the emergence of large-scale brain networks.5-8 Preterm birth disrupts brain maturation during a critical period of brain development,9,10 leading to brain structural alterations which might be at the origin of the later neurodevelopmental impairments observed in preterm infants.11-18 However, there is limited knowledge on whole-brain structural alterations present in preterm infants at term-equivalent age when compared to full-term born infants. Diffusion-weighted imaging MRI allows in vivo visualisation and quantification of white matter microstructure and study of whole-brain structural connectivity. Using a whole-brain connectome approach, we aimed to study the impact of prematurity on neonatal brain structural network organization at term-equivalent age.METHODS
13 full-term (FT) and 24 very preterm newborns at term-equivalent age (VPT-TEA) underwent an MRI (3T Siemens Prisma) examination including diffusion tensor imaging (DTI) (TE=84ms, TR=7400ms, voxel size 2x2x2mm3, gradient applied in 30 non-collinear directions with b-value 1000 s/mm2 and one non-diffusion weighted image) and T2-weighted image (TE=151ms, TR= 4990ms, voxel size 0.8x0.8x1.2mm3) acquisitions. The T2-weighted brain volumes were bias corrected, skull striped and tissue segmented into white matter (WM), grey matter (GM), deep grey matter (DGM), cerebrospinal fluid (CSF) and cerebellum using a neonatal-specific segmentation algorithm.19 Parcellation into cortical and subcortical regions was obtained using the advanced normalization tools (ANTs) (http://picsl.upenn.edu/software/ants) to propagate the UNC neonatal brain atlas20 into each subject's native space, producing a total of 90 regions, which represents the nodes of the structural networks. Diffusion data were preprocessed using FSL v5.0.10 diffusion toolbox21,22 and distortions caused by motion and eddy currents were corrected using EDDY function adapted for neonatal data.23,24 Whole-brain tractograms were generated using probabilistic single-shell, single tissue constrained spherical deconvolution (SSST-CSD) tracking, performed using MRtrix325 iFOD2, anatomically constrained tractography (ACT) and backtrack re-tracking algorithms, with streamlines seeded dynamically throughout the WM, producing 1000 million streamlines per subject. The reconstructed data was then further processed using spherical-deconvolution informed filtering of tractograms (SIFT1) algorithm, producing for each subject 10 million streamlines. The resulting set of streamlines were combined with the anatomical node parcellation images, in order to construct, per subject, the structural brain network, an 90x90 interregional connectivity matrix, which were evaluated as binary or weighted by the number of streamline counts (SC) and fractional anisotropy (FA). Graph theoretical analysis of weighted connective matrices was performed using Brain Connectivity Toolbox (BCT) for Matlab.26 Differences between groups were accessed with the non-parametric Mann–Whitney U test using IBM SPSS Statistics. In order to evaluate structural connectivity strength differences between groups, we performed hypothesis tests at the connection level with false discovery rate (FDR) control with 100.000 random permutations.27,28 Additionally, we identified the hubs for each group using the group binary representative matrix, where hubs were defined as the nodes with degree superior to the average nodal degree plus 1 standard deviation.RESULTS AND DISCUSSION
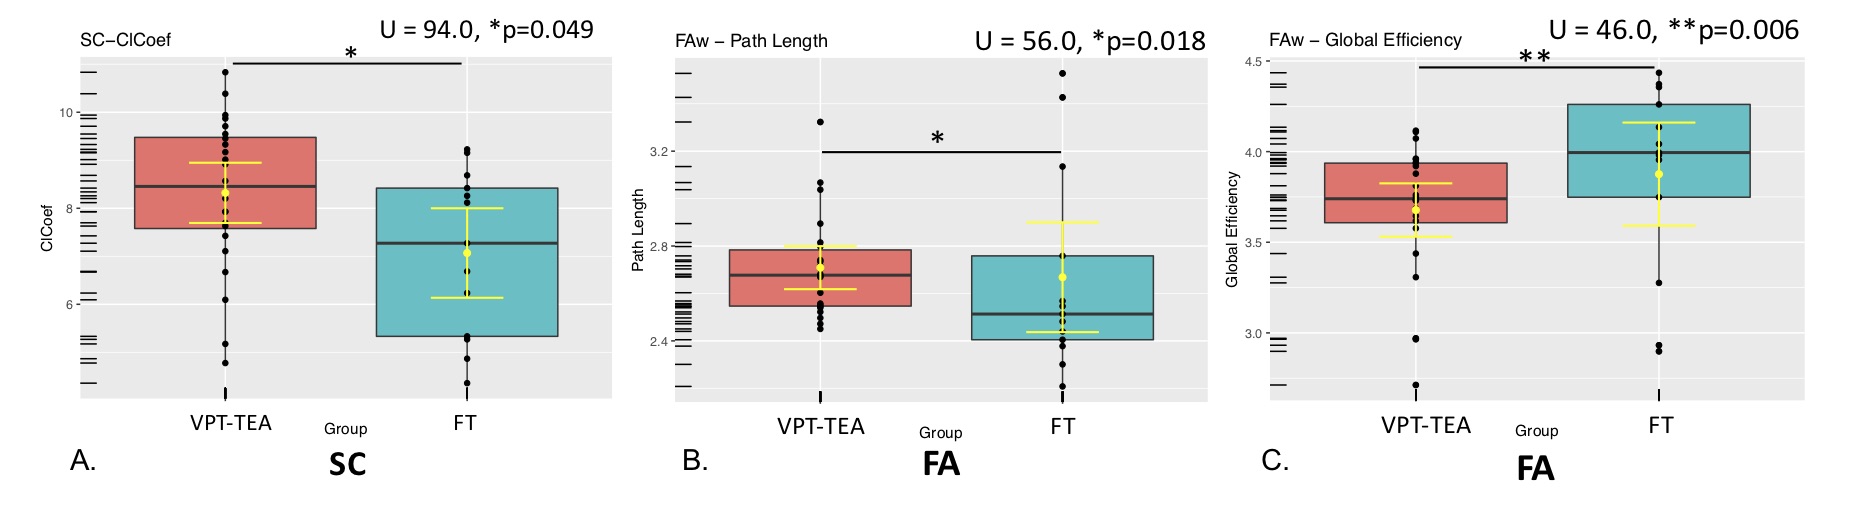
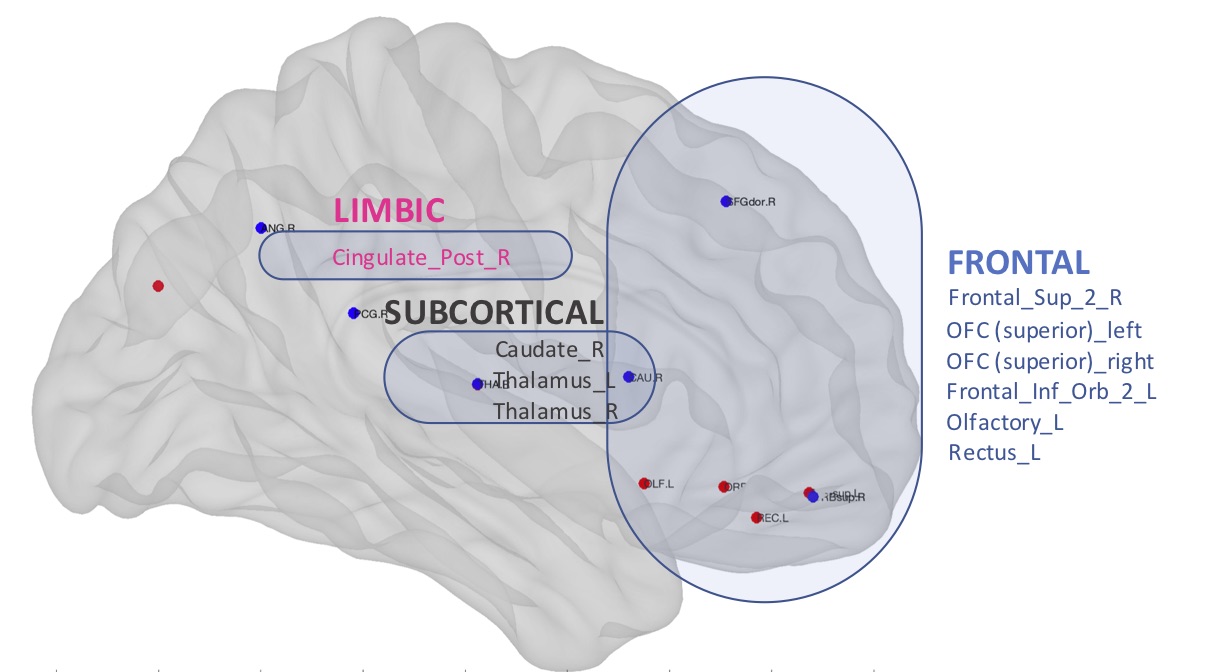
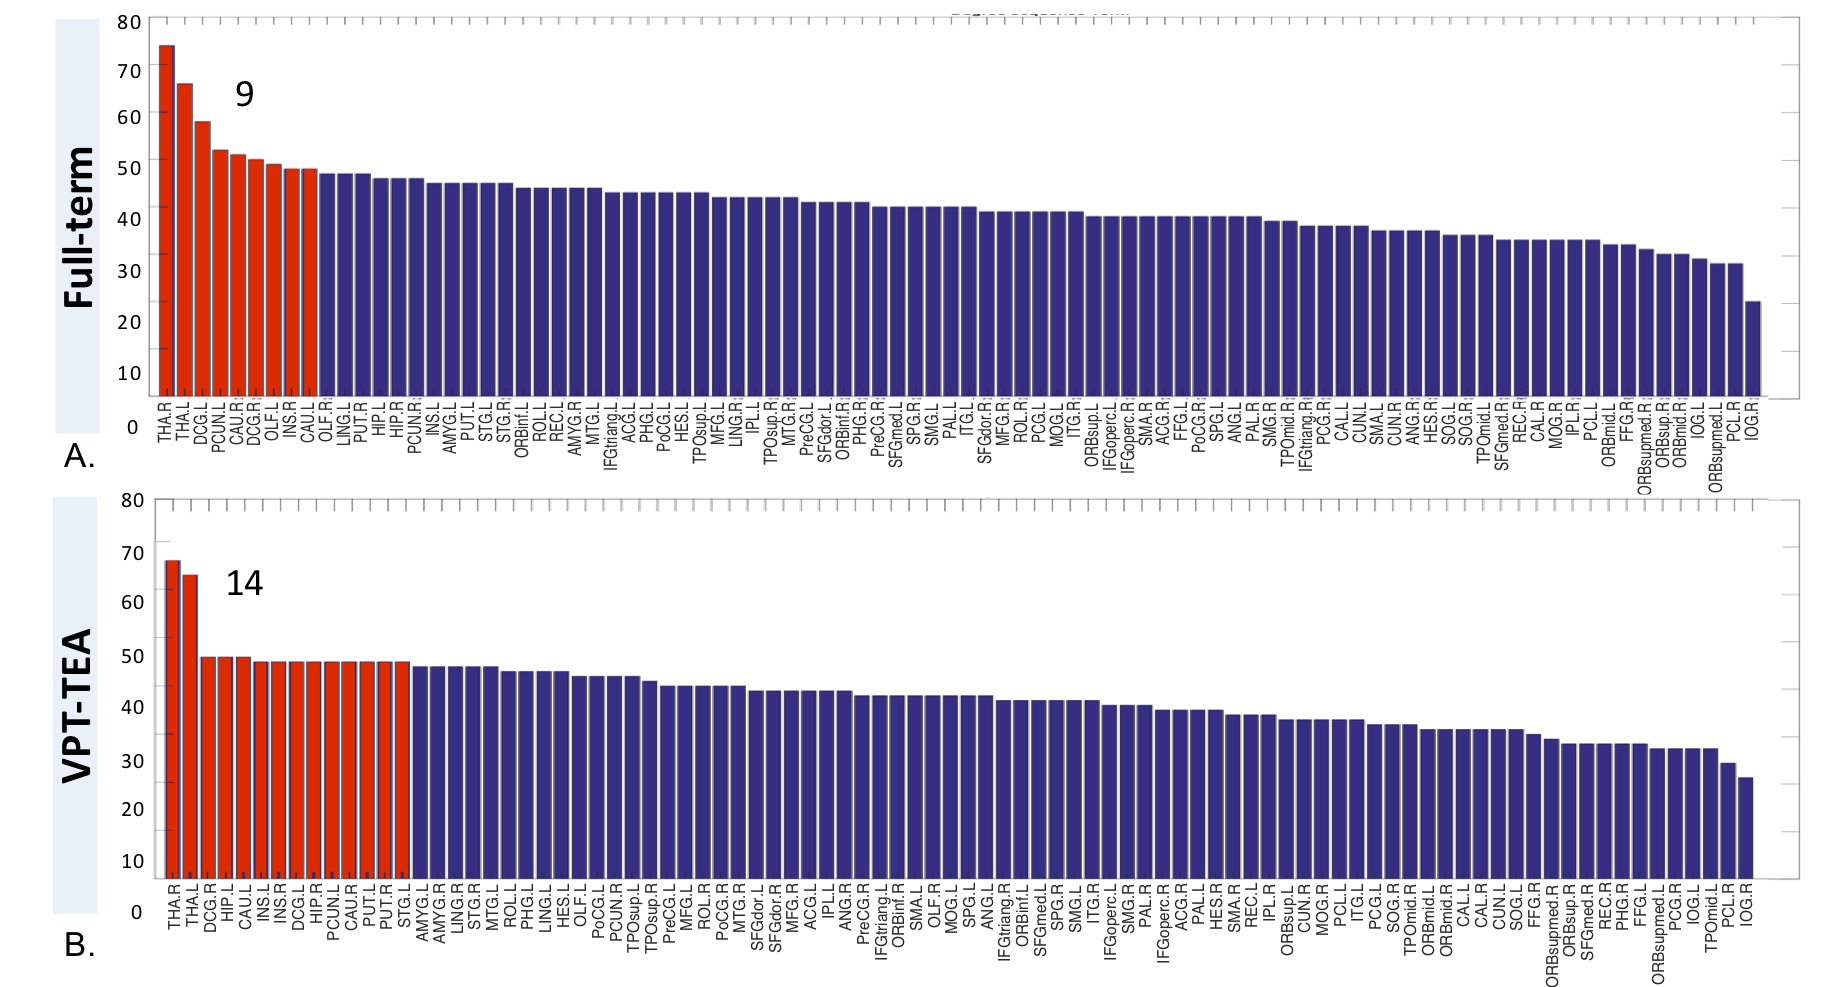
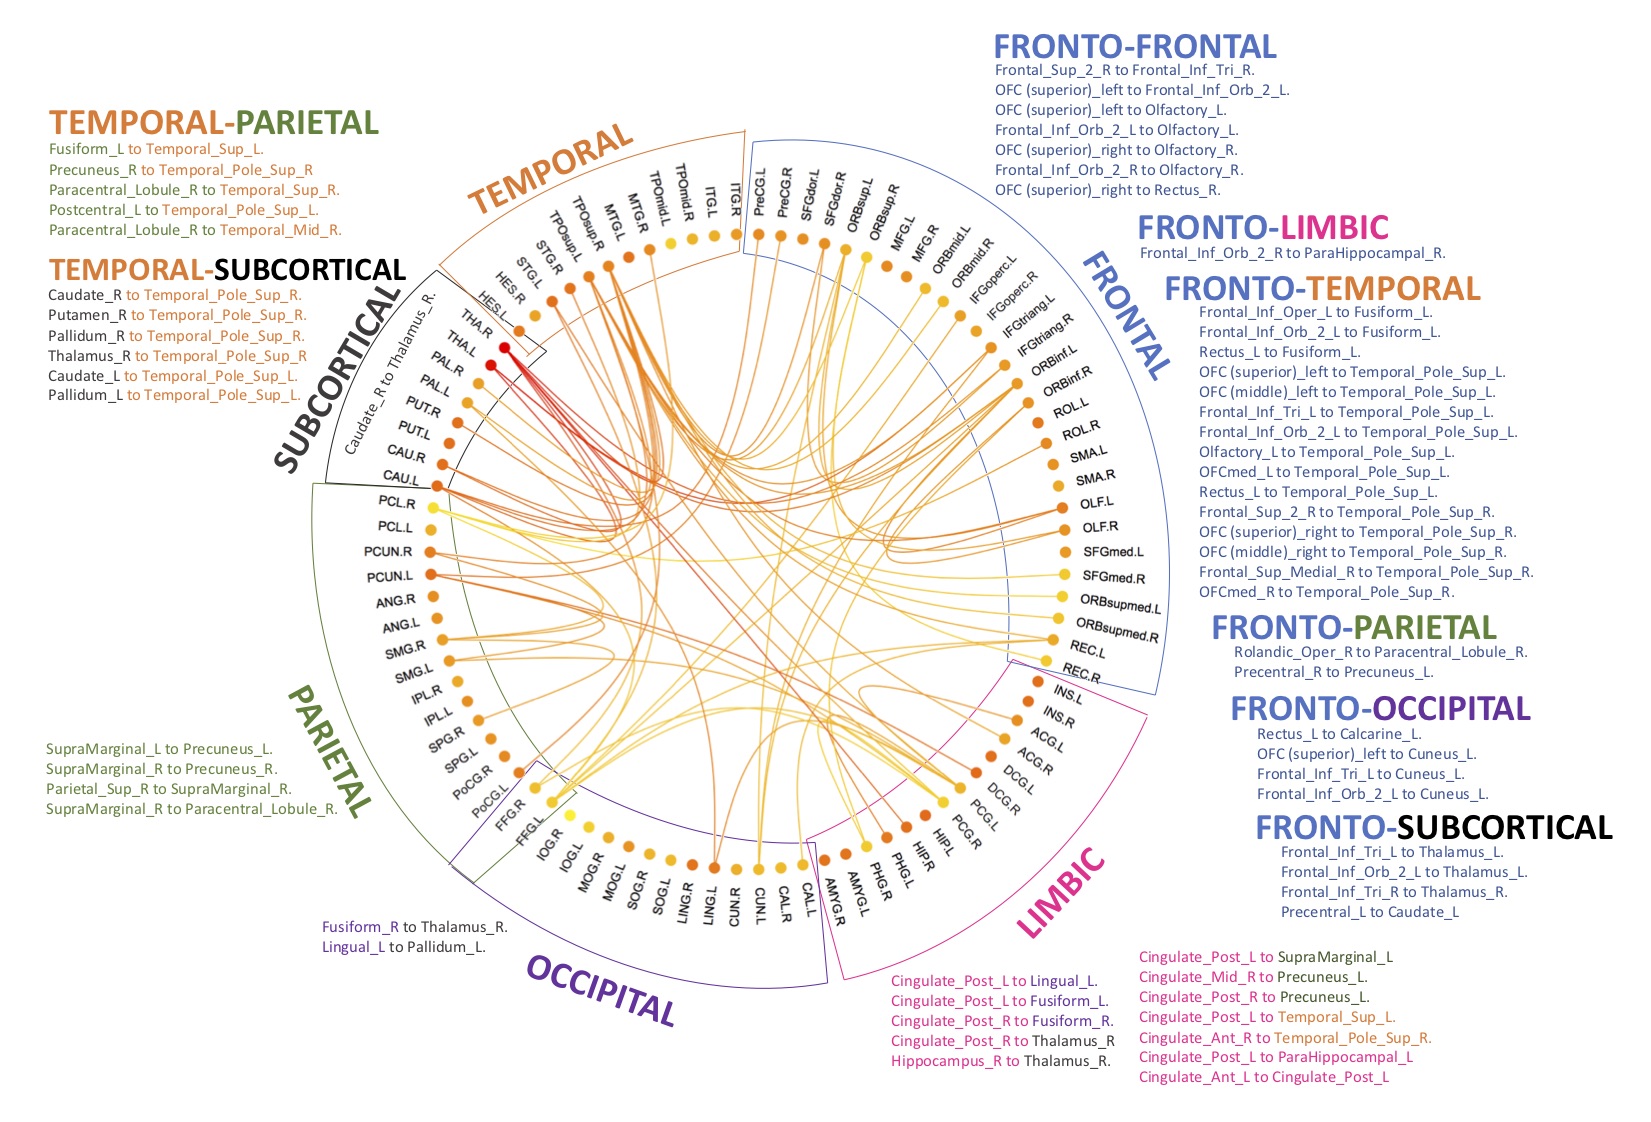
Regarding graph analysis, both VPT-TEA and FT infants’ networks (FA and SC-weighted) had a small-world organization. However, in comparison to FT newborns, VPT-TEA infants’ structural networks had a statistically significant higher clustering coefficient in SC-weighted networks (p=0.045), but lower characteristic path length (p=0.018) and global efficiency (p=0.006) in FA-weighted networks (Fig.1). In addition, modularity analysis of the SC-weighted networks showed no significant difference regarding the number of modules between groups, but a significantly higher modularity index (p=0.037) in VPT-TEA infants, when compared to FT infants, supporting a larger number of intra-connections, but lower number of inter-connections between modules in VPT-TEA infants. These results reveal that preterm birth is associated with a higher segregation but lower integration of brain structural networks at term-equivalent age. Furthermore, we found that VPT-TEA infants presented 10 nodes with lower nodal strength in the SC-weighted networks. These nodes comprise 6 frontal regions (mainly located in orbito-frontal cortex), as well as right posterior cingulum, right caudate and the thalamus bilaterally (Fig.2). Both FT and VPT-TEA connectomes revealed a right-tailed nodal degree distribution, supporting the presence of hubs, but FT infants’ networks evidenced 9 hubs with an averaged nodal degree of 55.11, whereas VPT-TEA infants’ networks had 14 hubs with a diminished averaged number of connections, 48. Therefore, VPT-TEA infants evidenced an increased number of hubs, with diminished averaged number of links, compared to FT infants. The hub regions comprised mainly subcortical, limbic and parietal nodes for both groups. Noticeably, VPT-TEA infants had a temporal hub not present in FT, whereas FT had a frontal hub, not present in VPT-TEA infants (Fig.3). Additionally, in comparison to FT, VPT-TEA infants SC-weighted networks presented 66 networks with a statistically significant decreased structural connectivity strength (p<0.05), comprising mostly frontal-cortical/subcortical connections as well as limbic and para-limbic-cortical/subcortical connections (Fig.4).CONCLUSION
Overall, we reveal that hallmark organization of the adult human brain connectome is present in both FT and VPT-TEA infants. However, VPT-TEA infants’ structural networks present a different topological organization, with an increased segregation and decreased capacity to integrate information across brain regions. In particular, VPT-TEA infants evidenced a diminished number of structural connections in subnetworks localized mainly in frontal and also limbic and para-limbic regions.Acknowledgements
The authors thank all clinical staff, namely in neonatology and unit of development of HUG Pediatric Hospital, all parents and newborns participating in the project, the Pediatrics Clinic Research Platform and the Center for Biomedical Imaging (CIBM) of the University Hospitals of Geneva, for all their help and support. This study was supported by the Swiss National Science Foundation n°32473B_135817/1, n° 324730-163084/1, n°320030B_182832/1 and Prim'enfance foundation.References
1. Brody BA, Kinney HC, Kloman AS, Gilles FH. Sequence of central nervous system myelination in human infancy. I. An autopsy study of myelination. J Neuropathol Exp Neurol 1987; 46(3): 283-301.
2. Dubois J, Dehaene-Lambertz G, Perrin M, et al. Asynchrony of the early maturation of white matter bundles in healthy infants: quantitative landmarks revealed noninvasively by diffusion tensor imaging. Human brain mapping2008; 29(1): 14-27.
3. Nossin-Manor R, Card D, Morris D, et al. Quantitative MRI in the very preterm brain: Assessing tissue organization and myelination using magnetization transfer, diffusion tensor and T-1 imaging. Neuroimage 2013; 64: 505-16.
4. Huang H, Zhang J, Wakana S, et al. White and gray matter development in human fetal, newborn and pediatric brains. Neuroimage 2006; 33(1): 27-38.
5. Kostovic I, Jovanov-Milosevic N. The development of cerebral connections during the first 20-45 weeks' gestation. Semin Fetal Neonatal Med 2006; 11(6): 415-22.
6. Kostovic I, Judas M. The development of the subplate and thalamocortical connections in the human foetal brain. Acta Paediatrica 2010; 99(8): 1119-27.
7. Van den Heuvel MP, Kersbergen KJ, de Reus MA, et al. The Neonatal Connectome During Preterm Brain Development. Cerebral Cortex 2015; 25(9): 3000-13.
8. Batalle D, Hughes EJ, Zhang H, et al. Early development of structural networks and the impact of prematurity on brain connectivity. Neuroimage 2017; 149: 379-92.
9. Radley JJ, Morrison JH. Repeated stress and structural plasticity in the brain. Ageing Res Rev 2005; 4(2): 271-87.
10. Kiss JZ, Vasung L, Petrenko V. Process of cortical network formation and impact of early brain damage. Curr Opin Neurol 2014; 27(2): 133-41.
11. Huppi PS, Maier SE, Peled S, et al. Microstructural development of human newborn cerebral white matter assessed in vivo by diffusion tensor magnetic resonance imaging. Pediatric research 1998; 44(4): 584-90.
12. Inder TE, Warfield SK, Wang H, Huppi PS, Volpe JJ. Abnormal cerebral structure is present at term in premature infants. Pediatrics 2005; 115(2): 286-94.
13. Thompson DK, Warfield SK, Carlin JB, et al. Perinatal risk factors altering regional brain structure in the preterm infant. Brain 2007; 130(Pt 3): 667-77.
14. Thompson DK, Adamson C, Roberts G, et al. Hippocampal shape variations at term equivalent age in very preterm infants compared with term controls: perinatal predictors and functional significance at age 7. Neuroimage2013; 70: 278-87.
15. Anjari M, Srinivasan L, Allsop JM, et al. Diffusion tensor imaging with tract-based spatial statistics reveals local white matter abnormalities in preterm infants. Neuroimage 2007; 35(3): 1021-7.
16. Ball G, Boardman JP, Rueckert D, et al. The effect of preterm birth on thalamic and cortical development. Cereb Cortex 2012; 22(5): 1016-24.
17. Cismaru AL, Gui L, Vasung L, et al. Altered Amygdala Development and Fear Processing in Prematurely Born Infants. Front Neuroanat 2016; 10: 55.
18. Montagna A, Nosarti C. Socio-Emotional Development Following Very Preterm Birth: Pathways to Psychopathology. Frontiers in Psychology 2016; 7.
19. Gui L, Lisowski R, Faundez T, Huppi PS, Lazeyras F, Kocher M. Morphology-driven automatic segmentation of MR images of the neonatal brain. Medical Image Analysis 2012; 16(8): 1565-79.
20. Shi F, Yap PT, Wu GR, et al. Infant Brain Atlases from Neonates to 1-and 2-Year-Olds. Plos One 2011; 6(4).
21. Smith SM, Jenkinson M, Woolrich MW, et al. Advances in functional and structural MR image analysis and implementation as FSL. Neuroimage 2004; 23: S208-S19.
22. Behrens TEJ, Woolrich MW, Jenkinson M, et al. Characterization and propagation of uncertainty in diffusion-weighted MR imaging. Magn Reson Med 2003; 50(5): 1077-88.
23. Andersson JLR, Sotiropoulos SN. An integrated approach to correction for off-resonance effects and subject movement in diffusion MR imaging. Neuroimage 2016; 125: 1063-78.
24. Bastiani M, Andersson JLR, Cordero-Grande L, et al. Automated processing pipeline for neonatal diffusion MRI in the developing Human Connectome Project. Neuroimage 2018.
25. Tournier JD, Smith R, Raffelt D, et al. MRtrix3: A fast, flexible and open software framework for medical image processing and visualisation. Neuroimage 2019; 202: 116137.
26. Rubinov M, Sporns O. Complex network measures of brain connectivity: Uses and interpretations. Neuroimage2010; 52(3): 1059-69.
27. Zalesky A, Fornito A, Bullmore ET. Network-based statistic: Identifying differences in brain networks. Neuroimage 2010; 53(4): 1197-207.
28. Genovese CR, Lazar NA, Nichols T. Thresholding of statistical maps in functional neuroimaging using the false discovery rate. Neuroimage 2002; 15(4): 870-8.
Figures