0221
Deciphering transcriptomic basis of the human brain structural connectome in the 3rd trimester1Department of Radiology, Children's Hospital of Philadelphia, Philadelphia, PA, United States, 2Department of Bioengineering, School of Engineering and Applied Science, University of Pennsylvania, Philadelphia, PA, United States, 3Department of Neuroscience and Kavli Institute for Neuroscience, Yale School of Medicine, New Haven, CT, United States, 4Department of Radiology, Perelman School of Medicine, University of Pennsylvania, Philadelphia, PA, United States
Synopsis
Dramatic development of brain connectome takes place during the 3rd trimester, mediated by transcriptome. Transcriptome is complete set of gene-expressed mRNAs and is heterogeneous across brain regions and dynamic throughout development. The transcriptomic basis of structural connectome in this critical developmental stage is unknown. In this study, we identified transcription genes most significantly correlated to nodal efficiency and degree centrality of macroscale structural connectome based on diffusion MRI of 77 preterm brains and over 60,000 quantified transcriptomes. These identified transcription genes such as MYRF regulating oligodendrocyte differentiation and myelination may shed light into the transcriptomic basis of structural connectome development.
Purpose
Compared to static and almost identical genome in one person, transcriptome, the set of all mRNAs expressed from DNA, is heterogeneous and dynamic across cells, brain regions, and development. During the 3rd trimester, brain structure experiences dramatic development including synaptogenesis, oligodendrogenesis, and myelination [1], under regulation from the transcriptome. Research in fetus has shown correlation between heterogeneous transcription expression level and cortical microstructure [2]. Nevertheless, how transcriptome is associated to macroscale brain organization development in early stage is not well understood [3]. In addition, most previous studies in development [4,5] where transcriptome was correlated applied transcriptome measures in adults from Allen Human Brain Atlas [6], which is far different from preterm and neonate’s. In this study, with transcriptome level in the 3rd-trimester samples from psychENCODE [7] and high-resolution diffusion MRI from preterm, we tested the association between connectome and transcriptome in preterm brains to reveal molecular and cellular processes underlying macroscale brain structure development.Methods
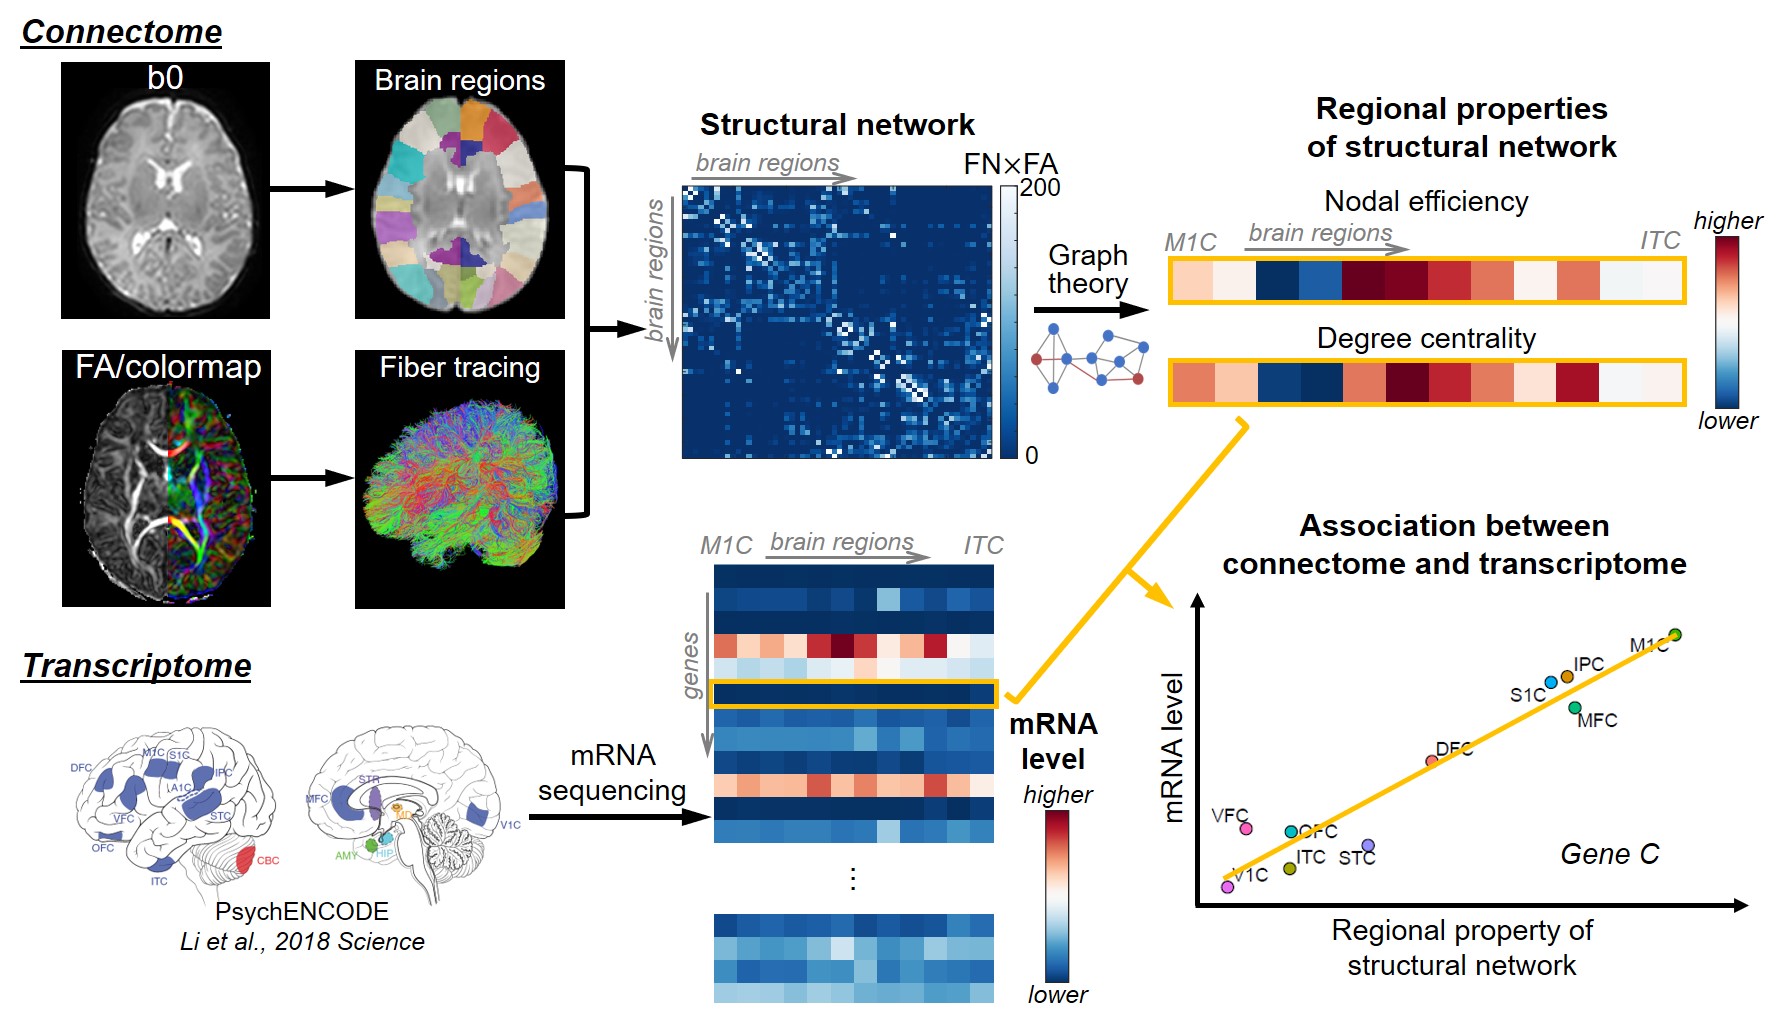
Schematic pipeline of methods is shown in Figure 1.Subjects and data acquisition: 77 normal neonates (47M/30F) were scanned at the age of 30-40 postconceptional weeks (pcw, estimated by postmenstrual weeks minus 2 weeks [8]) on a Philips 3.0 T Achieva MR scanner. High-resolution dMRI were acquired with a single-shot EPI sequence with following parameters: TR/TE=6850/78ms, FOV=168x168mm2, imaging resolution=1.5x1.5x1.6mm3, 60 slices, 30 independent diffusion-weighted directions, b-value=1000 s/mm2, repetition=2.
Construction of connectome and structural network analysis: Whole-brain, deterministic tractography was performed in Diffusion Toolkit (http://www.trackvis.org/dtk/), with FA threshold of 0.1 and angle threshold of 35 degrees. JHU neonate atlas was registered to individual b0 image and cortical regions (nodes) were dilated with 9 voxels. Weighted structural network was formed with element calculated by number of fibers (FN) terminating in the pair of cortical regions times mean FA. Global properties of network, including global efficiency and local efficiency [9] for each subject, and regional properties of network for each node, including nodal efficiency [10] and degree centrality [11], were calculated based on graph theory. Nodal efficiency and degree centrality were averaged across subjects for further analysis. Regression of these two metrics with age was also conducted.
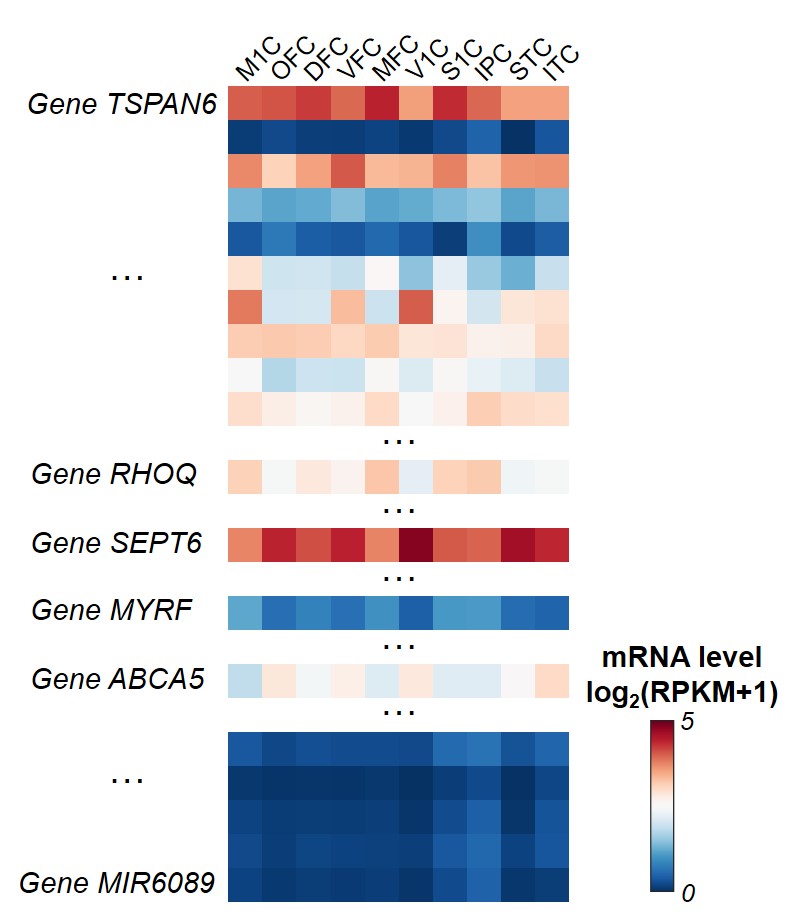
Tissue mRNA sequencing and transcriptome level measuring: Tissue-level mRNA sequencing (mRNA-seq) was conducted on high-quality tissue from two post-mortem human brain samples aged 35 and 37 pcw from PsychENCODE [7]. Normalized mRNA level, RPKM (Reads Per Kilobase of transcript per Million mapped reads) from total of 60155 genes, was measured. Ten brain regions from all four cerebral lobes were included in this study (see Figure 1 caption for full list). RPKM from these two samples were averaged for further analysis.
Correlation between connectome and transcriptome: For each gene, Pearson correlation between regional property of network (nodal efficiency, degree centrality, and their increasing slope across age) and log of mRNA level (RPKM) was calculated.
Results
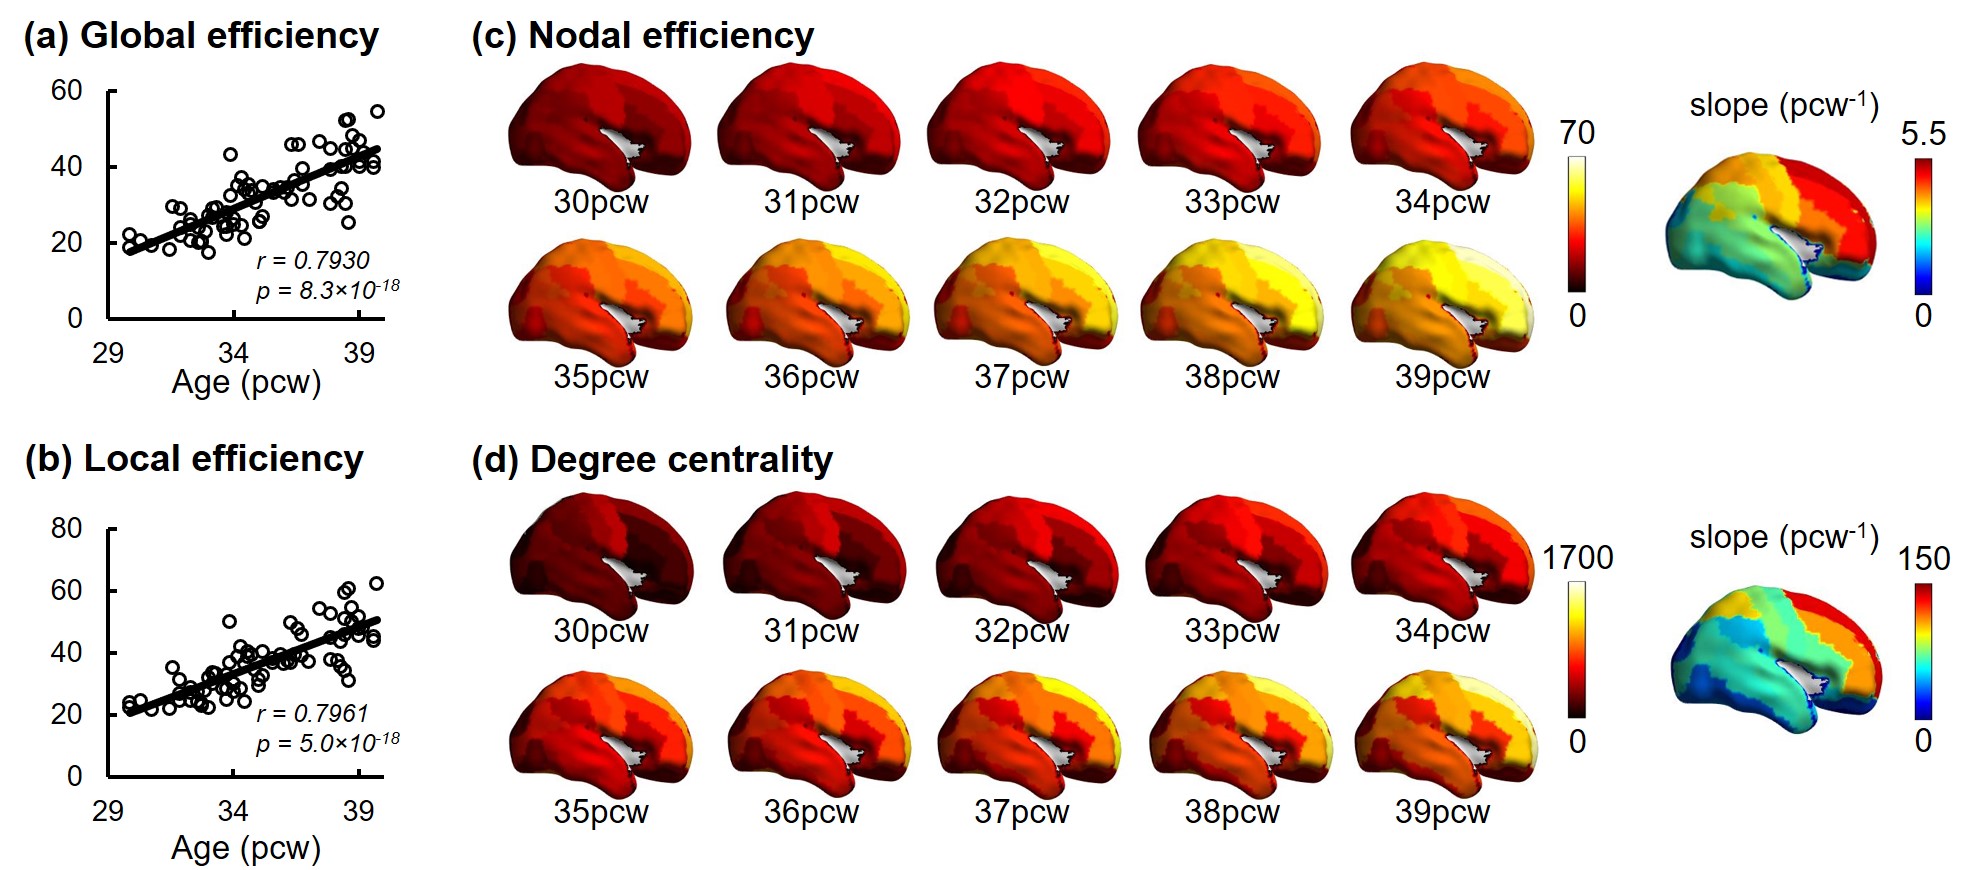
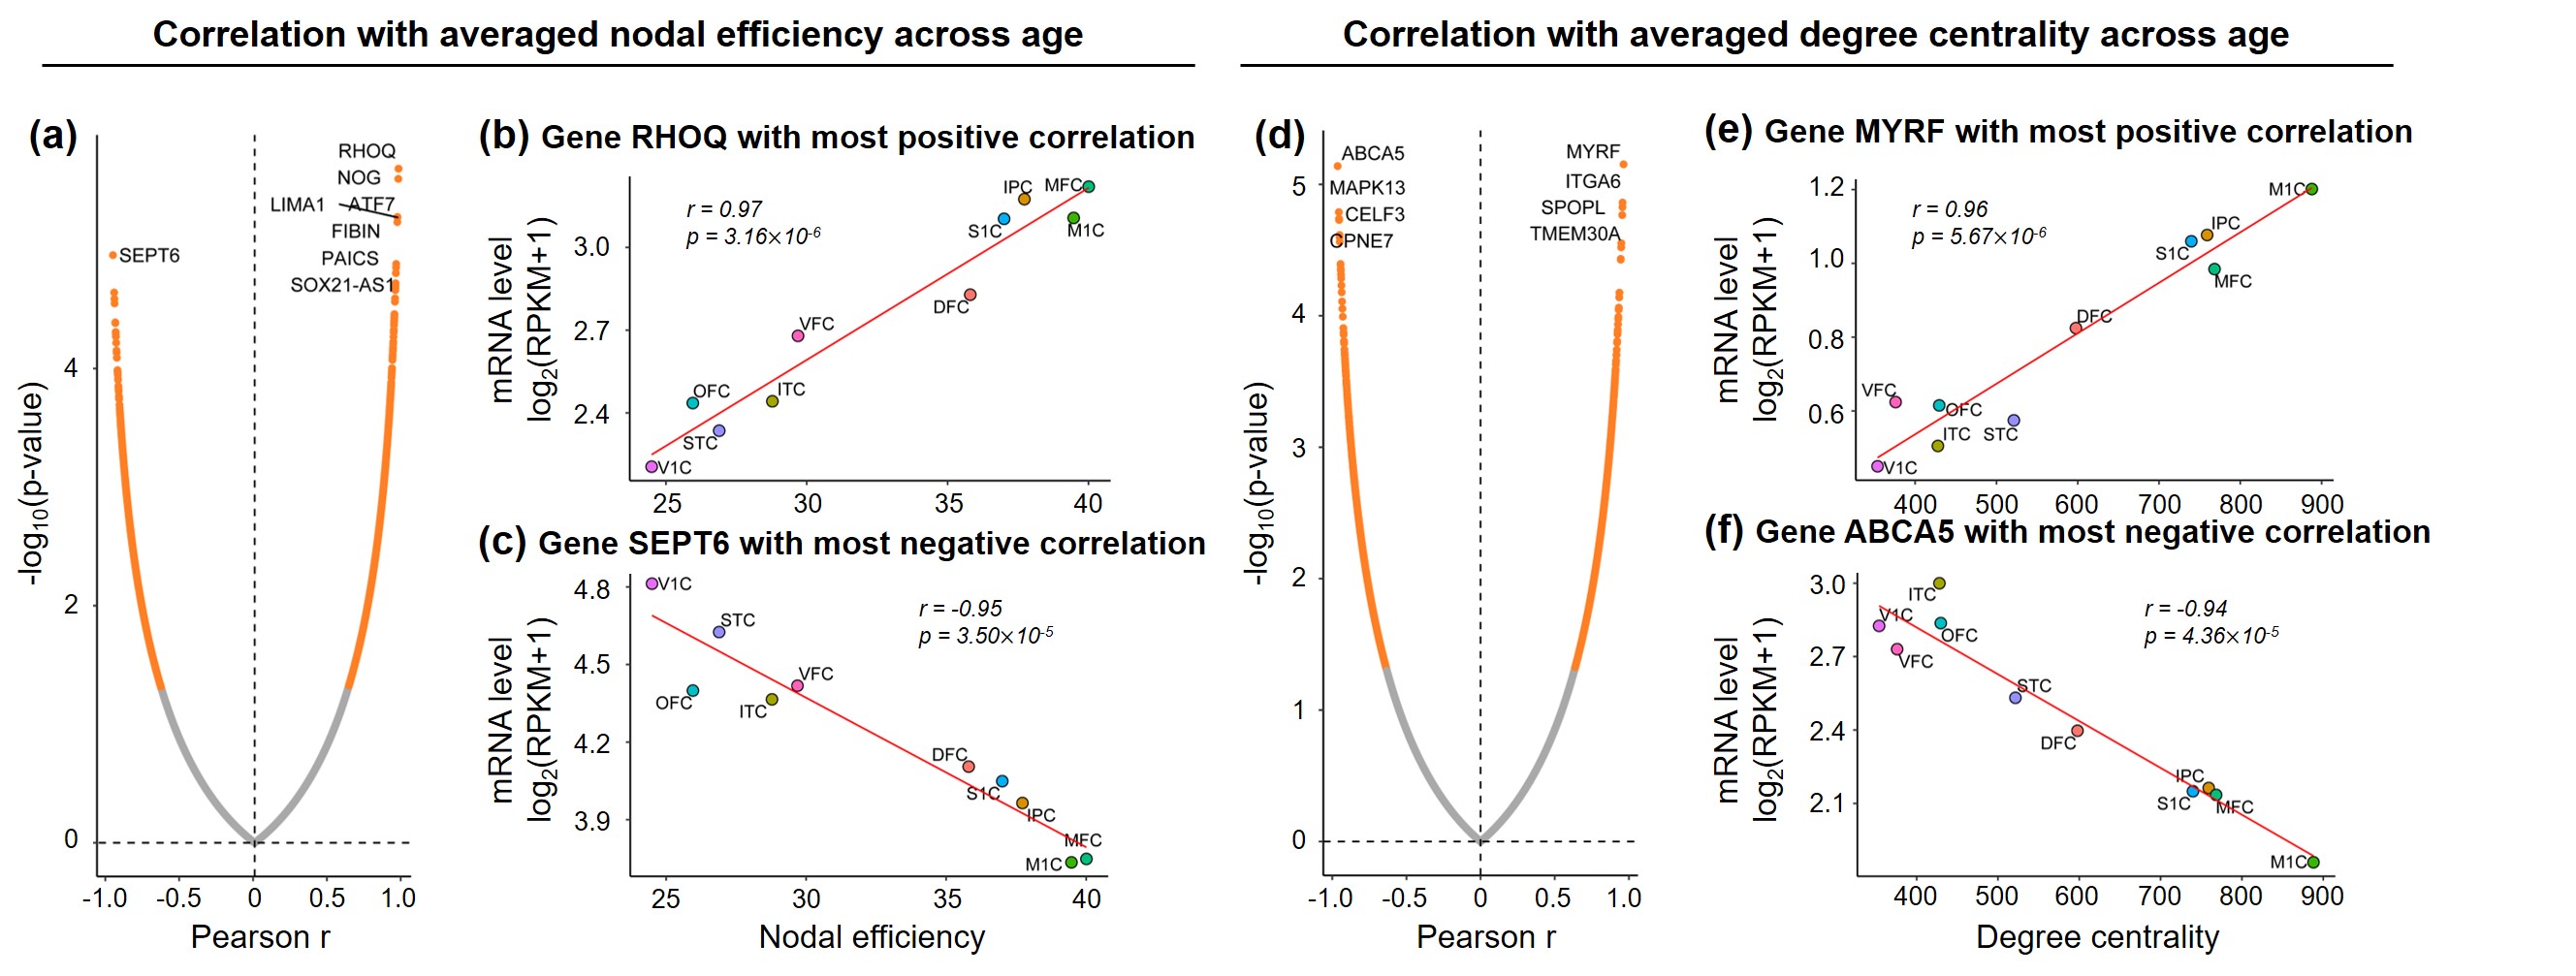
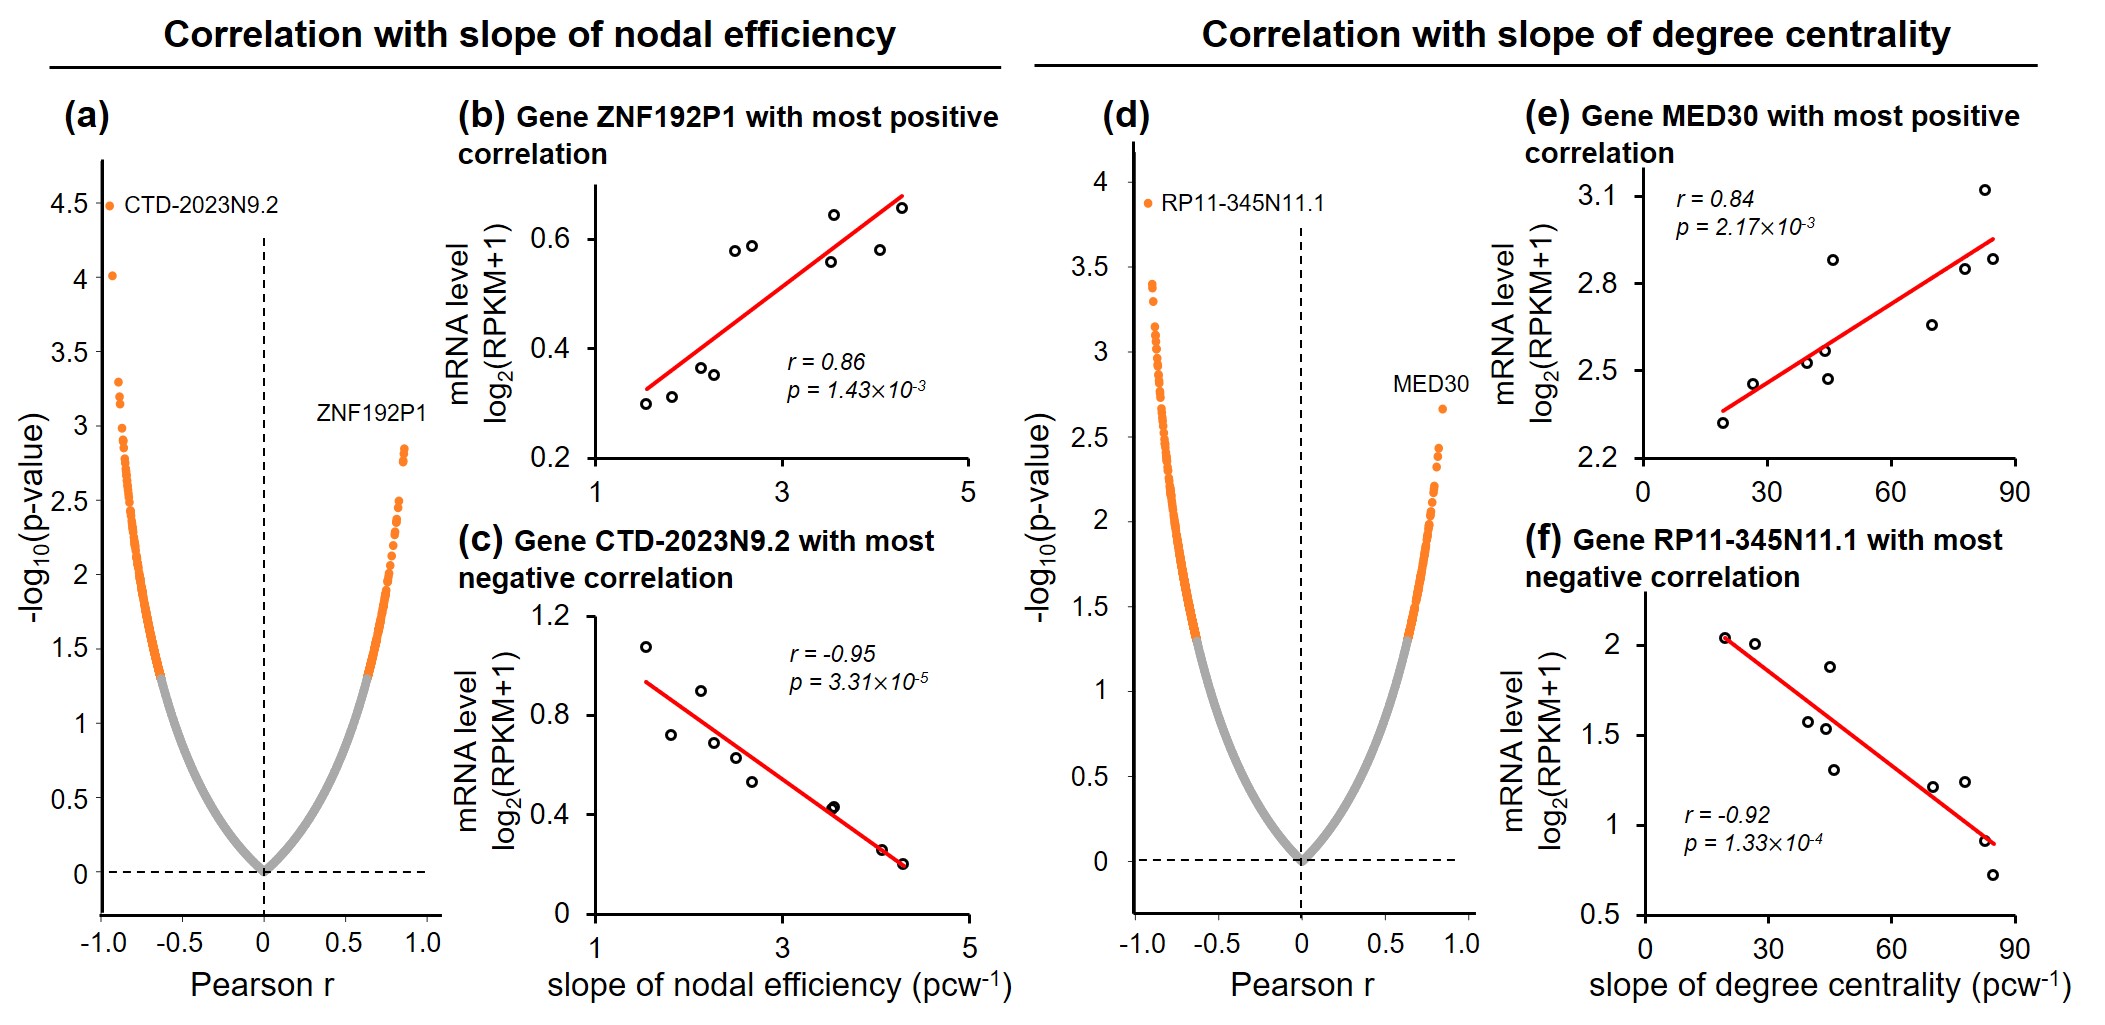
Both global and heterogeneous regional properties of structural network displayed consistent increase in the 3rd trimester (Figure 2). Specifically, global properties, global and local efficiency, significantly raised with age (Figure 2(a) and (b)). More importantly, regional properties showed heterogeneous increase across brain regions (Figure 2(c) and (d)), where primary visual cortex (V1C) and medial prefrontal cortex (MFC) increased fastest and ventrolateral prefrontal cortex (VFC) increased slowest among all 10 cerebral cortical regions included (Figure 2(c) and (d), slope mapping). Heterogeneous mRNA level across brain regions was observed (Figure 3). Moreover, mRNA level significantly correlated with heterogeneous regional connectome metrics. Specifically, 8.5% and 7.6% of genes significantly correlated with averaged nodal efficiency and degree centrality, respectively (Figure 4). In addition, 0.96% and 0.89% of genes significantly correlated with slope of these two metrics, respectively (Figure 5). Genes with most positive or negative correlation are highlighted with regressions plots in Figure 4 and 5.Discussion and Conclusions
We have identified the transcription genes most correlated to the nodal efficiency, degree centrality and the slopes of those two measurements by correlating diffusion MRI datasets of 77 preterm subjects with transcription level of over 60,000 genes. We hypothesized that distinctive molecular and cellular processes across the brain regions associated with these transcriptomes underlie the heterogeneous macroscale structural connectome maturation in the 3rd trimester, facilitating development of specialized functions across regions. The gene MYRF, with transcription level most positively correlated to degree centrality (Figure 4(e)), is associated to oligodendrocyte differentiation and myelination [12-14]. On the other hand, in this late fetal period, asynchronized in oligodendrocyte precursor maturation and myelination was found [15-16]. This leads to enhanced connections between brain regions and raised, heterogeneous regional connectome levels. In addition, gene ZNF192P1, with transcription level most positively correlated to slope of nodal efficiency (Figure 5(b)), has been identified as risk gene in Schizophrenia, with enrichment in molecular function of myelin sheath [17]. Together, it is speculated that regional connectome profiles result from molecular and cellular processes regulated by heterogeneous regional transcriptome. Those specific transcription genes strongly correlated to connectome development could be the biomarker preceding onset of neuropsychiatric disorders. We will continue comprehensive statistical analysis including principle component analysis and larger connectivity matrix to understand transcriptomic basis of macroscale connectome across lifespan.Acknowledgements
This study is funded by NIH MH092535, MH092535-S1 and HD086984. The transcriptome data was generated with the support of The BrainSpan Project Consortium by grants MH089929, MH090047, and MH089921 from NIMH. In addition, G.S. is supported by fellowship from ”la Caixa” Foundation (ID 100010434) with grant code LCF/BQ/PI19/11690010.References
[1] Ouyang, M., Dubois, J., Yu, Q., Mukherjee, P., & Huang, H. (2019). Delineation of early brain development from fetuses to infants with diffusion MRI and beyond. Neuroimage, 185, 836-850.
[2] Huang, H., Jeon, T., Sedmak, G., Pletikos, M., Vasung, L., Xu, X., ... & Mori, S. (2012). Coupling diffusion imaging with histological and gene expression analysis to examine the dynamics of cortical areas across the fetal period of human brain development. Cerebral cortex, 23(11), 2620-2631.
[3] Fornito, A., Arnatkevičiūtė, A., & Fulcher, B. D. (2018). Bridging the gap between connectome and transcriptome. Trends in cognitive sciences.
[4] Reardon, P. K., Seidlitz, J., Vandekar, S., Liu, S., Patel, R., Park, M. T. M., ... & Raznahan, A. (2018). Normative brain size variation and brain shape diversity in humans. Science, 360(6394), 1222-1227.
[5] Whitaker, K. J., Vértes, P. E., Romero-Garcia, R., Váša, F., Moutoussis, M., Prabhu, G., ... & Bullmore, E. (2016). Adolescence is associated with genomically patterned consolidation of the hubs of the human brain connectome. Proceedings of the National Academy of Sciences, 113(32), 9105-9110.
[6] Hawrylycz, M. J., Lein, E. S., Guillozet-Bongaarts, A. L., Shen, E. H., Ng, L., Miller, J. A., ... & Jones, A. (2012). An anatomically comprehensive atlas of the adult human brain transcriptome. Nature, 489(7416), 391.
[7] Li, M., Santpere, G., Kawasawa, Y. I., Evgrafov, O. V., Gulden, F. O., Pochareddy, S., ... & Sestan, N. (2018). Integrative functional genomic analysis of human brain development and neuropsychiatric risks. Science, 362(6420), eaat7615.
[8] Engle, W. A. (2004). Age terminology during the perinatal period. Pediatrics, 114(5), 1362-1364.
[9] Rubinov, M., & Sporns, O. (2010). Complex network measures of brain connectivity: uses and interpretations. Neuroimage, 52(3), 1059-1069.
[10] Achard, S., & Bullmore, E. (2007). Efficiency and cost of economical brain functional networks. PLoS computational biology, 3(2), e17.
[11] Van Den Heuvel, M. P., & Sporns, O. (2011). Rich-club organization of the human connectome. Journal of Neuroscience, 31(44), 15775-15786.
[12] Hornig, J., Fröb, F., Vogl, M. R., Hermans-Borgmeyer, I., Tamm, E. R., & Wegner, M. (2013). The transcription factors Sox10 and Myrf define an essential regulatory network module in differentiating oligodendrocytes. PLoS genetics, 9(10), e1003907.
[13] Bujalka, H., Koenning, M., Jackson, S., Perreau, V. M., Pope, B., Hay, C. M., ... & Srinivasan, R. (2013). MYRF is a membrane-associated transcription factor that autoproteolytically cleaves to directly activate myelin genes. PLoS biology, 11(8), e1001625.
[14] Olmos-Serrano, J. L., Kang, H. J., Tyler, W. A., Silbereis, J. C., Cheng, F., Zhu, Y., ... & Sestan, N. (2016). Down syndrome developmental brain transcriptome reveals defective oligodendrocyte differentiation and myelination. Neuron, 89(6), 1208-1222.
[15] Silbereis, J. C., Pochareddy, S., Zhu, Y., Li, M., & Sestan, N. (2016). The cellular and molecular landscapes of the developing human central nervous system. Neuron, 89(2), 248-268.
[16] Volpe, J. J. (2008). Neurology of the Newborn. Elsevier Health Sciences.
[17] Cai, L., Huang, T., Su, J., Zhang, X., Chen, W., Zhang, F., ... & Chou, K. C. (2018). Implications of newly identified brain eQTL genes and their interactors in Schizophrenia. Molecular Therapy-Nucleic Acids, 12, 433-442.
Figures