0220
Evaluation of neuroinflammation in Alzheimer’s disease on human subjects using third-generation TSPO ligand [18F]-GE1801Cleveland Clinic Lou Ruvo Center for Brain Health, Las Vegas, NV, United States, 2Department of Neuroscience, University of California, San Diego, CA, United States, 3Department of Psychology and Neuroscience, University of Colorado, Boulder, CO, United States, 4Department of Brain Health, School of Integrated Health Sciences, University of Nevada, Las Vegas, NV, United States
Synopsis
Inflammatory reactions contribute to disease progression and severity of Alzheimer’s disease (AD). While multiple animal studies have suggested that increased neuroinflammation occurs in AD, few studies have investigated neuroinflammation in human subjects. This is the first study using the third-generation TSPO ligand [18F]-GE180 to evaluate the neuroinflammation in AD on human subjects. Our study suggests that neuroinflammation accumulates together with amyloid deposition and reaches a plateau when the regional amyloid SUVR reaches 1.1 threshold. Compared to amyloid pathology, neuroinflammation is more closely related to hyperconnectivity in MCI/AD subjects.
Introduction
Pre-clinical studies have suggested that the pathology of AD is not restricted to the accumulated senile plaques and neurofibrillary tangles but is also related to the neuroinflammation in the activated immune system [1,2]. While multiple animal studies have suggested that increased neuroinflammation occurs in AD, few studies have investigated neuroinflammation in human subjects. This is the first study using the third-generation TSPO ligand [18F]-GE180 to evaluate the neuroinflammation in AD with human subjects. The interaction between neuroinflammation and amyloid burden or functional connectivity is investigated.Methods
Ten cognitively normal individuals (CN), six with mild cognitive impairment (MCI), and three AD dementia subjects characterized with amyloid imaging with AV45 from the Center for Neurodegeneration and Translational Neuroscience at Cleveland Clinic Lou Ruvo Center for Brain Health were included. MCI and AD dementia subjects were treated as a single group (AD/MCI group) in our analysis to increase the sample size for analysis. AV45 PET scan, GE180 PET scan, and resting state fMRI images were acquired from each subject. Resting state fMRI volumes were realigned to the first volume. PET scans and resting state fMRI images were coregistered to individual T1 structural images. Freesurfer was used to segment T1 images and 78 cortical and subcortical region-of-interest (ROI) were included in the analysis. Standardized uptake value ratio (SUVR) images were calculated for GE180 and AV45 positron emission tomography (PET) scans with cerebellar gray matter as the reference region. The mean SUVR scores for 78 ROIs were calculated, in addition, the mean SUVR scores for frontal, cingulate, parietal and temporal area defined by ADNI (http://adni.loni.usc.edu/ ) investigators were also calculated. The mean time series from 78 ROIs were calculated. Nuisance regression was applied on ROI time series with realignment parameters and their first-order derivative, and three Compcor [3] components each from white matter and cerebrospinal fluid. Low-pass filtering was then applied with frequency cutoff at 0.2 Hz. Pearson’s correlation between the processed ROI time series was calculated to construct functional connectivity map. Two-sample t-test was applied to obtain the functional connectivity difference between AD/MCI and CN group. In addition, linear regression was applied to compute how strongly the functional connectivity between each two nodes was associated with neuroinflammation or amyloid burden, where functional connectivity was treated as dependent variable and SUVR was treated as independent variable. The regression coefficient, beta coefficient, was used to evaluate the association between functional connectivity and PET SUVR. For both group difference and linear regression, age and gender were treated as covariates.Results
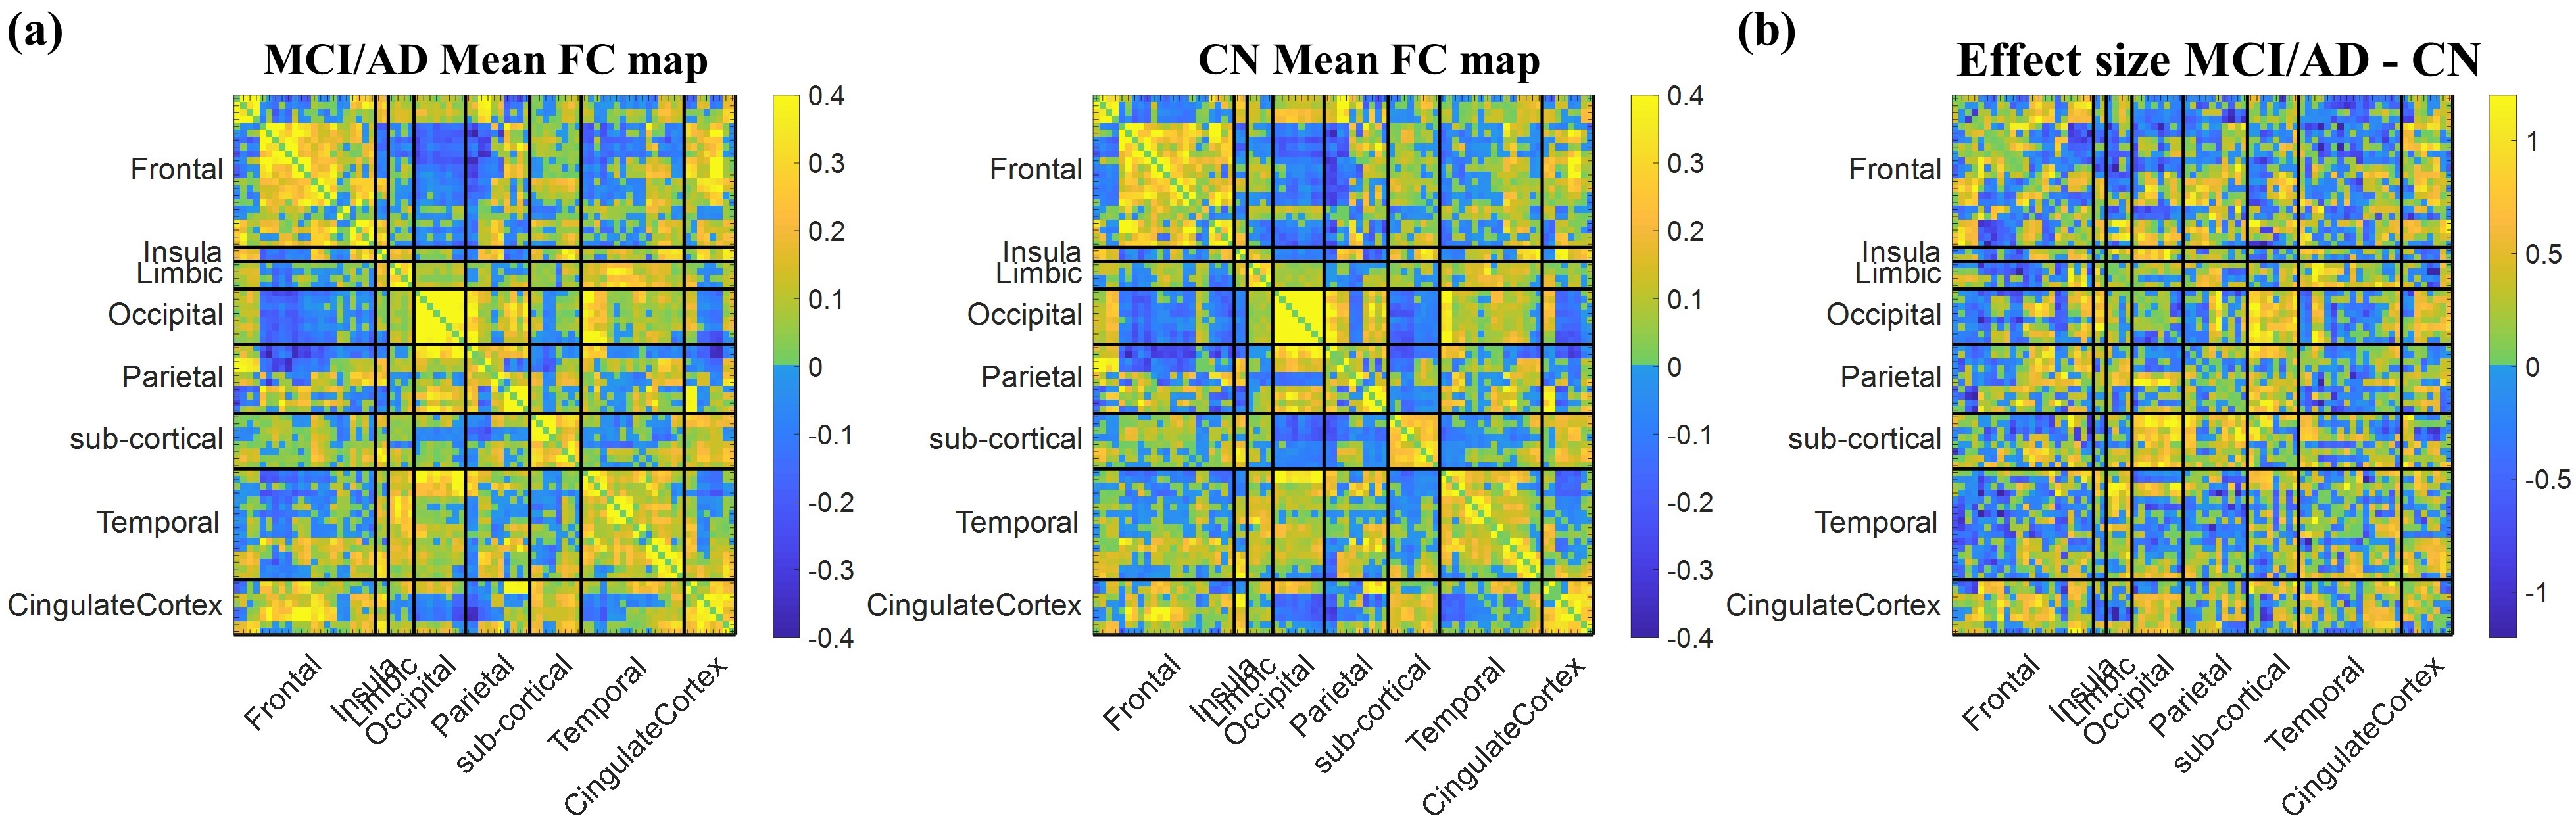
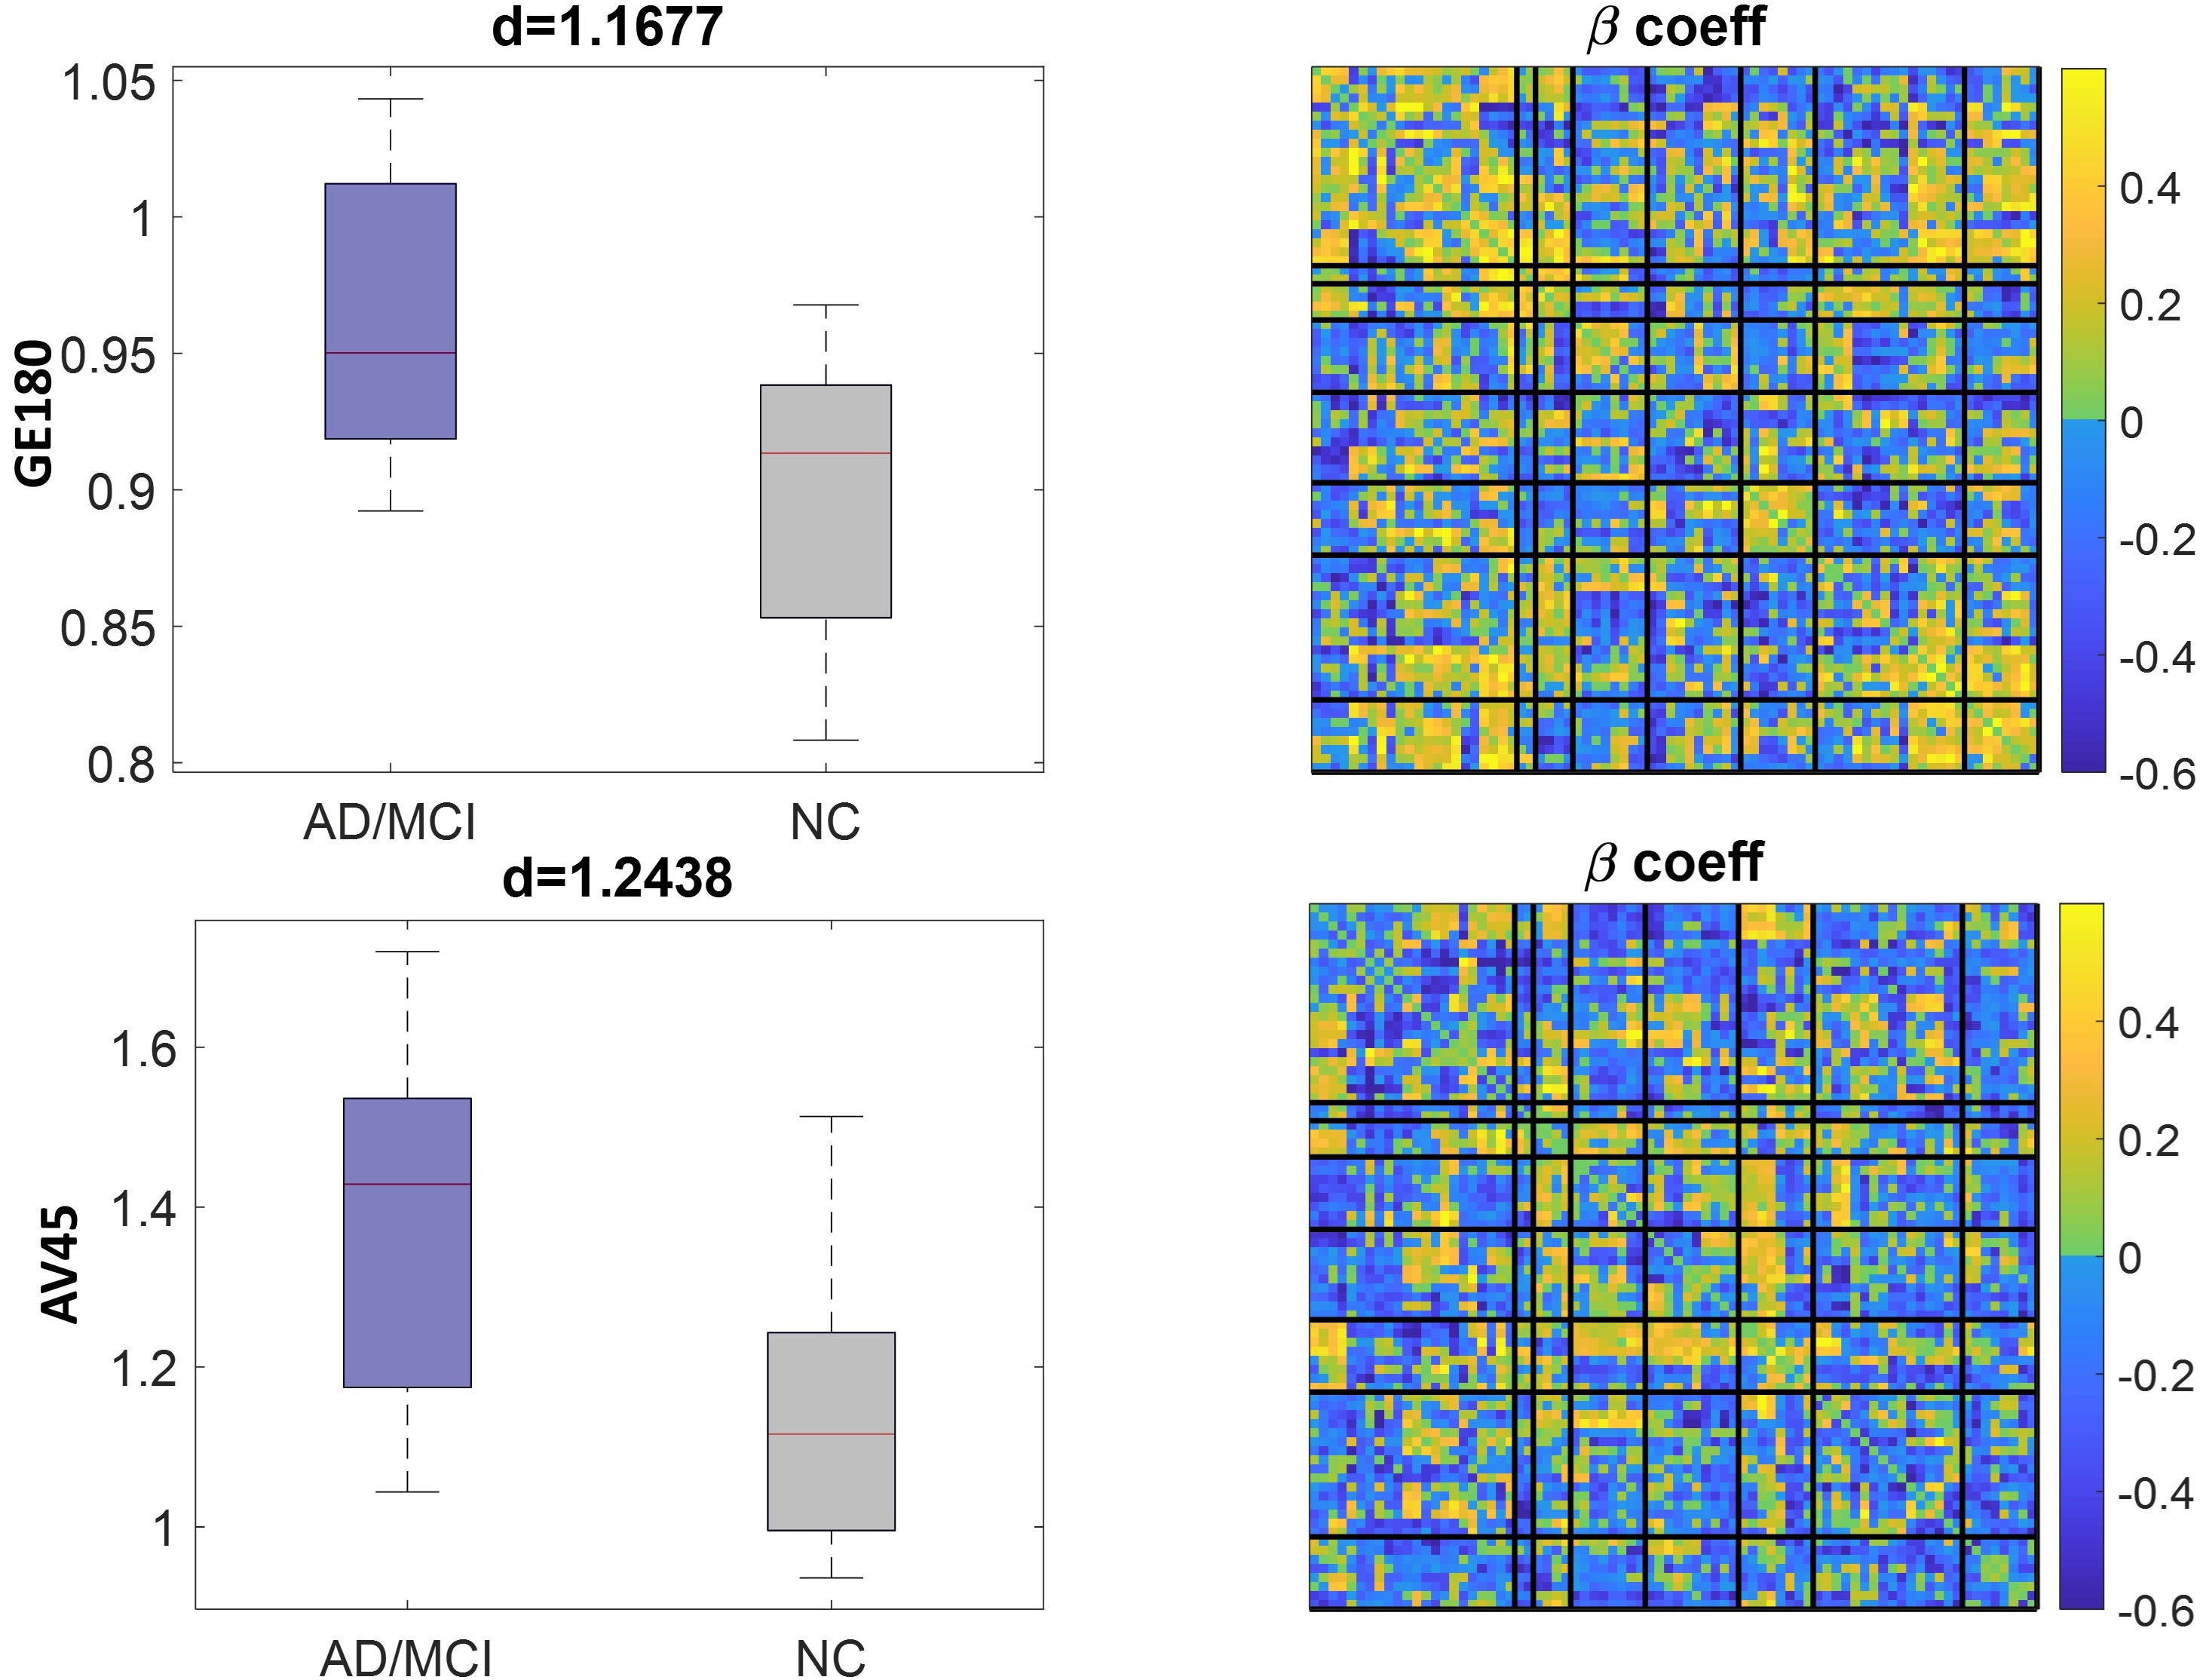
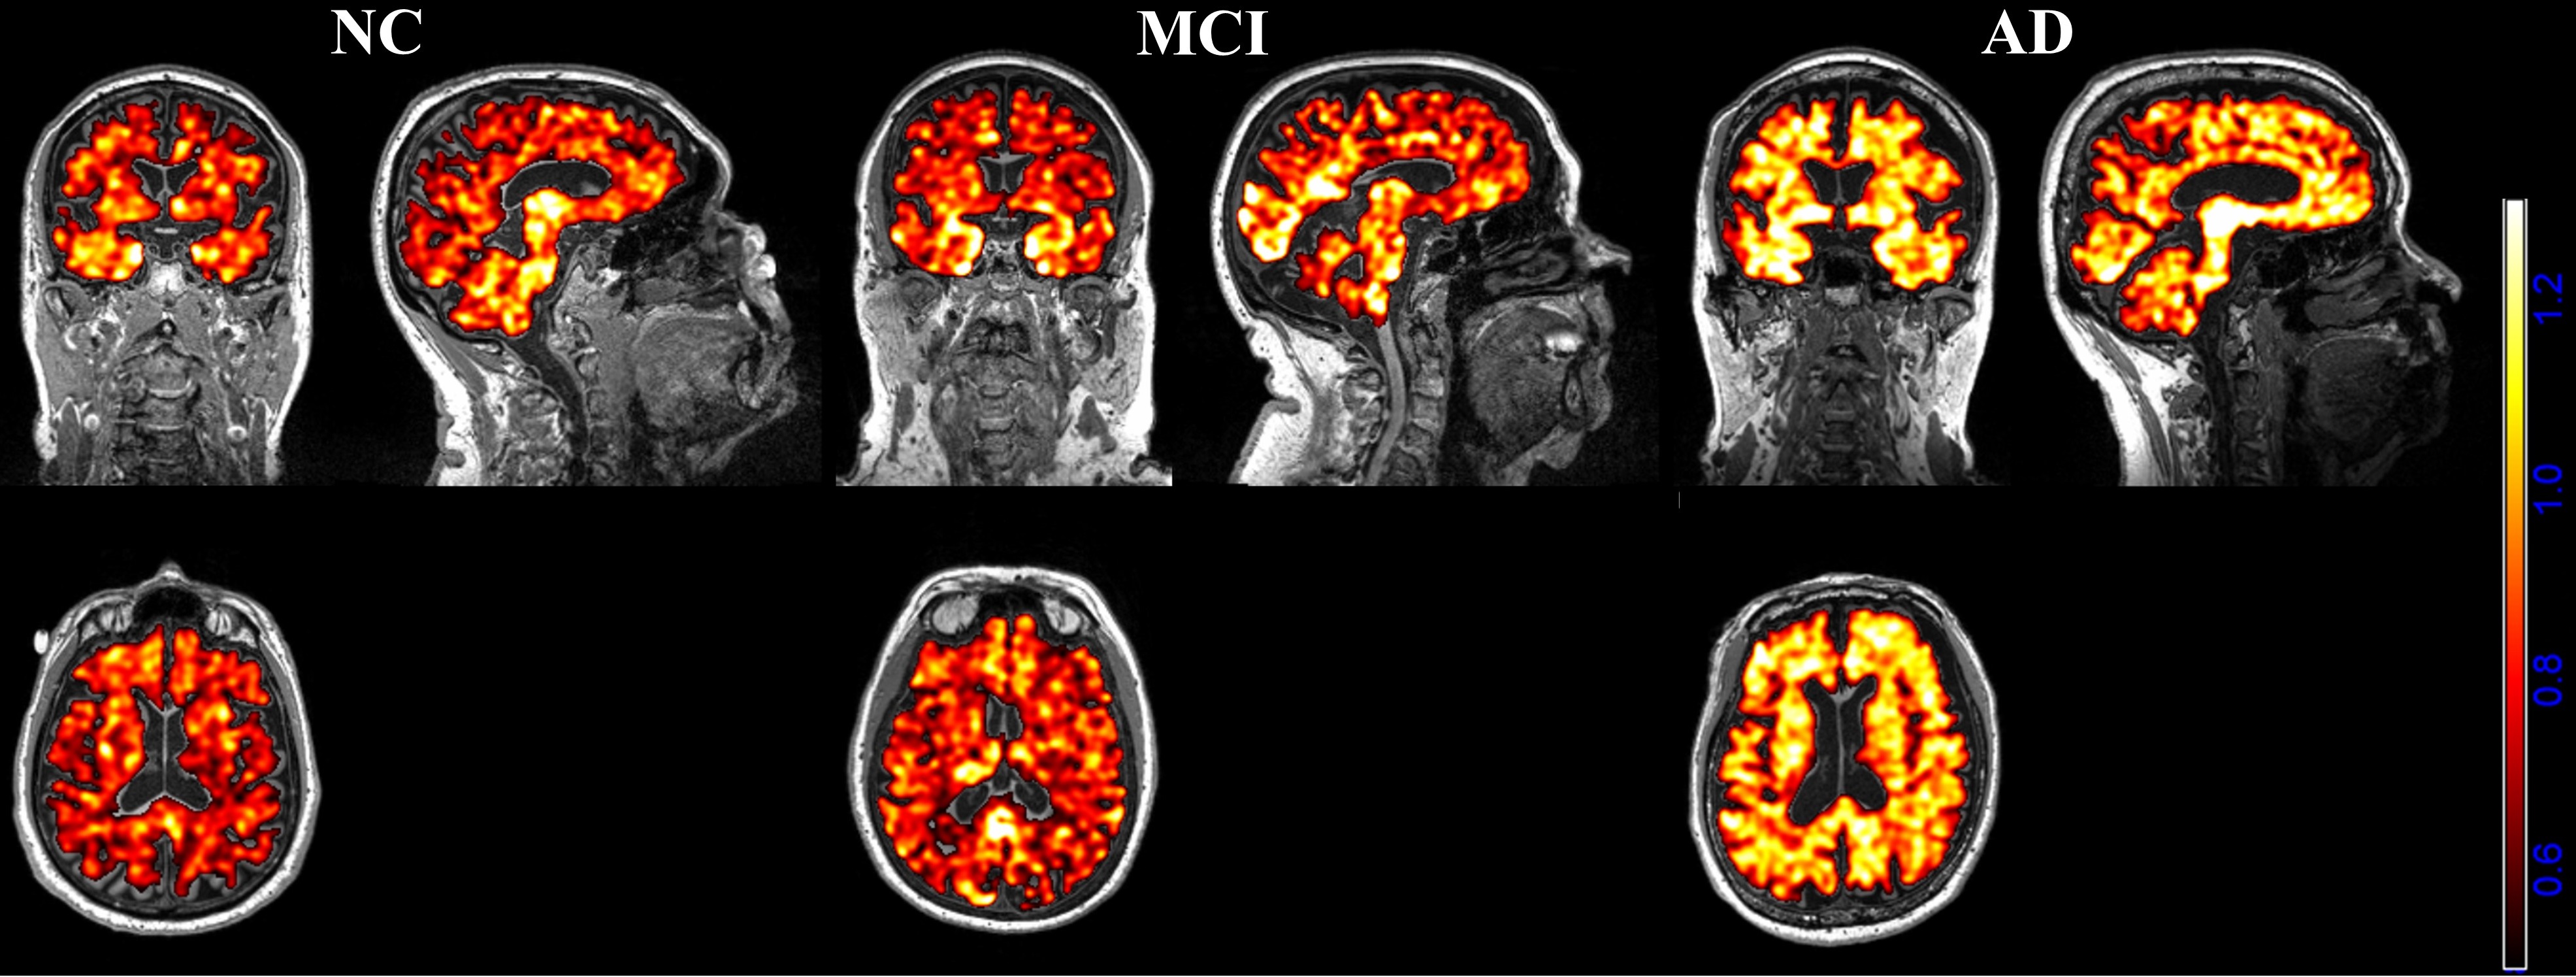
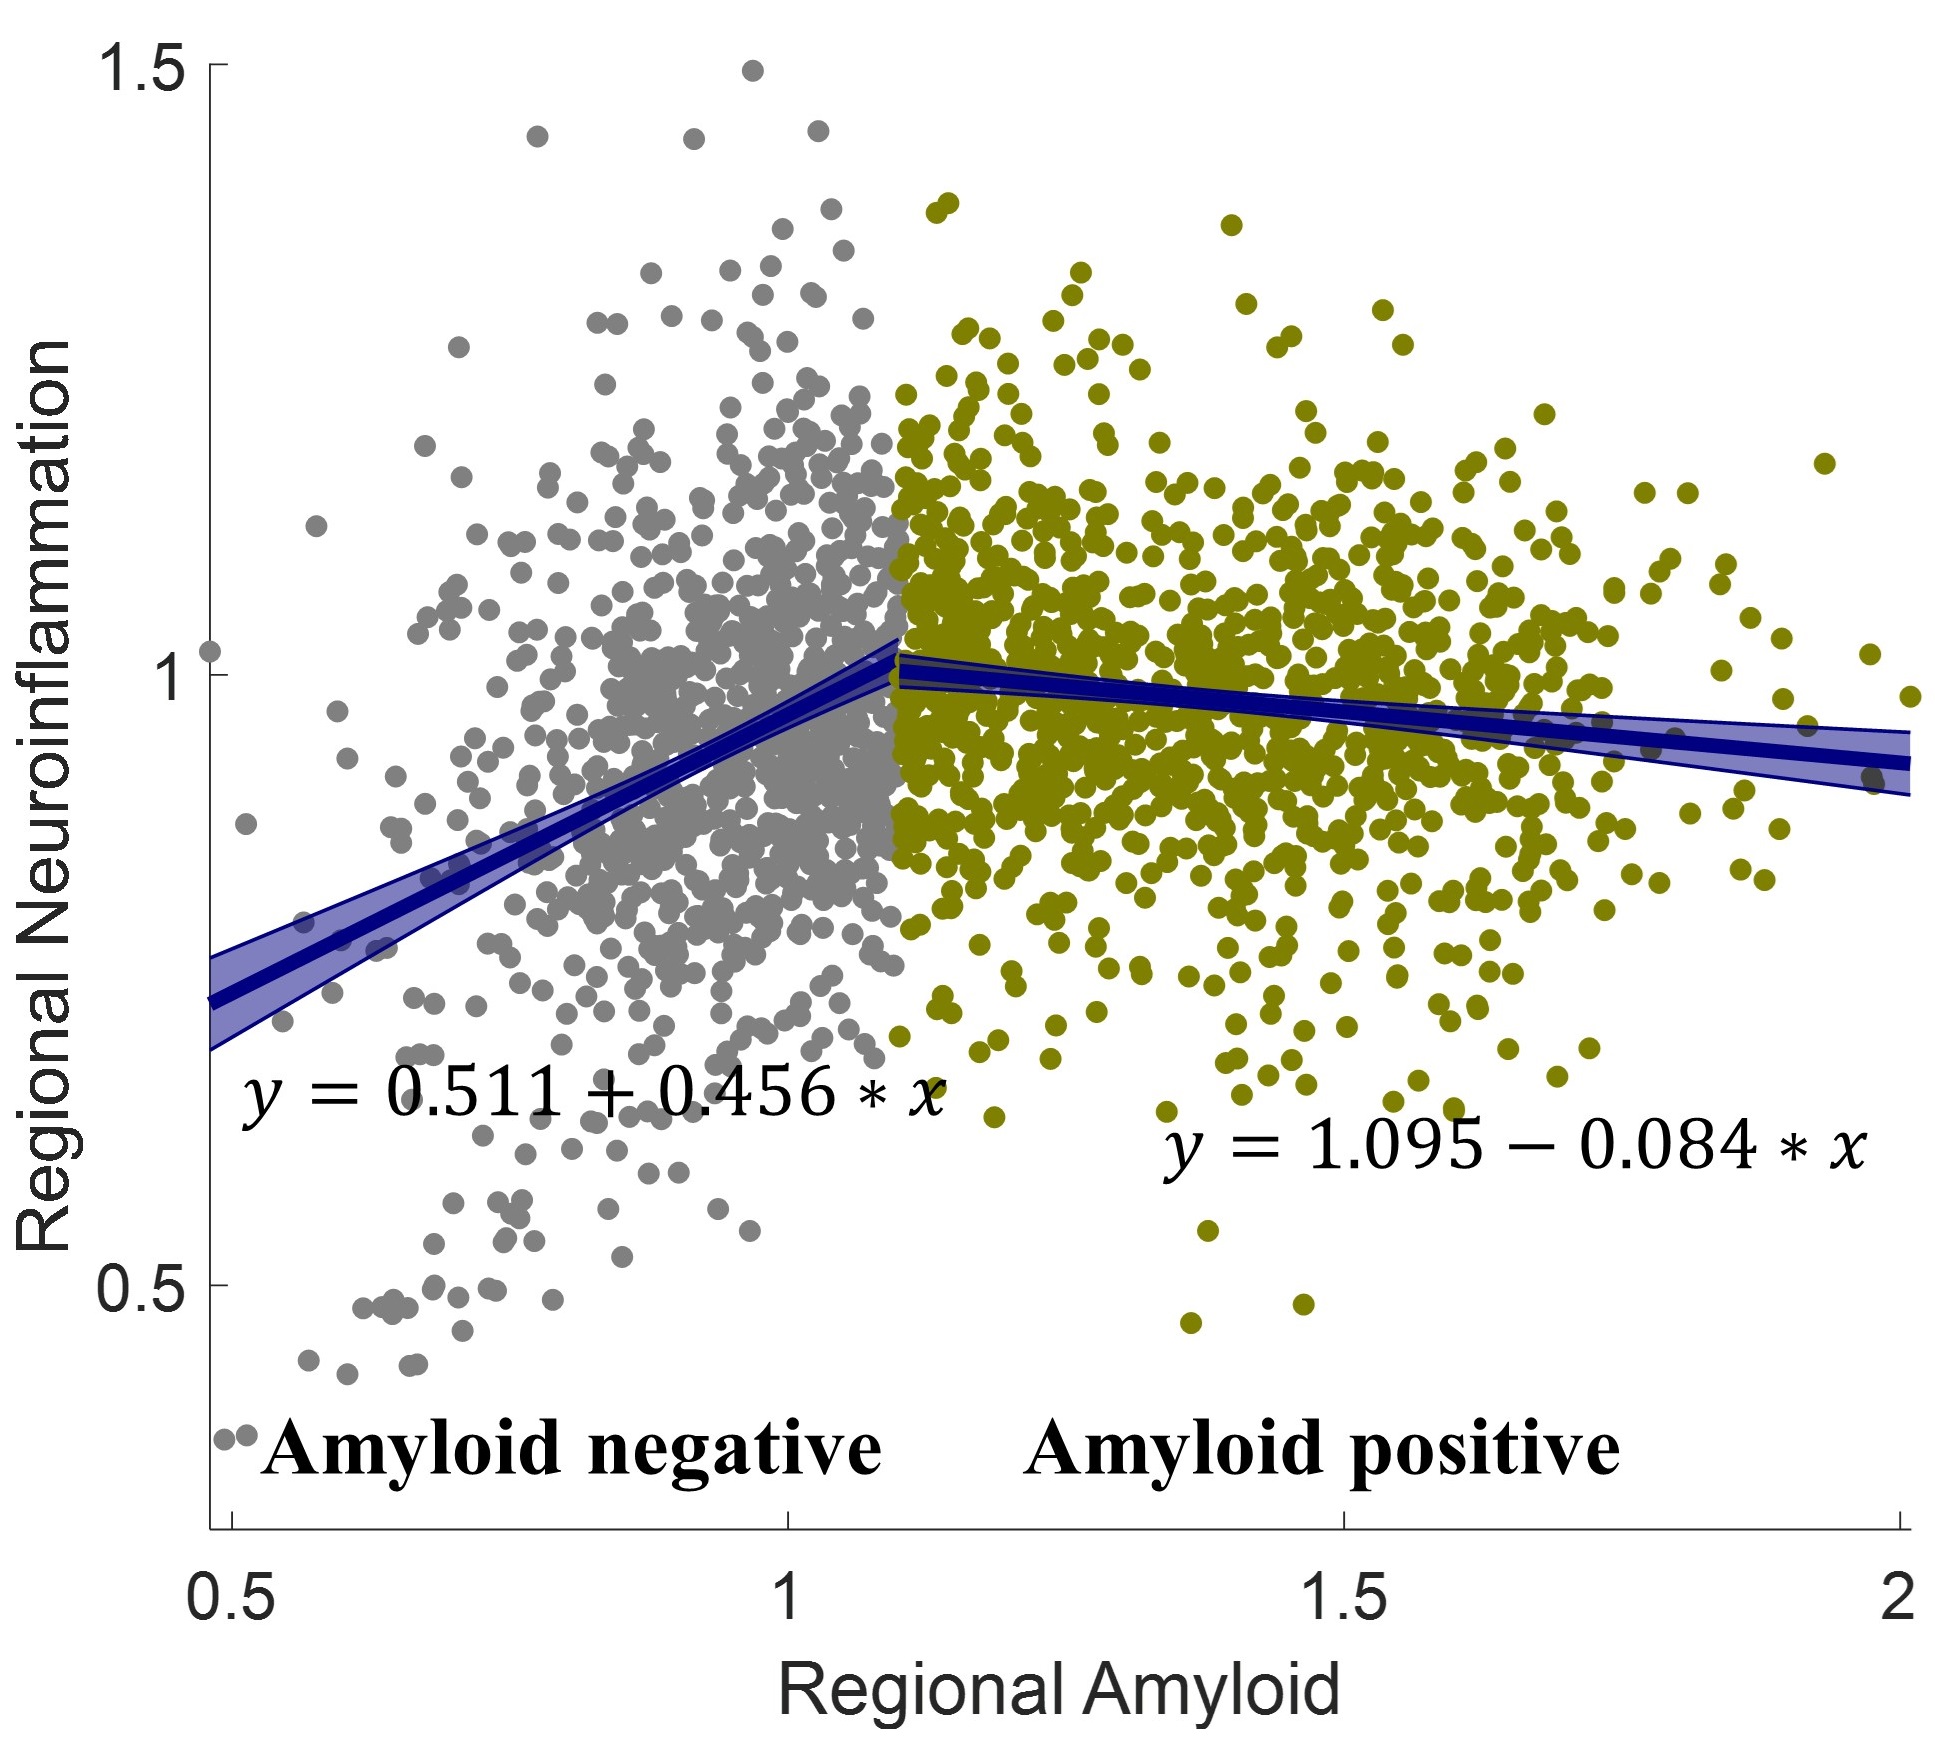
Functional connectivity between 78 ROIs was computed and the mean functional connectivity maps across subjects within each group were shown in Fig.1a. The effect size of the group difference between MCI/AD and CN was shown in Fig.1b. For both AV45 and GE180, the mean SUVR in temporal regions (bilateral middle and superior temporal gyrus) had the most significant group difference with effect size as 1.24 and 1.17, respectively. To evaluate whether neuroinflammation and amyloid deposition are relevant to altered functional connectivity, linear regression was applied on the functional connectivity on each edge to calculate the beta coefficient for the mean SUVR in temporal regions as shown in Fig.2. A higher beta coefficient indicates amyloid/neuroinflammation has more influence on the functional connectivity between two nodes. The GE180 SUVR images for three individual subjects with FWHM=4mm Gaussian smoothing were shown in Fig.3. Visually MCI had more localized higher SUVR intensity compared to CN subject, and AD dementia subjects showed higher SUVR intensity than CN subject across entire brain. A scatter plot between regional amyloid SUVR and its corresponding regional neuroinflammation SUVR for all subjects was shown in Fig.4. A threshold of 1.1 was defined for regional amyloid SUVR, with the observation that neuroinflammation accumulates in the regions having heavier amyloid burden in the regions under the threshold with linear regression curve y=0.511+0.456*x (p=0), but slightly decreases when above the threshold with linear regression curve y=1.095-0.084*x (p=0.003).Discussion
In this study, we investigated the pathology of AD in terms of neuroinflammation and amyloid deposition and their relevance to brain functional connectivity. A comparison of group difference map and beta coefficient maps (Fig.1b and Fig.2) suggested that the altered functional connectivity is a mixed effect of neuroinflammation and amyloid deposition, but driven mostly by neuroinflammation. The altered functional connectivity within frontal regions, between frontal and other brain regions, and between cingulate cortex and other brain regions is most relevant to neuroinflammation. In contrast, the altered functional connectivity between subcortical and occipital/parietal regions is more relevant to amyloid. There is a turning point between regional amyloid and neuroninflammation. Brain regional neuroinflammation was shown to be significantly positively correlated with amyloid burden under amyloid SUVR threshold 1.1 but remain relatively flat when above the threshold. This finding suggests that neuroinflammation could be a sensitive measurement at the preclinical stage of AD.Conclusion
GE180 PET imaging is a means of detecting inflammatory changes in individuals with amyloid pathology including those with preclinical disease.Acknowledgements
This research project was supported by the NIH (COBRE grant 5P20GM109025 and grant 1R01EB014284), Young Investigator award from Cleveland Clinic, a private grant from Peter and Angela Dal Pezzo, a private grant from Lynn and William Weidner, and a private grant from Stacie and Chuck Matthewson.References
1. Zhang, B., et al., Integrated systems approach identifies genetic nodes and networks in late-onset Alzheimer’s disease. Cell, 2013. 153(3): p. 707-720.
2. Heneka, M.T., et al., Neuroinflammation in Alzheimer's disease. The Lancet Neurology, 2015. 14(4): p. 388-405.
3. Behzadi, Y. Restom, K., Liau, J., Liu, T.T.. A component based noise correction method (CompCor) for BOLD and perfusion based fMRI. NeuroImage, vol 37, issue 1, August 2007, page 90-101.
Figures