0218
Quantitative assessment of cerebrovascular reactivity in older individuals: relationship to diagnosis, cognition and physical function1Department of Radiology, Johns Hopkins University, Baltimore, MD, United States, 2Department of Gerontology, Johns Hopkins University, Baltimore, MD, United States, 3Department of Psychiatry and Behavioral Sciences, Johns Hopkins University, baltimore, MD, United States, 4Department of Neurology, Johns Hopkins University, Baltimore, MD, United States, 5Department of Medicine, Johns Hopkins University, Baltimore, MD, United States, 6F.M. Kirby Research Center, Kennedy Krieger Institute, baltimore, MD, United States, 7Department of Neurosurgery, Johns Hopkins University, Baltimore, MD, United States
Synopsis
This study addresses the question, whether quantitative cerebrovascular reactivity (CVR) is a potential vascular biomarker in dementia with Alzheimer’s and vascular pathologies. This was tested in a cross-sectional study, where CBF-CVR assessed via Phase-Contrast-MRI during a CO2 breathing-challenge predicted cognitive and functional performance, disease-severity, and diabetes-risk, in 67 normal and mild-cognitive-impairment subjects. The performance and severity relationships remained robust after adjusting for Alzheimer’s disease and competing vascular markers. These findings suggest that quantitative CBF-CVR has potential as a sensitive biomarker for early changes in cognitive and functional performance, and of disease severity in dementia, independent of Alzheimer’s disease.
Introduction
Vascular dementia represents the second leading cause of cognitive impairment, after Alzheimer’s disease (AD), and is also a major component in mixed dementia1. However, compared to Alzheimer’s disease, for which amyloid, tau, and neurodegeneration are established hallmarks, biomarkers for vascular dementia are insufficiently developed. White-matter-hyperintensities (WMH) have been the most widely used index for vascular diseases, but its association with clinical outcome and cognitive function is moderate2. Cerebrovascular Reactivity (CVR) measures vasodilation of small vessels to stimuli such as CO2, and has recently been suggested to be a sensitive marker for cognitive impairment in elderly individuals3,4,5. CVR is typically measured using Blood-oxygenation-level-dependent (BOLD) signal while the subject breathes CO2 gas mixture and room-air in an interleaved fashion. However, the BOLD signal represents a complex interplay between several parameters including Cerebral-Blood-Flow (CBF), Cerebral-Blood-Volume, hematocrit and Cerebral-Metabolic-Rate-of-Oxygen6, thus quantitative interpretation of BOLD signal is known to be challenging. The present study will therefore apply CBF-based CVR in a group of older individuals with mild-cognitive-impairment (MCI), AD, and normal cognition, and study the relationship of CBF-CVR with diagnostic category, cognitive and physical function, amyloid and tau burden, and vascular risk factors.Methods
Participants: A cross-sectional study was conducted in 67 older subjects, aged 69±6.5 years (22 cognitively normal, 37 mild cognitive impairment, and 8 mild dementia). Participants were enriched for vascular risks.Cognitive and Physical Function: Four cognitive-domains, verbal memory, executive function, language, and processing speed were assessed and converted to z-scores. Further, overall cognition was assessed via MoCA (Montreal-Cognitive-Assessment) and a composite-cognitive-score, based on z-score average of the four domains. Gait speed (time to walk 4-meters) and five-chair-stands7 (time to complete five chair stands) were measured. Clinical-Dementia-Rating (CDR)8 was determined to index disease severity.
Vascular Risk Score (VRS): A composite of five clinical histories, i.e. hypertension (1=recent, 0=remote/absent), hypercholesterolemia (1=recent, 0=remote/absent), diabetes (1=recent, 0=remote/absent), smoking (1≥100cigarettes-smoked, 0=absent), and body-mass-index(1 if >30, 0 if not), was used9. The VRS score therefore ranges from 0 to 5.
MRI: Experiments were performed on a 3 Tesla (Philips) MRI. Subjects wore a mouthpiece and breathed room-air for 1 minute followed by ‘CO2-enriched-air’ (5%CO2, 21%O2, 74%N2) for 2 minutes. CBF-CVR was measured with a Phase-Contrast (PC) MRI sequence10 (encoding velocity=40cm/s for room-air and 60cm/s for hypercapnia, slice-thickness=5mm, FOV=200x200mm2, TR/TE =19/9.6ms, voxel size 0.5x0.5mm2, 4 averages, duration=62s), which measures blood flux at the location of Superior-Sagittal-Sinus (SSS) (Figure 1). The PC-MRI was performed once during room-air breathing and another time during CO2 breathing, with a 1-minute gap between two scans to allow the hypercapnia to reach a steady state. Breathing-rate and End-tidal (Et)-CO2 were recorded using capnography.
A FLAIR MRI was also performed and was rated for Fazekas score by a neuroradiologist.
CBF-CVR(%ΔCBF/ΔEtCO2(mmHg)) was computed using the following equation:
$$CBF-CVR=\frac{\frac{Hypercapnia SSS flux (ml/min)-Room air SSS flux(ml/min)}{Room air SSS flux (ml/min)}}{Hypercapnia EtCo2(mmHg)-Room air EtCo2(mmHg)}$$
Biofluid Markers: AD pathological markers, i.e. Aβ40, Aβ42, tau, and p-tau181(picograms/ml), were measured in Cerebrospinal-Fluid (N=47) using electrochemiluminescence assays. Blood-based vascular biomarkers of HbA1c (mg/dL), homocysteine(umol/l), HDL(mg/dL), and LDL(mg/dL) were measured by a core lab.
Statistical Analysis: Multi-linear regression models were used to test the associations between CBF-CVR and cognition (overall cognition & domains), physical function (gait speed & five-chair-stands), and disease-severity (CDR). These analyses were also repeated after accounting for AD pathology biomarkers and vascular scores.
Results and Discussion
Table 1 summarizes participant demographics. We first examined whether CBF-CVR can differentiate diagnostic categories. CBF-CVR (%/mmHg) was found to be lower (p=0.03, Figure 2a) in the impaired subjects relative to the healthy controls. Next, we studied the association between CBF-CVR and cognitive and physical function. Higher CBF-CVR was associated with better cognitive performance [MoCA (p=0.000066) (Figure 2b), composite-cognitive-score (p=0.003), and language domain (p=0.00002)], better physical function [faster gait (p=0.002) & faster five-chair-stands (p=0.009)], and lower disease-severity [global CDR rating (p=0.005) & CDR sum-of-boxes (p=0.002)] (Table2).To determine whether these relationships are independent of AD pathology, we repeated the analyses after adding the CSF-derived amyloid and tau markers as covariates. As can be seen in Table 2 (middle column), most of these associations (with the exception of five-chair-stands time) remained. We further added other potential vascular disease markers, specifically WMH Fazekas score, VRS, and basal CBF, to the regression model, and found that the associations between CBF-CVR and cognitive and physical function remained (Table 2, right column) with the exception of five-chairs-stands time. These findings suggest that CBF-CVR can independently predict cognitive function beyond amyloid and tau pathology.
We also studied the relationship of CBF-CVR with vascular risk scores and blood-based vascular biomarkers. CBF-CVR was not associated with VRS. It was related to HbA1c (p=0.03), but not other blood biomarkers.
As a technical point, we also measured BOLD-based CVR and studied the correlation between these two techniques (Figure 3). A strong correlation (p=0.00002) between CBF-CVR and BOLD-CVR were observed.
Conclusion
To our best knowledge, the present work is the first study to show that CBF-CVR can not only differentiate diagnostic categories, and predict performance in cognitive and physical function, but that these associations were independent of AD pathology.Acknowledgements
We thank Dengrong Jiang for his intellectual feedback. Partly supported by NIH UH2 NS100588.
References
1. Schneider JA, Arvanitakis Z, Bang W, Bennett DA. Mixed brain pathologies account for most dementia cases in community-dwelling older persons. Neurology 2007; 69:2197-2204.
2. De Groot JC, De Leeuw FE, Oudkerk M, et al. Periventricular cerebral white matter lesions predict rate of cognitive decline. Ann Neurol 2002; 52:335-341.
3. Yezhuvath US, Uh J, Cheng Y, et al. Forebrain-dominant deficit in cerebrovascular reactivity in Alzheimer's disease. Neurobiol Aging 2012; 33:75-82.
4. Thomas BP, Sheng M, Tseng BY, et al. Reduced global brain metabolism but maintained vascular function in amnestic mild cognitive impairment. J Cereb Blood Flow Metab 2017; 37:1508-1516
5. Richiardi J, Monsch AU, Haas T, et al. Altered cerebrovascular reactivity velocity in mild cognitive impairment and Alzheimer's disease. Neurobiol Aging 2015; 36:33-41.
6. Halani S, Kwinta JB, Golestani AM,etal. Khatamian YB, & Chen, JJ. Comparing cerebrovascular reactivity measured using BOLD and cerebral blood flow MRI: The effect of basal vascular tension on vasodilatory and vasoconstrictive reactivity. Neuroimage, 2015; 110:110-123
7. Guralnik JM, Simonsick EM, Ferrucci L, et al. A short physical performance battery assessing lower extremity function: association with self-reported disability and prediction of mortality and nursing home admission. J Gerontol. 1994;49:M85–M94.
8. Morris JC: The clinical dementia rating (CDR): Current version and scoring rules, Neurology.1993; 43:2412–2414.
9. Gottesman RF, Schneider AL, Zhou Y, et al. Association Between Midlife Vascular Risk Factors and Estimated Brain Amyloid Deposition. JAMA 2017; 317:1443-1450.
10. Liu P, Jill B & Lu H (2019). Cerebrovascular reactivity (CVR) MRI with CO2 challenge: A technical review. Neuroimage. 2019; 187: 104-115.
Figures
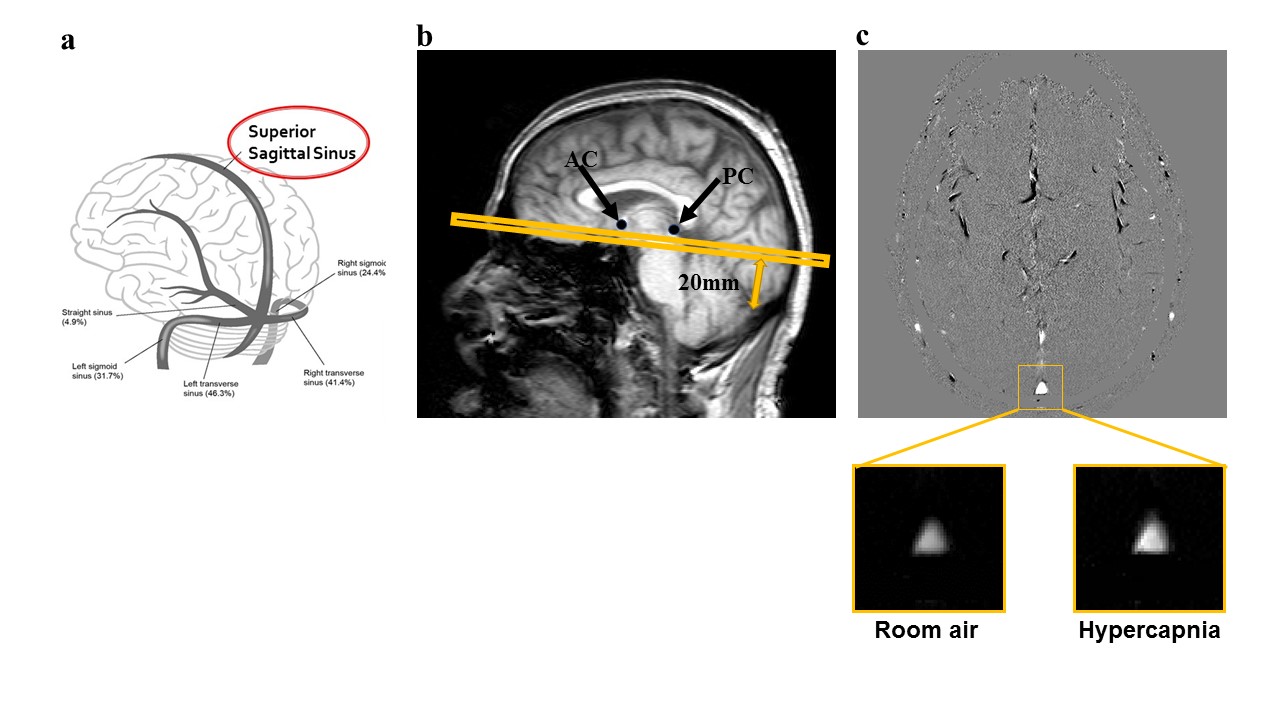
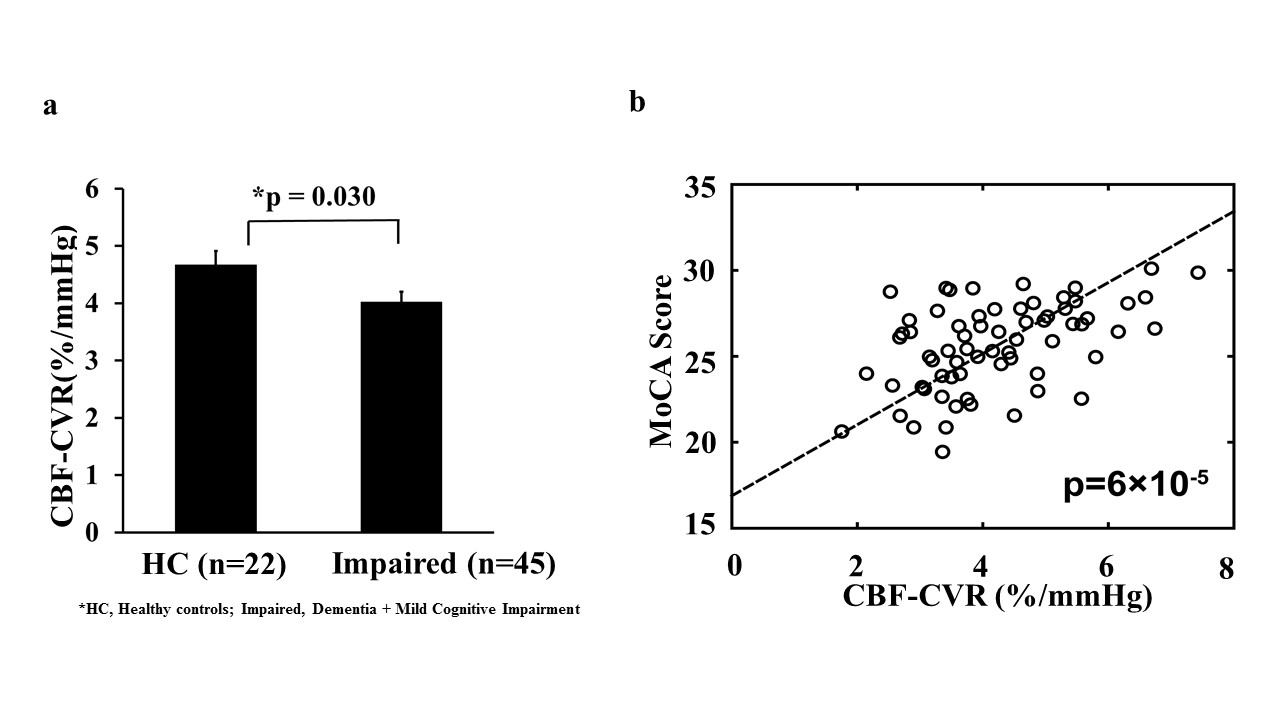
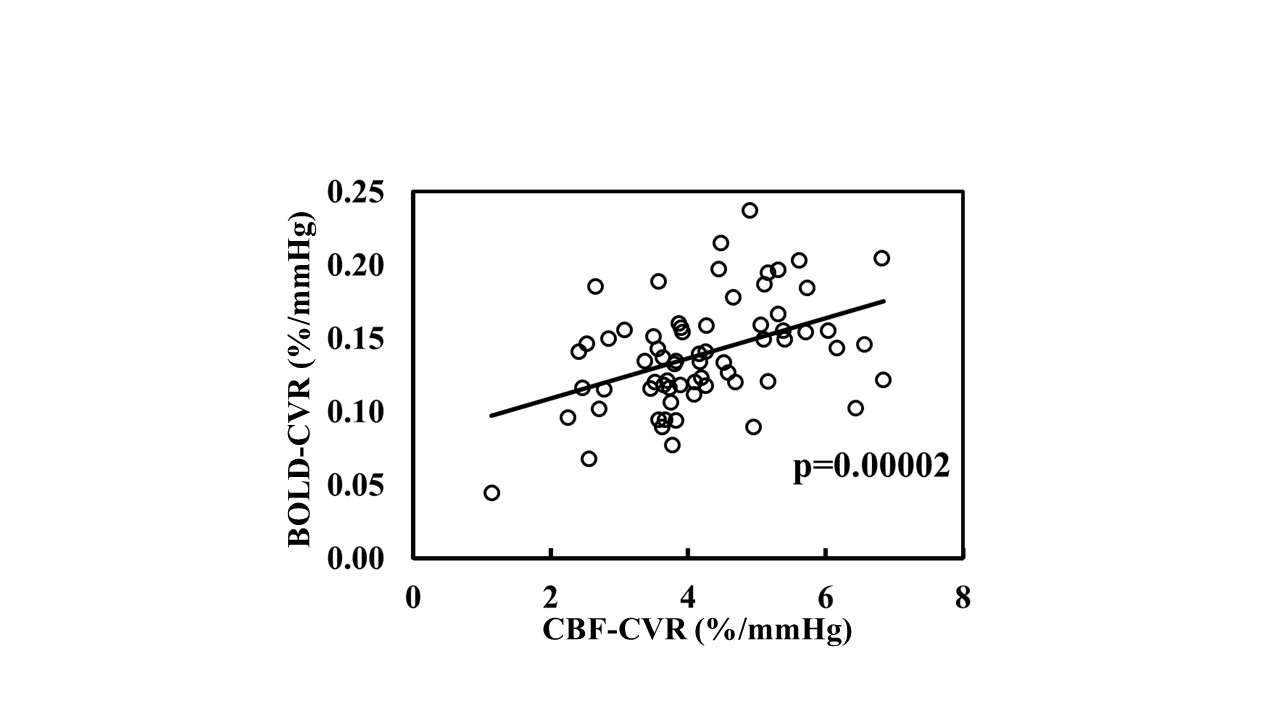
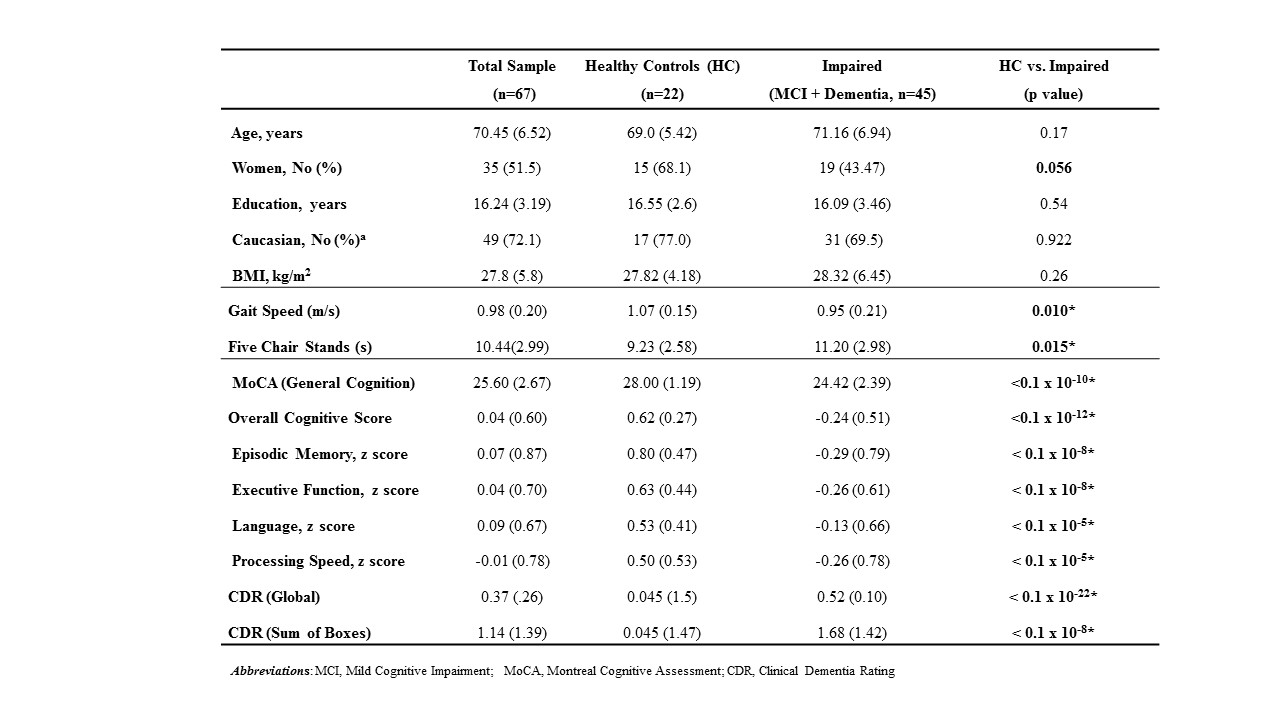
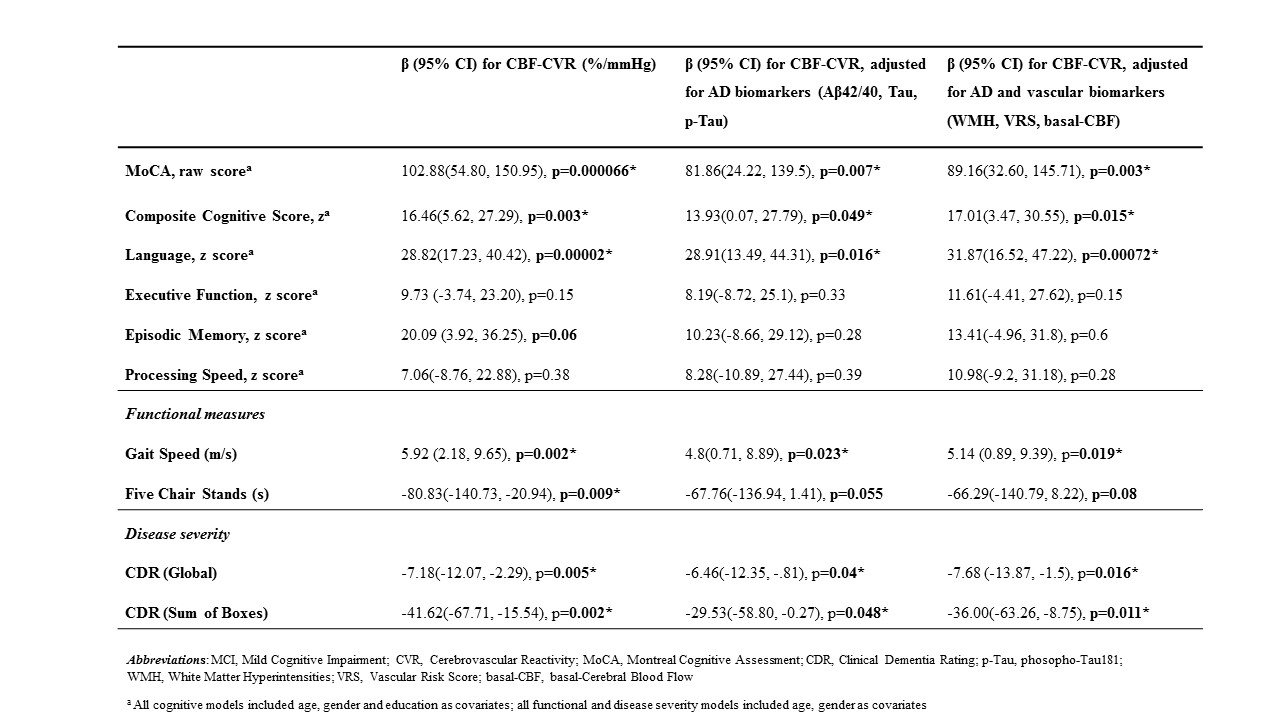
Table 2. Linear Regression Models for the association of CBF-CVR with cognitive and functional performance, and disease severity in HC and Impaired (n=67). Left column: models are not adjusted for AD markers. Middle column: models after adjusting for AD markers, Right column: models adjusted for AD and vascular markers