0217
Association of Hippocampus Fimbria Iron level measured by QSM with AD stages, Hippocampus Atrophy and Aging1Department of Imaging and Interventional Radiology, The Chinese University of Hong Kong, Hong Kong, Hong Kong, 2Centre For Clinical Research And Biostatistics, Centre for Clinical Research and Biostatistics, The Chinese University of Hong Kong, Hong Kong, Hong Kong, 3Department of Electrical Engineering and Computer Sciences, University of California, Berkeley, USA, CA, United States, 4Division of Neurology, The Chinese University of Hong Kong, Hong Kong, Hong Kong, 5Philips, Hong Kong, Hong Kong
Synopsis
Iron accumulation has been reported in specific brain regions of Alzheimer disease patients. In this study, we used Quantitative Susceptibility Mapping to show iron deposition in hippocampal fimbria and its strong correlation with hippocampus volume and AD stages. Our result might provide further insight of potential disconnection injury in AD pathophysiology.
Introduction
Iron is essential in various biological functions of the body including the central nervous system. [1] Its abnormal accumulation can cause the formation of reactive oxygen species, which in turn can result in oxidative damage leading to cell death. [2] In the brain, iron accumulation occurs as part of the aging process but is excessive in neurodegenerative disorders. In particular, iron dyshomeostasis is emerging as an important contributor to the deposition of amyloid plaques and tau tangles in the brain of patients with Alzheimer’s disease (AD). [3][4]The hippocampus is a specialized cortical (grey matter) tissue in the mesial temporal lobe and is a prime target in AD. [5] It is connected to the rest of the brain via the fornix, which emerges from the superior surface of the hippocampus as a white matter tract bundle called the fimbria. [6] Increased iron levels have been reported in the hippocampus of AD patients, but to our knowledge, involvement of the fimbria has not been ascertained. As the fimbria is an important connecting bridge between the hippocampus and fornix (and to the rest of the brain), iron accumulation in the fimbria can presumably cause disconnection, thereby disrupting memory function. [7] Further, iron levels might be exploited as a biomarker to allow differentiation between normal and AD stages.
In this study, we explore the association of iron levels in the hippocampus fimbria, measured by magnetic tissue susceptibility, with different AD stages, hippocampal volumes and aging.
Method
The study received Institutional Review Board approval. We included 61 subjects (age: 55-80 years) who underwent PET and MRI within 3 months interval period. The 3 cohorts comprised of 11 with late-stage AD, 13 with early-stage AD and 37 controls. We used ATN classification for diagnosis [8] and employed amyloid, tau and FDG PET and volumetric T1w MRI for visual medial temporal atrophy assessment. [9] The 3D T1w MRI scans were additionally used for volumetric analysis, subsequent processing, image registration, hippocampal-subfields segmentation and anatomical labelling.Quantitative susceptibility mapping (QSM) is a novel technique for the identification and quantification of tissue iron and other chemicals. [10] QSM was acquired with a resolution 0.6x0.8x2mm, 8 echoes with TE1 4.0ms and delta TE 5.2ms, TR 45ms, total 60 slices with scan time ~5min. All datasets were acquired using a Philips Achieva TX 3.0T scanner (Philips Healthcare, the Netherlands).
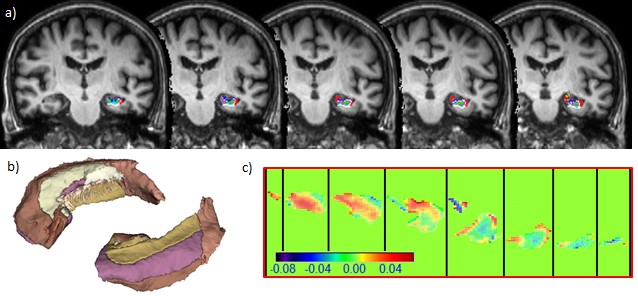
The complete hippocampal fimbria segmentation processes were performed using FreeSurfer (http://surfer.nmr.mgh.harvard.edu/) using 3D T1w images, and meticulously co-registered with the QSM images. The segmented fimbria regions served as VOIs and applied on the QSM images to extract their respective fimbria voxel-based QSM values (Figure 1). Various QSM measurements (mean, median, standard deviation, minimum and maximum values) were obtained and analysed. To compare the volume of each fimbria subfield with QSM, fimbria volumes were normalized to individual estimated total intracranial volume (eTIV).
Result
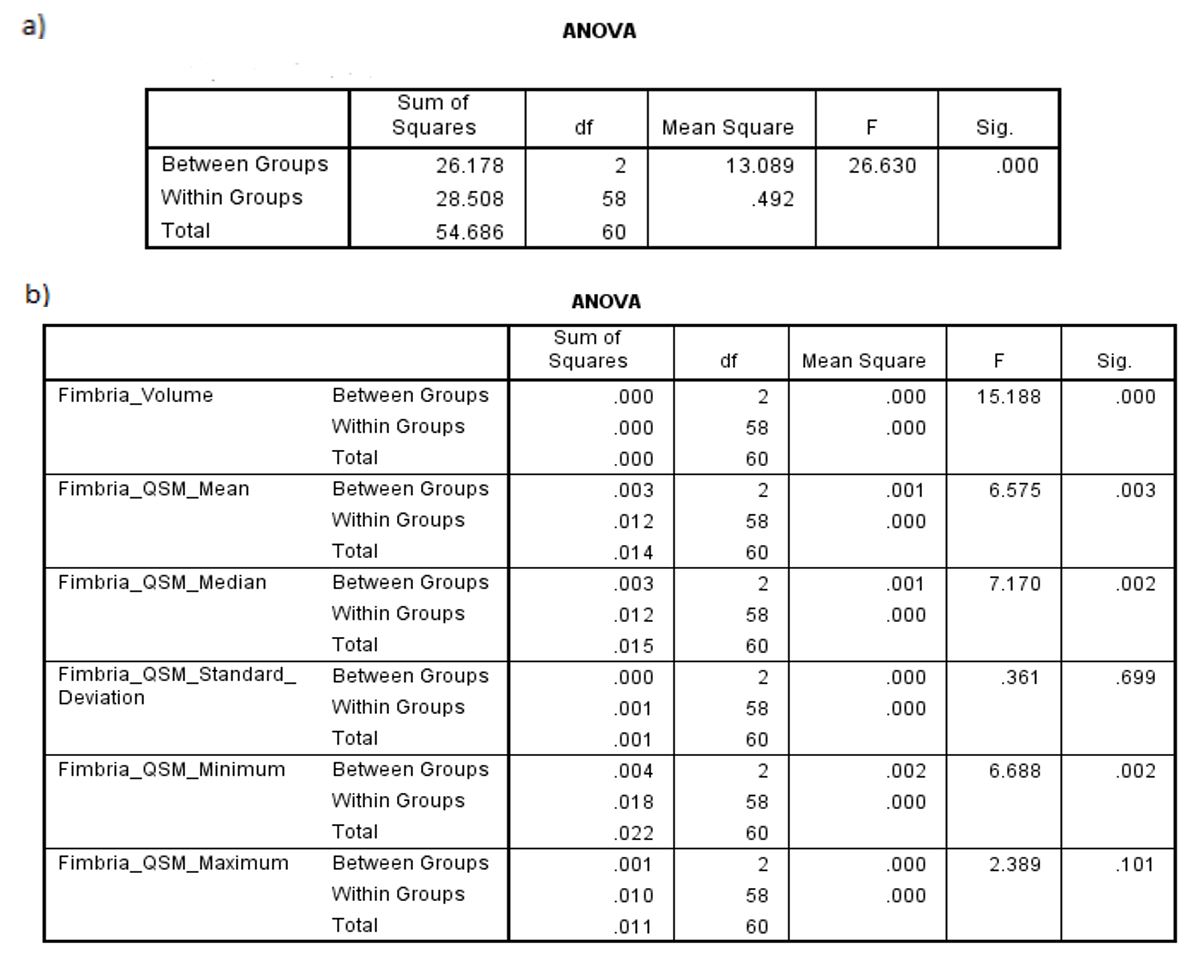
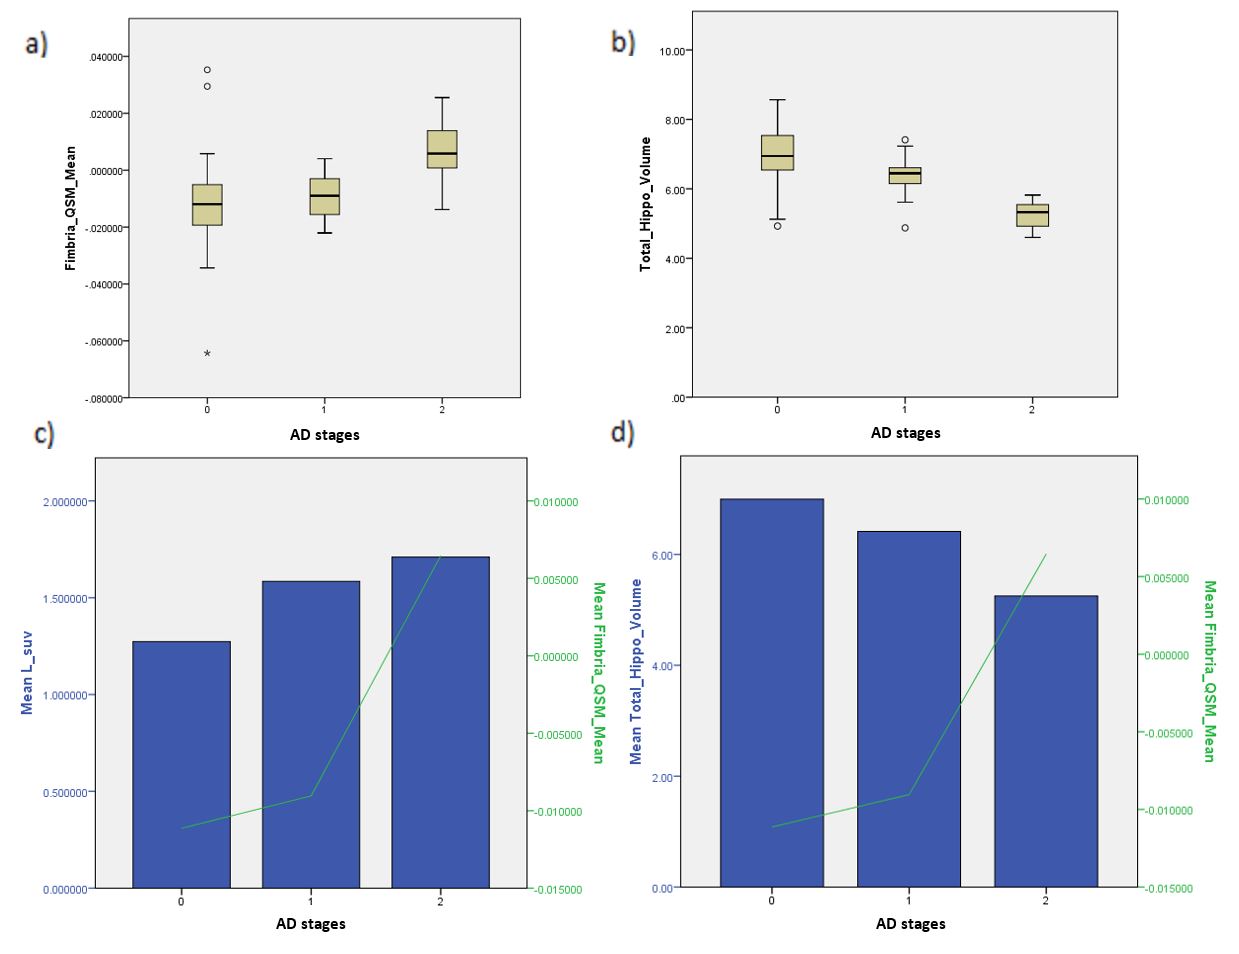
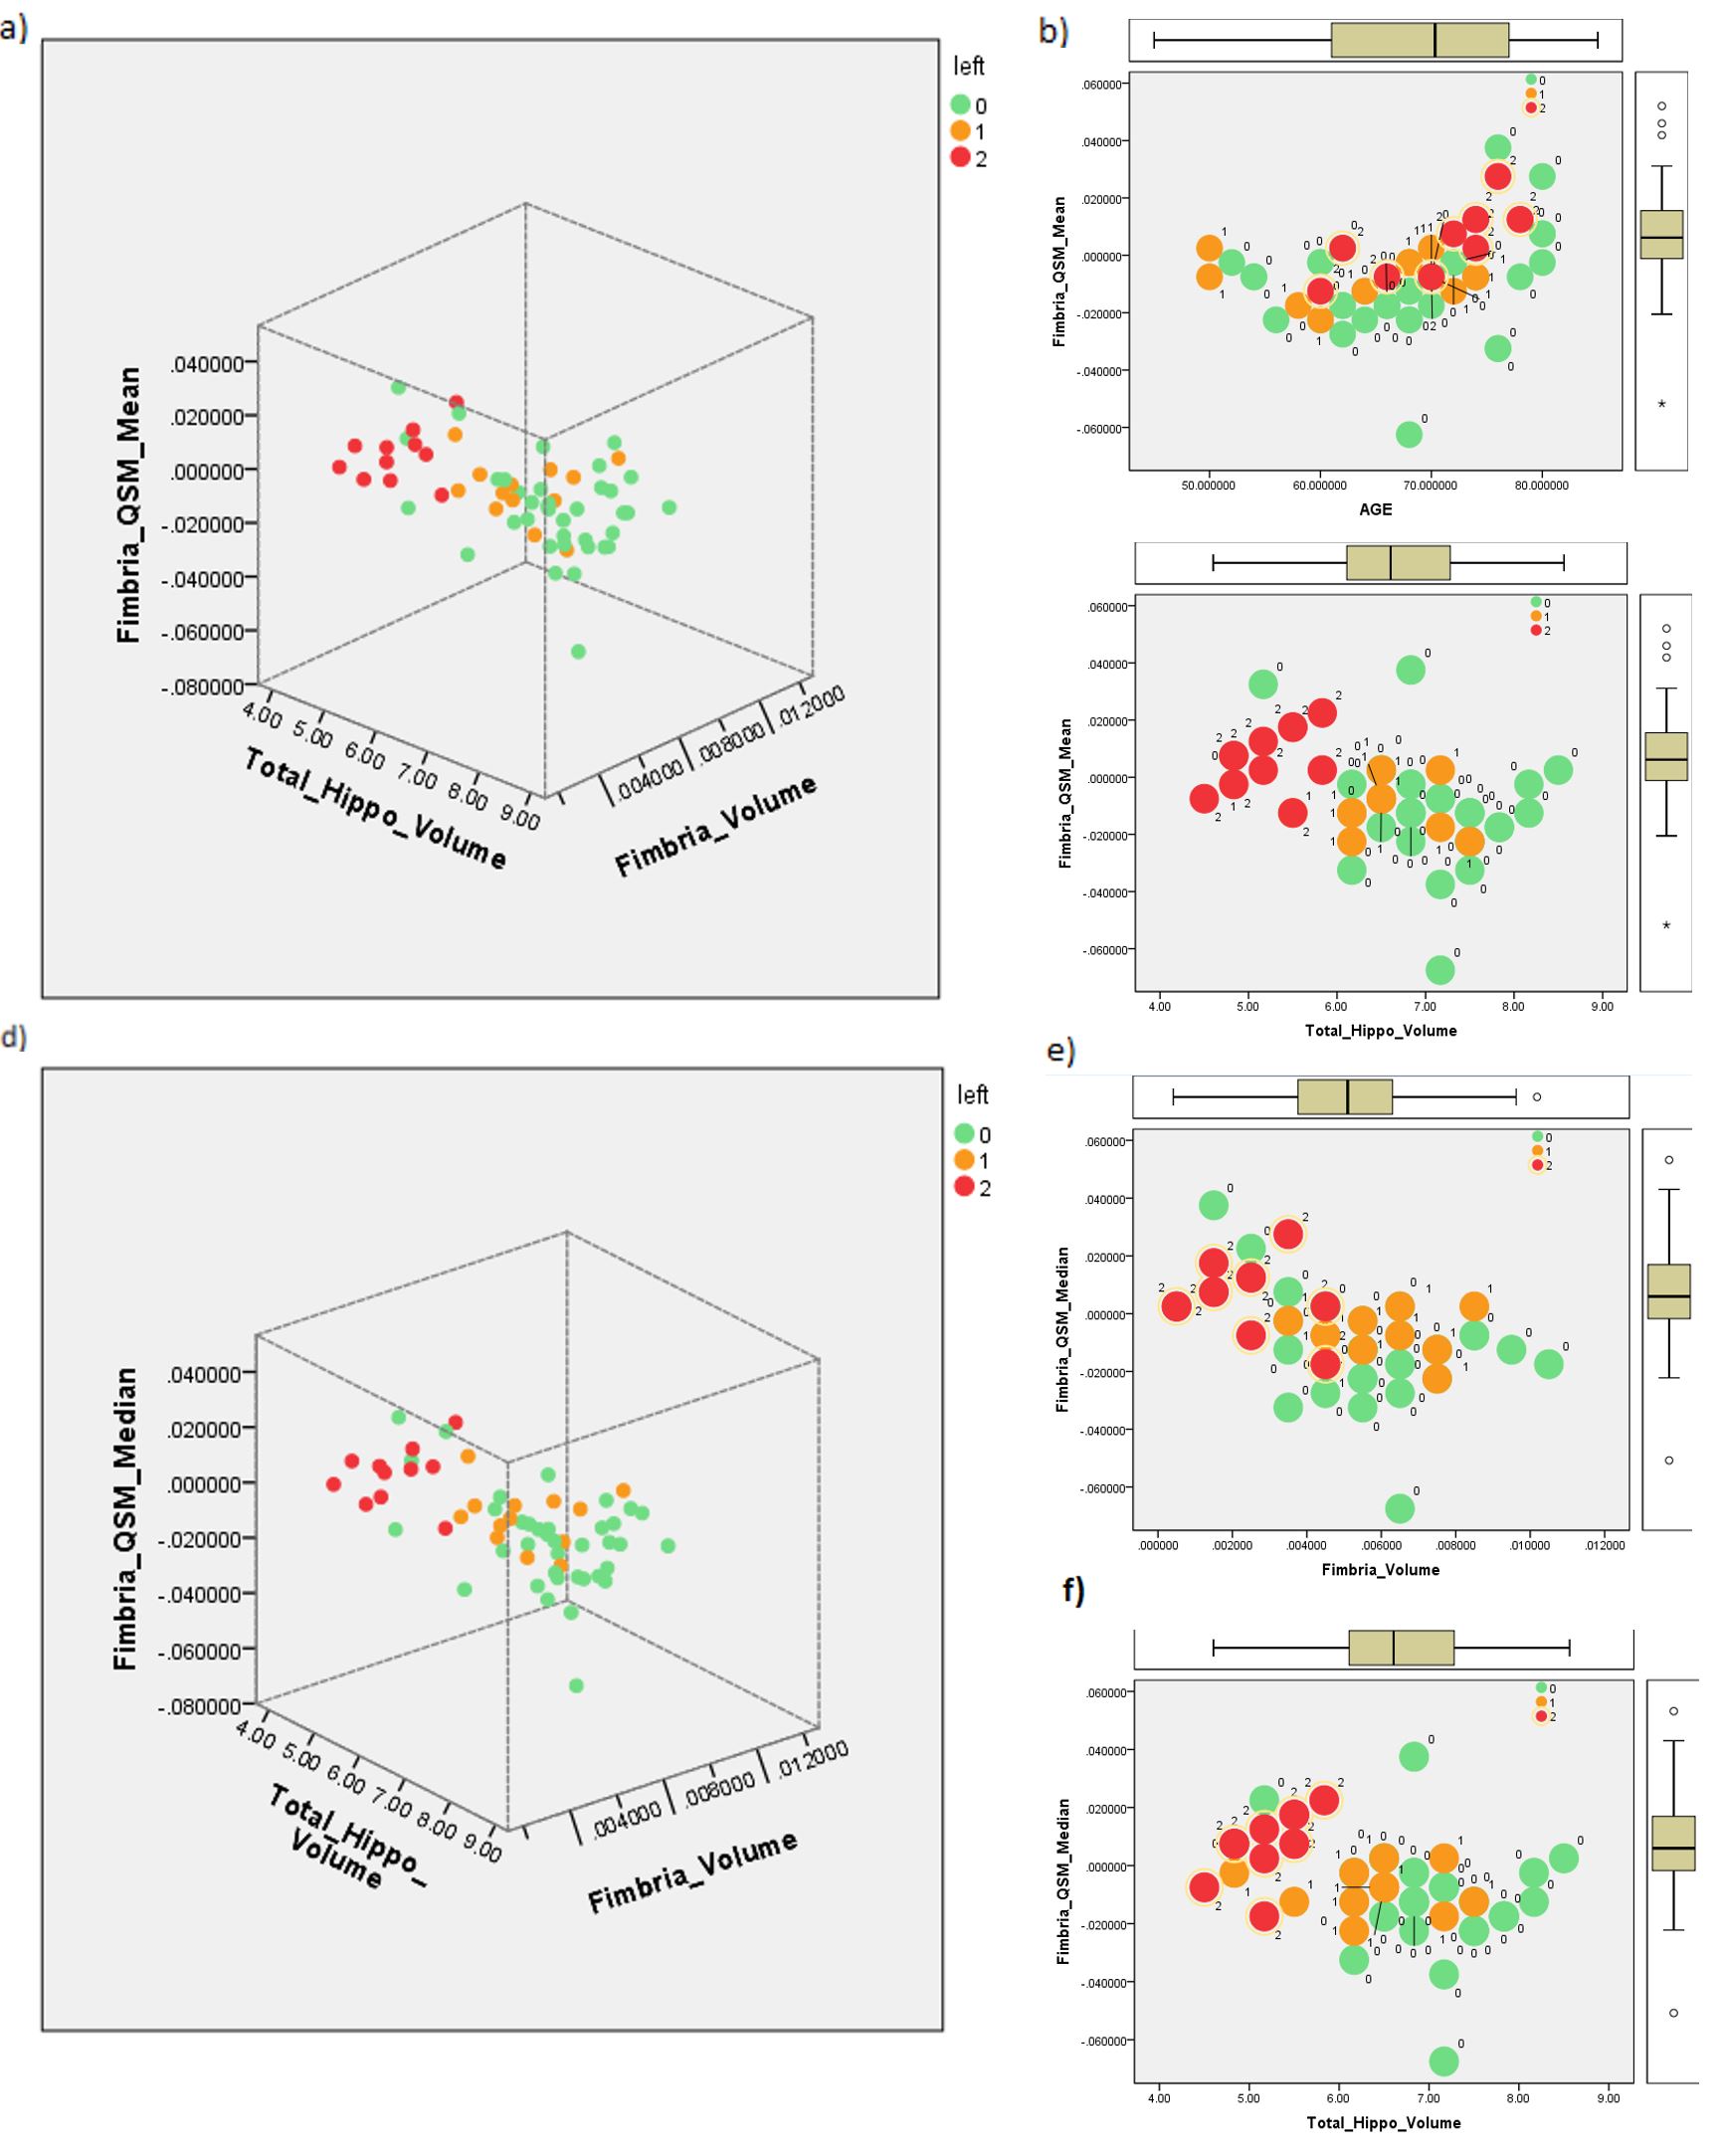
Table1 illustrates significant differences of hippocampal volumes and fimbria QSM values across the 3 cohorts (Tab.1. A, B). QSM values were positively correlated with global amyloid-ß uptake (Fig.2 A&C), and negatively correlated with hippocampal volumes (Fig.2 B&D). The scatter plots (Fig.3 A-F) of fimbria QSM measurements with normalised fimbria volumes and hippocampus volumes including age factor show clustering of cohorts, particularly of the late-stage AD group and positive trend with age. [control=0, Early=1, Late=2]Discussion
White matter can be carefully differentiated from grey matter and iron deposition by their inherent QSM values. Fimbria, as a myelinated white matter tissue, returns a negative voxel-based QSM value in normal state which we observed in relatively young controls. In iron-excessive state, fimbria QSM values change from negative to positive (or approach to positive), which we observed in the early and late-stage AD cohorts. Demyelination may also contribute to the loss of negative susceptibility. [11] Late AD patients could be differentiated by their strong positive QSM values, which probably reflect more established iron deposition and demyelination in the fimbria. Meanwhile, controls trended to more negative QSM values than early AD patients, but both groups still showed overlap and could not be differentiated from each other. We postulate that the dynamic tissue changes of degeneration and repair in aging and early disease stage might account for this observation.Conclusion
Our study shows strong associations between fimbria QSM values with hippocampus volumes and AD stages, and additional effect from aging. Our results suggest probable iron deposition and increasing iron levels in the hippocampal fimbria with advancing age and AD stages, and may provide further insight into AD pathophysiology, where potential disconnection injury occurs concurrent with hippocampal damage.Acknowledgements
This study was supported by the Innovation and Technology Commission of the government of Hong Kong SAR and a grant from the Research Grants Council of the Hong Kong SAR (Project No.SEG CUHK02).References
1. Rouault, T. (2013). Iron metabolism in the CNS: implications for neurodegenerative diseases. Nature Reviews Neuroscience, 14(8), pp.551-564.
2. Anderson, G. (2007). Mechanisms of iron loading and toxicity. American Journal of Hematology, 82(S12), pp.1128-1131.
3. Chen, M., Zheng, J., Liu, G., Zeng, C., Xu, E., Zhu, W., Anderson, G. and Chen, H. (2019). High Dietary Iron Disrupts Iron Homeostasis and Induces Amyloid-β and Phospho-τ Expression in the Hippocampus of Adult Wild-Type and APP/PS1 Transgenic Mice. The Journal of Nutrition.
4. Raven, E., Lu, P., Tishler, T., Heydari, P. and Bartzokis, G. (2019). Increased Iron Levels and Decreased Tissue Integrity in Hippocampus of Alzheimer's Disease Detected in vivo with Magnetic Resonance Imaging.
5. Won, S., Lee, J., Park, U., Gwag, J., Gwag, B. and Lee, Y. (2011). Iron mediates endothelial cell damage and blood-brain barrier opening in the hippocampus after transient forebrain ischemia in rats. Experimental and Molecular Medicine, 43(2), p.121.
6. Evans, T., Adams, H., Licher, S., Wolters, F., van der Lugt, A., Ikram, M., O'Sullivan, M., Vernooij, M. and Ikram, M. (2018). Subregional volumes of the hippocampus in relation to cognitive function and risk of dementia. NeuroImage, 178, pp.129-135.
7. Chai, S. and White, N. (2004). Effects of Fimbria-Fornix, Hippocampus, and Amygdala Lesions on Discrimination Between Proximal Locations. Behavioral Neuroscience, 118(4), pp.770-784.
8. Jack, C., Bennett, D., Blennow, K., Carrillo, M., Dunn, B., Haeberlein, S., Holtzman, D., Jagust, W., Jessen, F., Karlawish, J., Liu, E., Molinuevo, J., Montine, T., Phelps, C., Rankin, K., Rowe, C., Scheltens, P., Siemers, E., Snyder, H., Sperling, R., Elliott, C., Masliah, E., Ryan, L. and Silverberg, N. (2019). NIA-AA Research Framework: Toward a biological definition of Alzheimer's disease.
9. Pereira, J., Cavallin, L., Spulber, G., Aguilar, C., Mecocci, P., Vellas, B., Tsolaki, M., Kłoszewska, I., Soininen, H., Spenger, C., Aarsland, D., Lovestone, S., Simmons, A., Wahlund, L. and Westman, E. (2019). Influence of age, disease onset andApoE4on visual medial temporal lobe atrophy cut-offs.
10. Liu, C., Li, W., Tong, K. A., Yeom, K. W., & Kuzminski, S. (2015). Susceptibility‐weighted imaging and quantitative susceptibility mapping in the brain. Journal of magnetic resonance imaging, 42(1), 23-41.
11. Liu, C., W., Jonson, G. A., & Wu, B. (2011). High-field (9.4 T) MRI of Brian dysmyelination by quantitative mapping of magnetic susceptibility. NeuroImage, 56(3), 930-938.
Figures