0216
Progressive memory circuit impairments along with Alzheimer’s disease neuropathology spread: evidence from in vivo neuroimaging1The 2nd Affiliated Hospital of Zhejiang University, School of Medicine, Hangzhou, China, 2GE Healthcare, Shanghai, China
Synopsis
Along with Alzheimer’s disease (AD) continuum, AD neuropathologies propagate trans-neuronally, causing the memory circuit disorganization. The ‘misfolded tau protein propagation theory’ indicates that tau pathology spread through synaptic connectivity and cause the structural impairments. Here, we hypothesized that HP is the first to suffer from AD neuropathology, then followed by the connected tract and downstream cortex. We defined the memory circuit as the hippocampus (HP), cingulum-angular bundles (CAB), and precuneus cortex, respectively representing the starting point, core connecting fibre and connected downstream cortex. Our results support the tau propagation theory in the memory circuit in vivo.
Synopsis
Along with Alzheimer’s disease (AD) continuum, AD neuropathologies propagate trans-neuronally, causing the memory circuit disorganization. The ‘misfolded tau protein propagation theory’ indicates that tau pathology spread through synaptic connectivity and cause the structural impairments. Here, we hypothesized that HP is the first to suffer from AD neuropathology, then followed by the connected tract and downstream cortex. We defined the memory circuit as the hippocampus (HP), cingulum-angular bundles (CAB), and precuneus cortex, respectively representing the starting point, core connecting fibre and connected downstream cortex. Our results support the tau propagation theory in the memory circuit.INTRODUCTION
Along with Alzheimer’s disease (AD) continuum, AD neuropathologies propagate trans-neuronally, causing the memory circuit disorganization and memory deficit. The possible neuropathological mechanism is the ‘misfolded tau protein propagation theory’: tau pathology spread through synaptic connectivity and cause the structural impairments.1 Similar to Braak stage, tau pathology arises early in the transentorhinal cortex, from where they spread to limbic regions, followed by inferior frontal and parietal cortex.2,3 Moreover, the white matter may be the mediation in neuropathology spread, considering that structural tract alterations can predict downstream tau accumulation in amyloid-positive older individuals.4 The exploration of memory circuit injury mechanism is expected to provide important clues for further treatment. Previous studies have demonstrated the cingulum bundle is the region affected most severely, connecting the medial temporal lobe with the posterior cingulate cortex.5-7 To better assess tract-level degeneration and capture the alteration in the conducting ability of the specific impaired WM segments , we used an establish tract reconstruction technique TRACULA (TRActs Constrained by UnderLying Anatomy).8 TRACULA proved its utility and sensitivity in reflecting the specific tract alternations on both whole tract-level and waypoint-wise within the selected pathway.9,10 In the current study, we assessed the impairment pattern of memory circuit along the pathophysiological continuum of AD. According to the tau propagation theory, we hypothesized that HP is the first to suffer from AD neuropathology, then followed by the connected tract and downstream cortex.METHODS
Data used in the preparation of this article were obtained from the Alzheimer’s disease Neuroimaging Initiative (ADNI) database (http://adni.loni.usc.edu). Based on the biological diagnosis criteria, we divided subjects into 5 groups by setting the CSF cutoff point at 192 pg/ml for Aβ1-42 (A) and 23 pg/ml for P-tau181 (T): Group 0, cognitively normal subjects (CN) with normal Aβ1-42 and P-tau181 (A−T−); Group 1, CN with A+T−; Group 2, CN with A+T+; Group 3, mild cognitive impairments (MCI) with A+T+; Group 4, demented subjects with A+T+. T1 weighted images were obtained based on a sagittal volumetric magnetization-prepared rapid gradient-echo (MPRAGE) sequence with the following representative imaging parameters: repetition time (TR) =2300 ms; echo time (TE) =3 ms; voxel size = 1.1×1.1×1.2 mm3; within plane FOV = 256 × 256 mm2; flip angle = 9° or 11°. DTI images were obtained with the following imaging parameters: TR=9000ms, slice thickness=2.7 mm, acquisition matrix 256 × 256. Fifty-nine axial slices were acquired without a gap, giving full brain coverage. For each slice, five image without diffusion weighting (b=0 s/mm2) and 41 images with diffusion gradients were acquired (b=1000 s/mm2). We defined the memory circuit as the hippocampus (HP), cingulum-angular bundles (CAB), and precuneus cortex, respectively representing the starting point, core connecting fibre and connected downstream cortex. We used FreeSurfer to segment HP into 24 subfields and calculate each subfield volume (Figure 1-A). TRACULA was used to reflect the white matter diffusion metric on whole CAB and multiple contiguous cross-sections along the CAB of each subject (Figure 1-B).11 Further, the corresponding cortical volume of the CAB connected regions was measured (Figure 1-C). To elaborate on the pathophysiological mechanism, we correlated neuroimaging measures with cognitive and neuropathological data.RESULTS
Along AD continuum, HP subfields volume initially increased and then decreased (Figure 2), starting from the early stage (CN with A+T-) (Figure 2). CAB integrity loss on both whole tract-level (Figure 3) and waypoint-wise (Figure 4) in MCI and AD with A+T+ and progressed along AD continuum. Regarding precuneus, we only found the decreased volume in MCI and AD with A+T+, with CN stage spared (Figure 5). Further, memory circuit structure impairment correlated with more AD neuropathology and worse memory profile (Figure 5).DISCUSSION & CONCLUSIONS
This study explored the progressive impairments of memory circuit structure as the AD neuropathological deposition increases: initially, atrophy appears in HP subfields, followed by the CAB impairments and the downstream brain cortex atrophy. Our study supported the AD neuropathology spread theory in the memory circuit in vivo, especially the tau propagation theory, and might conducive to the development of therapeutic methods.Summary of Main Findings
Along with Alzheimer’s disease (AD) continuum, AD neuropathologies propagate trans-neuronally, causing the memory circuit disorganization and memory deficit. We hypothesized that HP is the first to suffer from AD neuropathology, then followed by the connected tract and downstream cortex. We defined the memory circuit as the hippocampus (HP), cingulum-angular bundles (CAB), and precuneus cortex, respectively representing the starting point, core connecting fibre and connected downstream cortex. This study found that the progressive impairments of memory circuit structure as the AD neuropathological deposition increases: initially, atrophy appears in HP subfields, followed by the CAB impairments and the downstream brain cortex atrophy. Our study supported the AD neuropathology spread theory in the memory circuit in vivo, especially the tau propagation theory, and might conducive to the development of therapeutic methods.Acknowledgements
No acknowledgement found.References
1. Ahmed Z Cooper J, et al. A novel in vivo model of tau propagation with rapid and progressive neurofibrillary tangle pathology: the pattern of spread is determined by connectivity, not proximity. Acta Neuropathologica. 2014; 127, 667-683.
2. Braak H Braak E Neuropathological staging of Alzheimer-related changes. Acta Neuropathologica. 1991; 82, 239–259.
3. Braak H Braak E Staging of Alzheimer’s disease-related neurofibrillary changes. Neurobiol Aging. 1995; 16, 271–278.
4. Jacobs HIL Hedden T, et al. Structural tract alterations predict downstream tau accumulation in amyloid-positive older individuals. Nat Neurosci . 2018; 21, 424-431.
5. Catani M., & De Schotten, M. T. A diffusion tensor imaging tractography atlas for virtual in vivo dissections. Cortex. 2008; 44, 1105–1132.
6. Hua K., et al. Tract probability maps in stereotaxic spaces: analyses of white matter anatomy and tract-specific quantification. NeuroImage. 2008; 39, 336–347.
7. Lin Y. C., et al. Cingulum correlates of cognitive functions in patients with mild cognitive impairment and early Alzheimer’s disease: a diffusion spectrum imaging study. Brain Topography. 2004; 27, 393–402.
8. Yendiki A Panneck P, et al. Automated probabilistic reconstruction of white-matter pathways in health and disease using an atlas of the underlying anatomy. Front Neuroinform. 2011; 5, 23.
9. Watanabe A Nakamae T, et al. The detection of white matter alterations in obsessive-compulsive disorder revealed by TRActs Constrained by UnderLying Anatomy (TRACULA). Neuropsychiatr Dis Treat. 2008; 14, 1635-1643.
10. Pietracupa S Suppa A, et al. Freezing of gait in Parkinson's disease: gray and white matter abnormalities. J Neurol. 2008; 265, 52-62.
11. Rimol LM Botellero VL, et al. Reduced white matter fractional anisotropy mediates cortical thickening in adults born preterm with very low birthweight. Neuroimage. 2019; 188, 217-227.
Figures
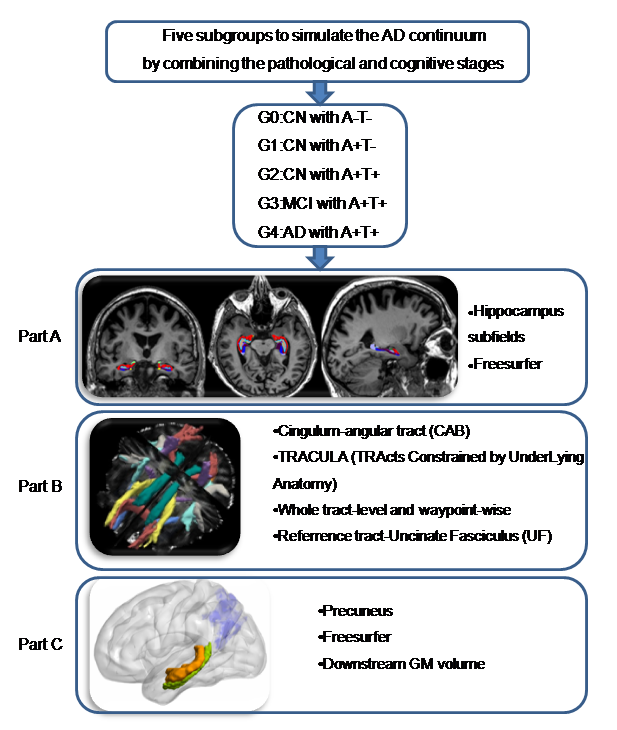
Image analysis path.
Based on the biological diagnosis criteria, we divided subjects into 5 groups. We used FreeSurfer to segment HP into 24 subfields and calculate each subfield volume (A). TRACULA was used to reflect the white matter diffusion metric on whole CAB and multiple contiguous cross-sections along the CAB of each subject (B). Further, the corresponding cortical volume of the CAB connected regions was measured (C).
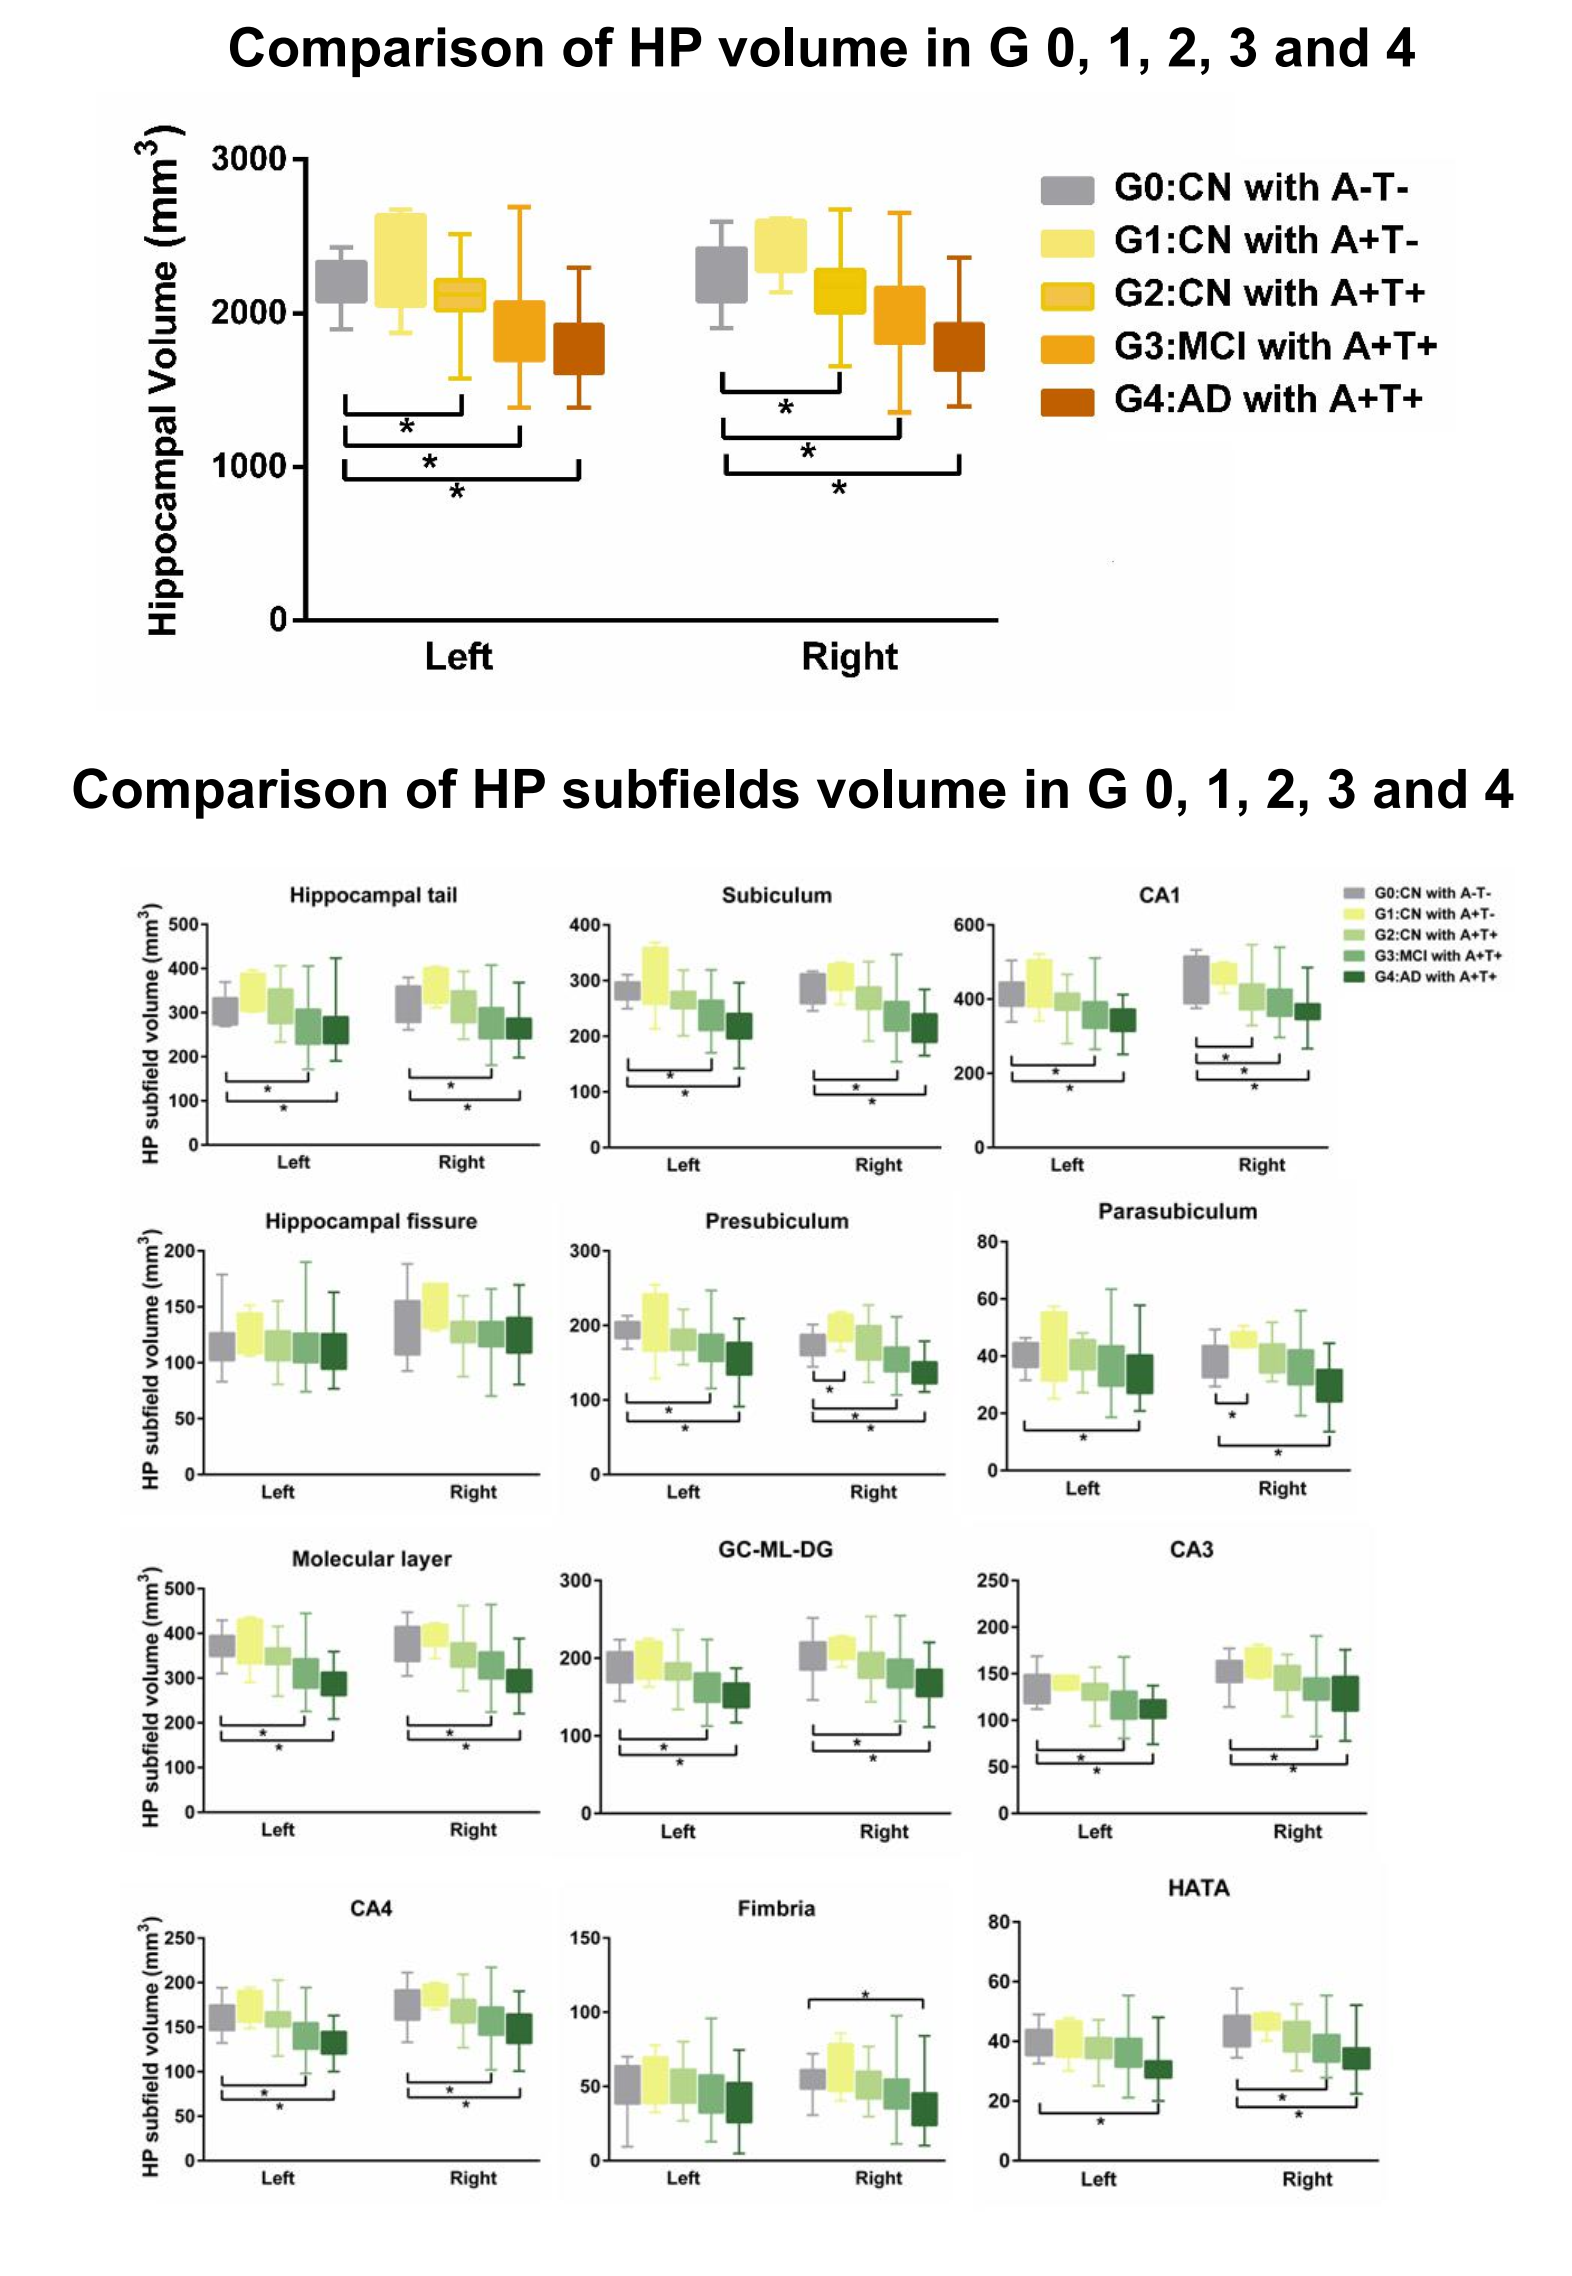
Comparison of HP volume and HP subfields volume in G 0, 1, 2, 3 and 4.
∗P< 0.05.
Abbreviation: A: Aβ1-42; T: P-tau181; Group 0 (G0): cognitively normal subjects with A−T−; Group 1 (G1): cognitively normal subjects with A+T−; Group 2 (G2): cognitively normal subjects with A+T+; Group 3 (G3): mild cognitive impairment subjects with A+T+; Group 4 (G4): demented subjects with A+T+; CN: cognitively normal; MCI: mild cognitive impairment; AD: Alzheimer’s disease.
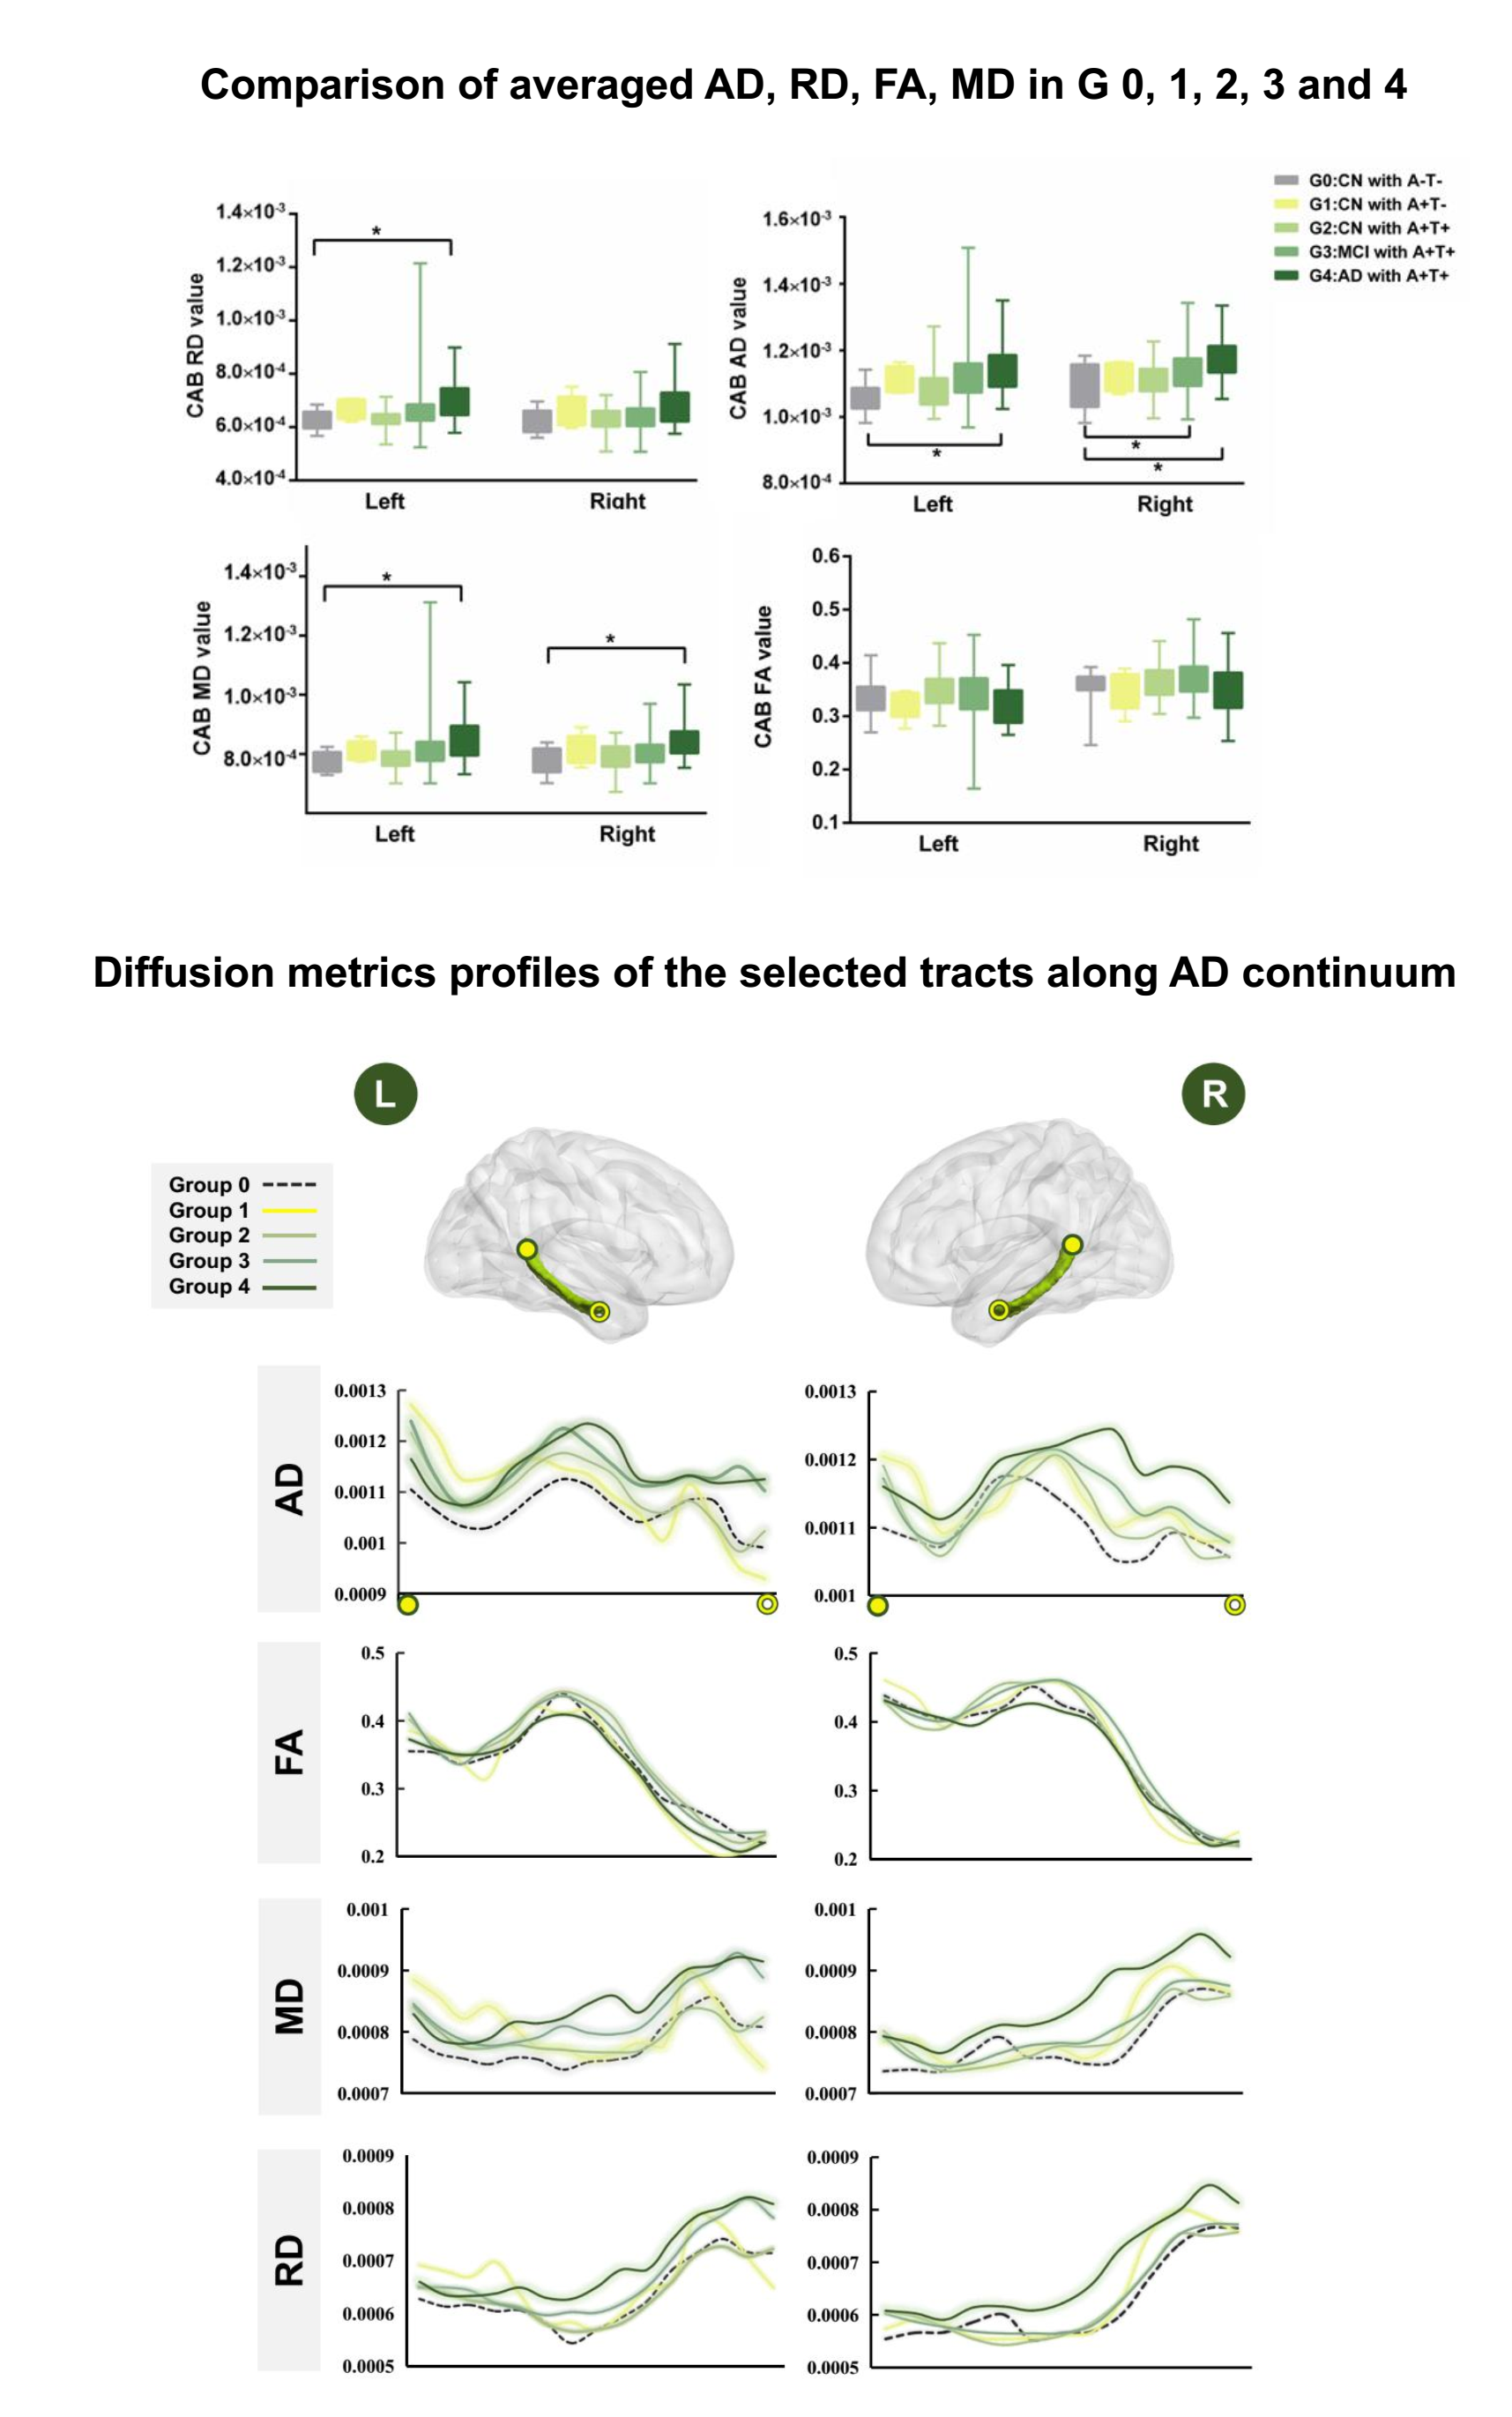
Comparison of averaged AD, RD, FA, MD and the diffusion metrics profiles of the selected tracts along AD continuum.
The bilateral CAB were divided into 2.7 mm long segments in each subject’s native space, and the average AD, FA, MD and RD value of each segment was obtained and mapped on each side. The x axis shows the location of the constructed tract from backward to forward (corresponding to yellow solid point and hollow point). Each line represents the group average diffusion metrics across subjects.
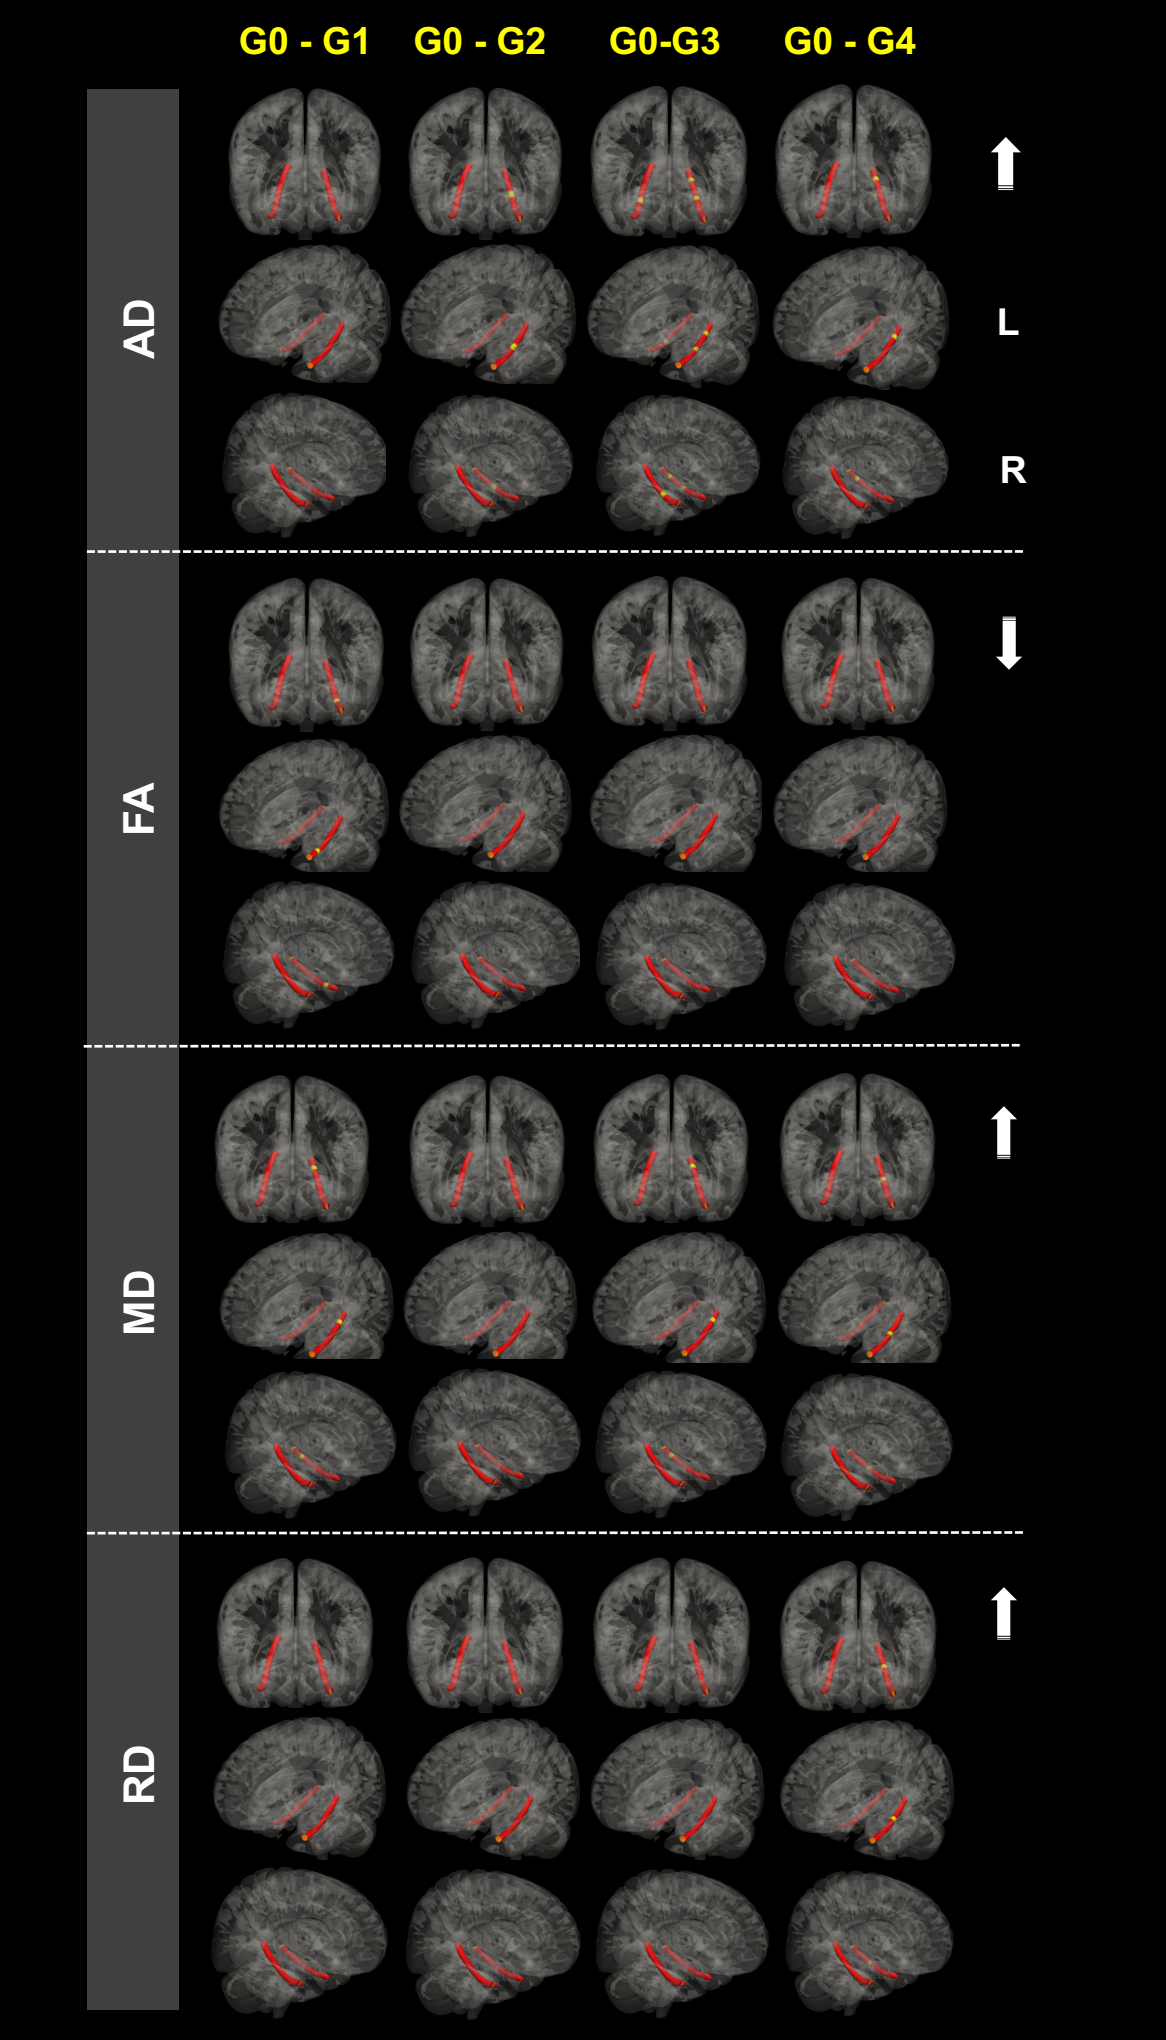
Waypoint-wise diffusion metrics analysis.
The figure shows significance tests of group differences in AD, FA, MD and RD along left and right CAB in radiological view. Red represents the selected tracts. Yellow segments show significant group difference (P < 0.05) over a contiguous segment greater than 0.81 cm along a given pathway. The arrows represent the increase or decrease of the diffusion metrics. The P-values are obtained from general linear models fitted for each segment along the tract.
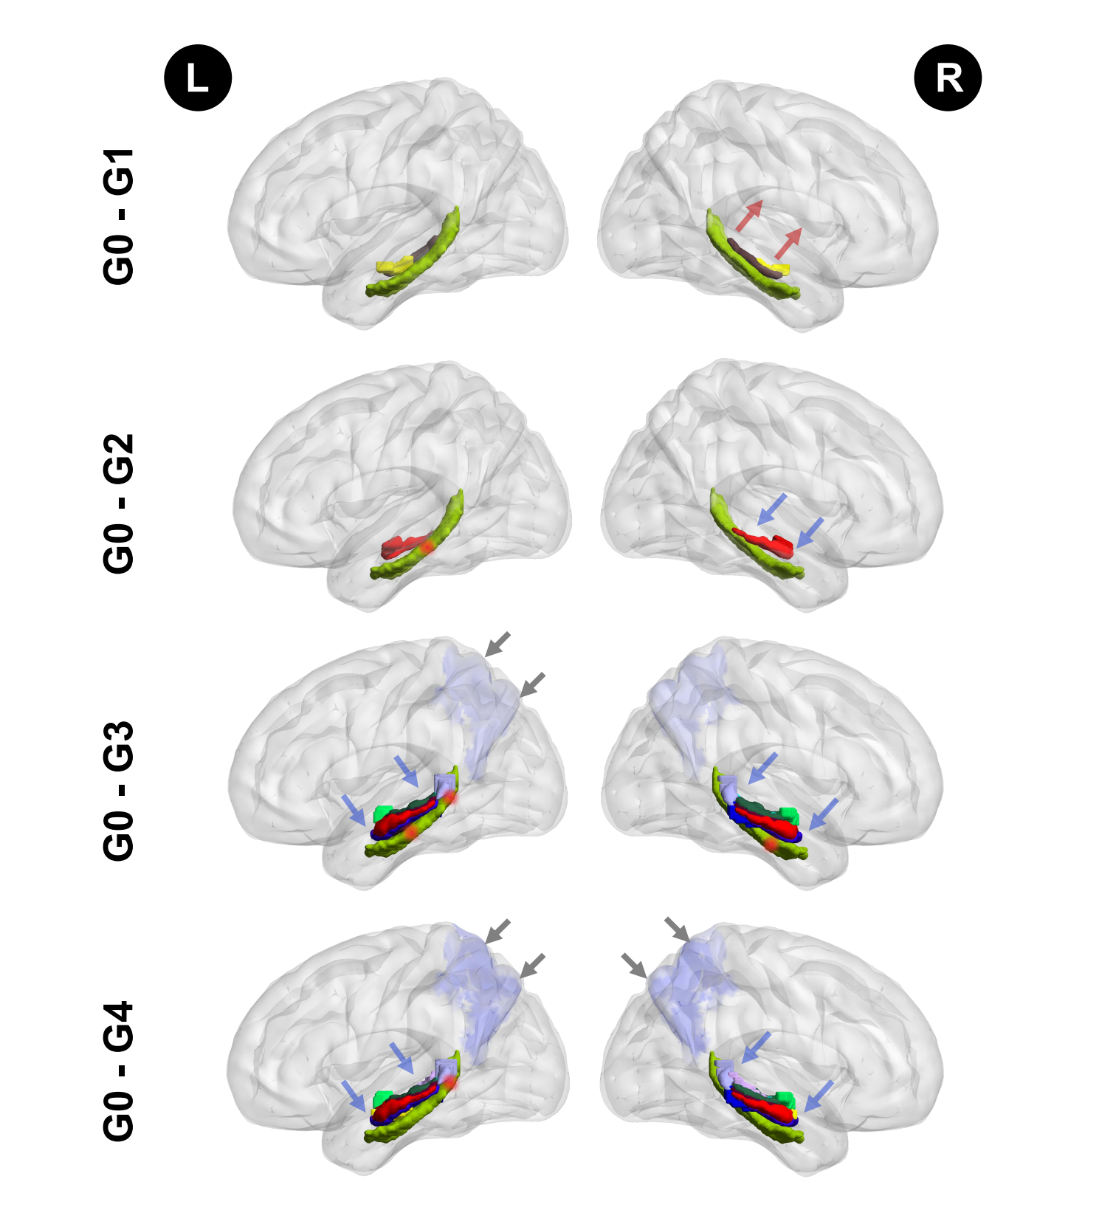
The impairments pattern of memory circuit structure along with Alzheimer’s disease neuropathology spread.
The green structure at the bottom represents the CAB tracts. Red segments of the CAB show significant group difference (P < 0.05) over a contiguous segment greater than 0.81 cm along a given pathway. The colourful structures above the green structure represent the HP subfields. The lavender at the posterior brain region represents the precuneus volume. The arrows represent the decrease (blue) or increase (red) of the imaging metrics.