0215
Fast 3D High-Resolution Metabolic Imaging in Alzheimer's Disease using SPICE
Jialin Hu1, Miao Zhang2, Rong Guo3,4, Yudu Li3,4, Wanqing Sun1, Danni Wang1, Hui Huang1, Yibo Zhao3,4, Ziyu Meng1,3, Biao Li2, Jun Liu5, Binyin Li5, Jie Luo1, Zhi-Pei Liang3,4, and Yao Li1
1Institute for Medical Imaging Technology, School of Biomedical Engineering, Shanghai Jiao Tong University, Shanghai, China, 2Department of Nuclear Medicine, Ruijin Hospital, Shanghai Jiao Tong University School of Medicine, Shanghai, China, 3Beckman Institute for Advanced Science and Technology, University of Illinois at Urbana-Champaign, Urbana, IL, United States, 4Department of Electrical and Computer Engineering, University of Illinois at Urbana-Champaign, Urbana, IL, United States, 5Department of Neurology and Institute of Neurology, Ruijin Hospital, Shanghai Jiao Tong University School of Medicine, Shanghai, China
1Institute for Medical Imaging Technology, School of Biomedical Engineering, Shanghai Jiao Tong University, Shanghai, China, 2Department of Nuclear Medicine, Ruijin Hospital, Shanghai Jiao Tong University School of Medicine, Shanghai, China, 3Beckman Institute for Advanced Science and Technology, University of Illinois at Urbana-Champaign, Urbana, IL, United States, 4Department of Electrical and Computer Engineering, University of Illinois at Urbana-Champaign, Urbana, IL, United States, 5Department of Neurology and Institute of Neurology, Ruijin Hospital, Shanghai Jiao Tong University School of Medicine, Shanghai, China
Synopsis
As a progressive neurodegenerative disease, early diagnosis of Alzheimer’s disease (AD) is important but remains difficult. MRSI is a useful tool for detecting neurometabolic alterations in AD, but most studies were limited by using single-slice or single-voxel techniques with low spatial resolution and long data acquisition time. In this study, we performed 3D MRSI of AD patients at a nominal spatial resolution of 2.0 × 3.0 × 3.0 mm3 in a 7-min scan using a new technique called SPICE (SPectroscopic Imaging by exploiting spatiospectral CorrElation). Our experimental results showed noticeable neurometabolic changes in AD patients.
Introduction
Alzheimer’s disease (AD) is one of the most common forms of dementias and has caused increasing societal and economic burden. As a progressive neurodegenerative disease, early diagnosis of AD is critical but remains challenging. Increasing evidence has shown that brain functional and metabolic changes could be detected early before structural atrophy and the clinical symptom onset 1,2. PET scans such as amyloid-beta (Aβ) or Tau deposition imaging show great promise in AD diagnosis for its high sensitivity and specificity, but with limited clinical access. There remains a thirst to develop noninvasive and cost-effective imaging techniques to provide early diagnostic markers and track the progression of the disease. MRSI has long been recognized as a potentially powerful tool for noninvasive metabolic imaging in AD. For example, N-acetylaspartate (NAA) reduction serves as a marker of neuronal degradation and myoinositol (mI) increase is usually associated with microglia activation in neuroinflammation, which has been considered as an important pathological alteration in AD 3,4. However, most existing MRSI studies in AD were performed using single-slice MRSI or single-voxel MRS techniques at low resolution and require a long data acquisition time with low detection sensitivity. In this study, we investigate the feasibility of 3D high-resolution metabolic imaging of AD using a newly developed MRSI technique called SPICE (SPectroscopic Imaging by exploiting spatiospectral CorrElation). The experimental results showed noticeable neurometabolic alterations in AD patients including the NAA reduction and mI elevation in the posterior cingulate cortex (PCC) and Aβ accumulation area, which was consistent with our PET results and previous findings 5,6.Method
All the images were acquired on a PET/MR scanner (Biograph mMR; Siemens, Germany) with IRB approved by the Ruijin Hospital, Shanghai, China. Seven AD patients and four age matched healthy controls were enrolled in the study. The experimental protocols for MR scans included high-resolution MRSI scans using SPICE7,8 (2.0 × 3.0 × 3.0 mm3, FOV = 240 × 240 × 72 mm3, TE = 1.6 ms, TR = 160 ms, 7 minutes) and structural imaging scans using MPRAGE imaging (TR/TE = 1900/2.44ms, matrix size = 256 × 256, slice thickness = 1.0 mm). The reconstruction of the spatiospectral functions of metabolites was performed using a union-of-subspaces model, incorporating pre-learned spectral basis functions7-9. The spectral quantification was done using an improved LCmodel-based algorithm that incorporated both spatial and spectral priors 8,10.The PET data were acquired at 45~60 mins post a bolus injection of 18F-AV-45 at 3.7 MBq/kg (matrix size = 344 × 344, voxel size = 2.1 × 2.1 × 2.0 mm3, 127 slices, 15 minutes). Corrections of random events, dead time, 3D scatter and attenuation were applied. Attenuation correction was performed using MR-based attenuation maps derived from a dual echo Dixon-based sequence. After these corrections, the PET images were reconstructed using the Siemens HD reconstruction algorithm (4 iterations, 21 subsets). Post-filtering was performed using an isotropic 2mm full-width half-maximum (FWHM) Gaussian filter.
In the data analysis, the T1-weighted images were segmented using FreeSurfer v6.0 to create subject-specific cerebellum mask. The 18F-AV-45 values were quantified by standard uptake value ratio (SUVR) as a ratio to whole cerebellum mean uptake. The MRSI and processed PET images of each subject were first coregistered to the T1-weighted image using affine linear transformation and then nonlinearly registered to MNI152 space. The PCC region has been well recognized as the one of the affected regions early in the onset of AD. Therefore, we performed region of interest (ROI) analysis in PCC, which was extracted using the Harvard-Oxford cortical Atlas (part of FSL). We performed voxel-wise analysis to compare the metabolite ratios over Cr between healthy controls and AD patients using Mann-Whitney U test.
Results and Discussion
Figure 1 shows the high-resolution metabolite maps of NAA, mI, Cho and Cr obtained from an AD patient (MMSE=10) and a healthy subject. We could see a global reduction of NAA and increase of mI in the AD patient. Figure 2 shows the AV45-PET image and the corresponding reconstructed high-resolution metabolite maps of this AD patient, we can see the reduction of NAA and increase of mI were lateralized to the patient high Aβ deposition hemisphere. Figure 3 compares the localized spectra selected from the high Aβ deposition area and its contralateral region of an AD patient, as well as a representative region from a healthy subject. The spectra show reduced NAA and elevated mI in the high Aβ deposition area compared to the contralateral region in the AD patient, which were both lower in NAA and higher in mI than that of the healthy subject. Figure 4 shows a significant reduction of NAA and elevation of mI in the PCC of AD patients compared to the healthy group. These findings are consistent with previous studies 6,11.Conclusion
We successfully performed fast 3D high-resolution metabolic imaging in AD using SPICE. Our experimental results showed clear neurometabolic alterations in the AD patients. Our study may lay a foundation for further research and clinical applications of noninvasive high-resolution whole brain metabolic imaging in AD.Acknowledgements
This work is supported by National Science Foundation of China (No.61671292 and 81871083).References
- Murray ME, Przybelski SA, Lesnick TG, et al. Early Alzheimer's disease neuropathology detected by proton MR spectroscopy. J Neurosci. 2014;34(49):16247-16255.
- Nakamura A, Cuesta P, Kato T, et al. Early functional network alterations in asymptomatic elders at risk for Alzheimer's disease. Sci Rep. 2017;7(1):6517.
- Zhang F, Jiang L. Neuroinflammation in Alzheimer's disease. Neuropsychiatr Dis Treat. 2015;11:243-256.
- Chang L, Munsaka SM, Kraft-Terry S, Ernst T. Magnetic resonance spectroscopy to assess neuroinflammation and neuropathic pain. J Neuroimmune Pharmacol. 2013;8(3):576-593.
- Wang H, Tan L, Wang HF, et al. Magnetic Resonance Spectroscopy in Alzheimer’s Disease: Systematic Review and Meta-Analysis. J Alzheimers Dis. 2015;46(4):1049-1070.
- Sheikhbahaei N, Sajjadi SA, Manavaki R, et al. Positron emission tomography-guided magnetic resonance spectroscopy in Alzheimer disease. Ann Neurol. 2018;83(4):771-778.
- Lam F and Liang ZP. A subspace approach to high‐resolution spectroscopic imaging. Magn Reson Med. 2014;71(4):1349-1357.
- Ma C, Lam F, Johnson CL, et al. Removal of nuisance signals from limited and sparse 1H MRSI data using a union‐of‐subspaces model. Magn Reson Med. 2016;75(2):488-497.
- Lam F, Ma C, Clifford B, et al. High‐resolution 1H‐MRSI of the brain using SPICE: data acquisition and image reconstruction. Magn Reson Med. 2016;76(4):1059-1070.
- Li Y, Lam F, Clifford B, et al. A subspace approach to spectral quantification for MR spectroscopic imaging. IEEE Trans Biomed Eng. 2017;64(10):2486-2489.
- Kantarci K, Lowe V, Przybelski SA, et al. Magnetic resonance spectroscopy, β-amyloid load, and cognition in a population-based sample of cognitively normal older adults. Neurology. 2011;77(10):951-958.
Figures
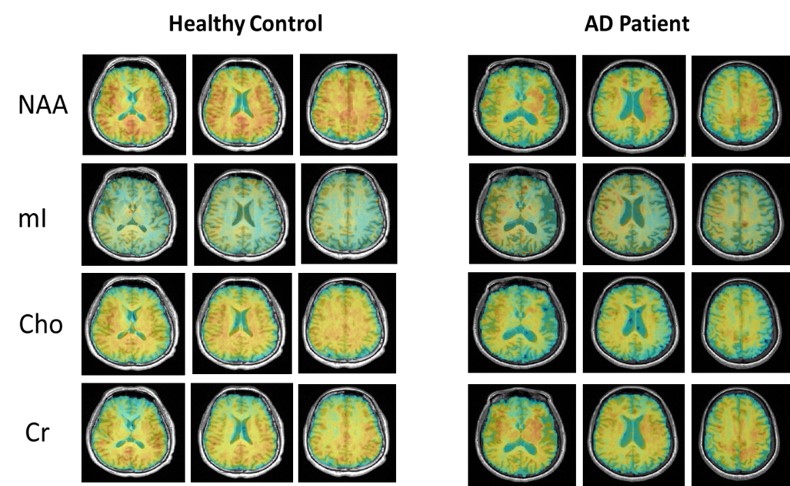
Figure 1. High-resolution metabolite
maps reconstructed from an AD patient and a healthy control.
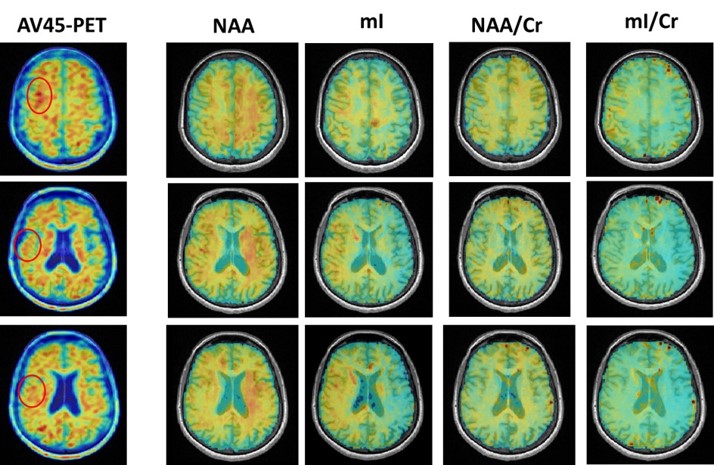
Figure 2. The AV45-PET images and the corresponding
reconstructed high-resolution metabolite maps of a severe AD patient (MMSE =
10). The high Aβ deposition area were
marked in circle. We could see the reduction of NAA and increase of mI were lateralized
to the high Aβ deposition
hemisphere.
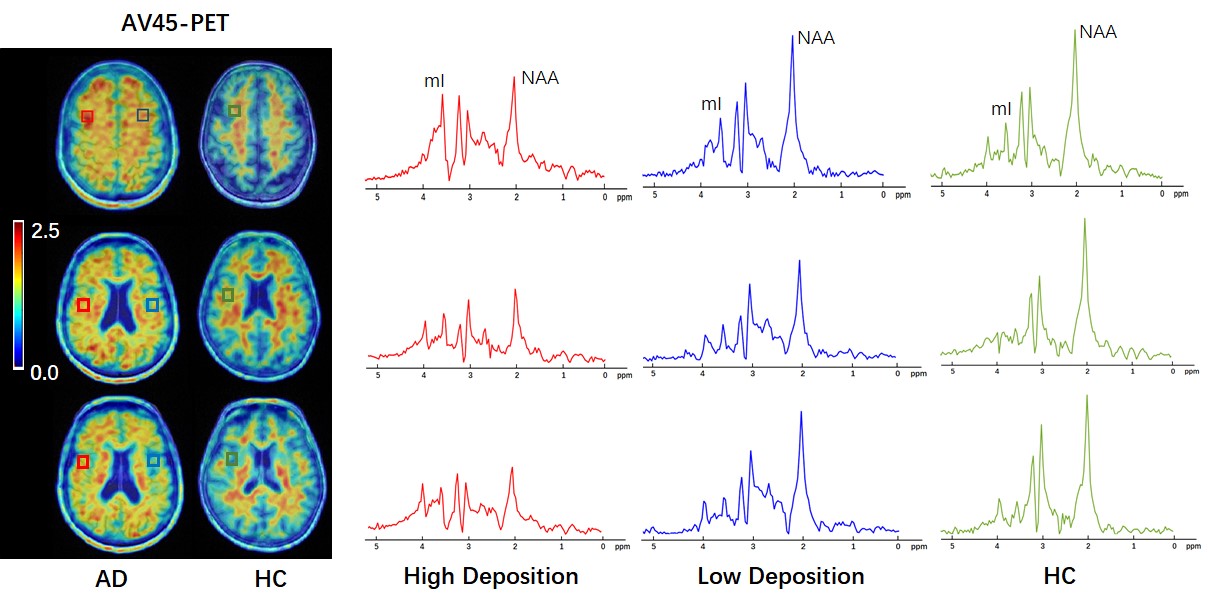
Figure 3. Localized spectra selected
from the high Aβ deposition area and its contralateral
region of an AD patient, as well as a representative region from a healthy
subject. The spectra show reduced NAA and elevated mI in the high Aβ
deposition area compared to the low Aβ
deposition area in the AD patient, which were both lower in
NAA and higher in mI than that of the healthy subject.
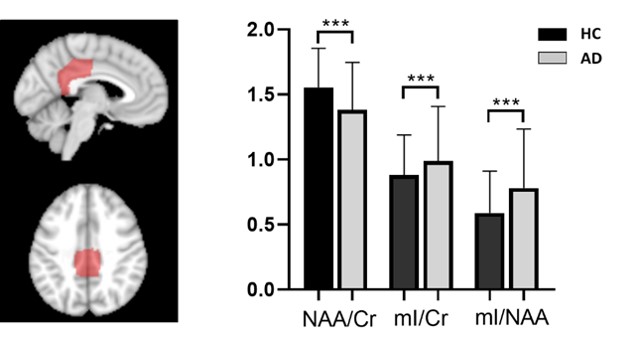
Figure 4. Comparison of relative
concentrations of metabolites in posterior cingulate cortex (PCC) between AD
group and healthy group using voxel-wise analysis. A significant reduction of
NAA and increase of mI are shown in the AD group. ***p < 0.001.