0214
Assessment of Intracranial Vascular Flow Oscillations in Alzheimer’s Disease using Real Time 4D Flow MRI1Department of Medical Physics, University of Wisconsin - Madison, Madison, WI, United States, 2Department of Radiology, University of Wisconsin - Madison, Madison, WI, United States, 3Department of Medicine, University of Wisconsin - Madison, Madison, WI, United States
Synopsis
Microvascular oscillations have been speculated to be markers of autoregulation and to be driving forces of glymphatic clearance of interstitial fluid, Aβ, and other soluble metabolites of the brain. To probe spontaneous low frequency oscillations (LFO) in the brain vasculature, measures of blood flow variance during several minutes might hold potential. In this study, we investigated induced LFOs in blood flow with 4D flow using 3D radial sampling and low-rank regularization for real time blood flow variance estimates. Preliminary results showed significant increased blood flow fluctuations in age-matched controls compared to AD subjects.
Introduction:
Cardiovascular disease and Alzheimer’s disease (AD) pathology co-occur although it remains unclear whether cardiovascular disease precedes or follows AD and whether effects are additive or synergistic in driving cognitive decline. For example, vascular dysfunction may result in weakened autoregulation, hypoperfusion, and reduced glymphatic clearance. These effects are hypothesized to facilitate a cycle of beta-amyloid accumulation, a biomarker for AD. 4D flow MRI has been used to characterize intracranial hemodynamics in AD finding associations with reduced overall flow, increased blood flow pulsatility, and increased vessel stiffness.1-3 While 4D flow provides a depiction of cardiac induced pulsations, there are low frequency flow oscillations (LFO) due to respiration and neurovascular autoregulation which using near-infrared spectroscopy (NIRS) have shown potential as a marker of cognitive decline and cerebrovascular disease.4,5 Recent models suggest clearance of soluble metabolites from the brain can be driven by LFO of vascular smooth muscle cells through the intramural pariarterial drainage (IPAD) pathway.6 This work investigates the feasibility of deriving measures of LFO from intracranial arteries using 4D flow which is not gated to the cardiac cycle but rather reconstructed over absolute time. Specifically, we combine 3D radial sampling and a local low-rank reconstruction approach to achieve real time temporal resolution.7 Preliminary results are shown for LFO in blood flow in AD subjects.Methods:
Subjects: A total of 36 subjects participated in this study. These subjects formed three groups: 6 young healthy volunteers (mean age = 29±4yrs, range = [24,36]yrs, 1 female), 15 cognitively healthy age-matched older adults (mean age = 70±6yrs, range = [66,85]yrs, 10 females), and 15 clinical AD subjects (mean age = 73±11yrs, range = [49,88]yrs, 9 females). MRI: Volumetric, time-resolved phase contrast (PC) MRI data were acquired on a 3.0T system (Signa Premier, GE Healthcare) using a 48-channel head coil (GE Healthcare) and a 3D radially undersampled sequence 8 with the following imaging parameters Venc =80cm/s, imaging volume=22x22x10cm3, TR/TE=7.7/2.5ms. Scan time=5.6min for young volunteers (4-point reference encoding) and 7.1min for age-matched controls and AD subjects (5-point balanced encoding). Five-point balanced velocity encoding was used for age-matched controls and AD subjects for larger dynamic range.9 To evaluate the ability of 4D flow to distinguish physiologic flow changes from noise, healthy volunteers were scanned during free breathing and during a scan with breath-holds (BH). Age-matched controls and AD subjects were scanned during free breathing only. Flow encoded images were reconstructed to 100 frames using GPU accelerated (SigPy) iterative SENSE with a local low-rank constraint.7,10,11 Reconstructions were performed with 8x8x8 blocks and a manually tuned regularization parameter. The spatial resolution was 1.38mm isotropic and the temporal resolutions were: 3.4sec for young volunteers and 4.3sec for age-matched controls and AD subjects. LFO analysis: Flow measurements were performed in MATLAB (Mathworks, Natick, MA) on the dynamic data.12 The vascular tree was extracted using a centerline process with local cut-planes automatically placed in every centerline point perpendicular to the axial direction of the vessel. Flow waveforms in the internal carotid artery (ICA) and the superior sagittal sinus (SSS) were recorded. The average flow along the vessel segment was estimated from all the centerline points between the cervical and petrous ICA (e.g. before the carotid siphon) and along posterior/inferior portion of the SSS segment. The time series of the magnitude data were inspected for motion artifacts and subjects with evidence of moderate motion were excluded from the analysis. To quantify LFO demeaned flow changes and standard deviations were calculated. Group differences were assessed using Student’s t-test (P<0.05).Results:
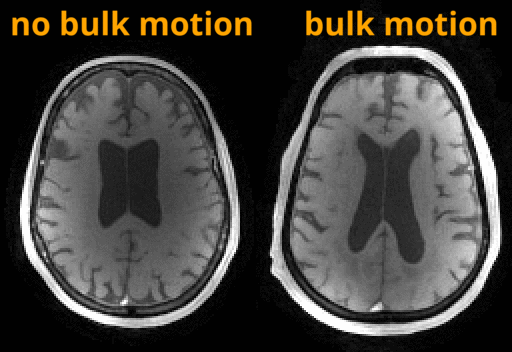
Figure 1 shows an example of flow curves from a young volunteer during free breathing and a scan with BHs. Flow variance increases during the BH scan, with maximum variance reached during the BH in arteries and a delayed response in veins. Flow range was significantly larger during the BH scan compared to free breathing in the ICA (P=0.016) and SSS (P=0.040) (Figure 2). LFO from demeaned flow profiles are shown in Figure 3 for all subjects. The LFO in age-matched controls were noticeable larger than in AD subjects in both vessel segments. Furthermore, flow profiles standard deviations in age-matched controls were significantly larger than in AD subjects in the ICA (P=0.002) and SSS (P=0.034) (Figure 4). Finally, one AD subject was excluded from the analysis because of motion artifacts detected in the time series of the magnitude data (Figure 5 (Animated GIF)).Discussion and Conclusions:
Blood flow variations were detectable using a real time local low-rank reconstruction approach in 4D flow MRI in the context of AD. First, respiratory challenges such as BHs can induce significant flow variations as observed in young volunteers. Second, significantly higher LFO, as measured by standard deviations, are measurable in age-matched controls when compared to AD subjects suggesting decreased vascular compliance and vasomotion in AD. These results agree well with another study that reports a decreased in LFO in the brain cortex in MCI compared to age-matched controls using NIRS.5 However, LFO are likely influenced by noise and physiologic state meaning validation of the real time reconstruction method in phantoms models with controllable flow profiles are warranted. Finally, 4D flow based spontaneous LFO measures might hold potential for longitudinal studies aiming at predicting cognitive trajectories.Acknowledgements
We gratefully acknowledge research support from GE Healthcare, and funding support from NIH grants R01NS066982, R01HL136965, P50-AG033514, and R01AG021155.References
1. Rivera-Rivera LA, Turski P, Johnson KM, et al. 4D flow MRI for intracranial hemodynamics assessment in Alzheimer's disease. J Cereb Blood Flow Metab. 2016 Oct;36(10):1718-1730.
2. Rivera-Rivera LA, Schubert T, Turski P, et al. Changes in intracranial venous blood flow and pulsatility in Alzheimer's disease: A 4D flow MRI study. J Cereb Blood Flow Metab. 2017 Jun;37(6):2149-2158.
3. Rivera-Rivera LA, Johnson SC, Illingworth C, et al. Intracranial Pulse Wave Velocity in Alzheimer’s Disease using Flow Encode Split and Low Rank Reconstructed 4D Flow MRI. 27th Annual ISMRM Meeting, Montreal, Canada, p. 622.
4. Andersen AV, Simonsen SA, Schytz HW, et al. Assessing low-frequency oscillations in cerebrovascular diseases and related conditions with near-infrared spectroscopy: a plausible method for evaluating cerebral autoregulation? Neurophotonics. 2018 Jul; 5(3): 030901.
5. Zeller JBM, Katzorke A, Müller LD, et al. Reduced spontaneous low frequency oscillations as measured with functional near-infrared spectroscopy in mild cognitive impairment. Brain Imaging Behav. 2019 Feb;13(1):283-292.
6. Diem AK, Sharp MM, Gatherer M, et al. Arterial Pulsations cannot Drive Intramural Periarterial Drainage: Significance for Aβ Drainage. Frontiers in Neuroscience 2017; 11: 475. doi: 10.3389/fnins.2017.00475
7.Jimenez JE, Strigel RM, Johnson KM, et al. Feasibility of high spatiotemporal resolution for an abbreviated 3D radial breast MRI protocol. Magn Reson Med. 2018 Oct;80(4):1452-1466.
8. Johnson KM, Lum DP, Turski PA, et al. Improved 3D Phase Contrast MRI with Off-resonance Corrected Dual Echo VIPR. Magn Reson Med. 2008 Dec; 60(6): 1329–1336.
9. Johnson KM, and Markl M. Improved SNR in phase contrast velocimetry with five-point balanced flow encoding. Magn Reson Med. 2010 Feb;63(2):349-55
10. Ying L1, Sheng J. Joint image reconstruction and sensitivity estimation in SENSE (JSENSE). Magn Reson Med. 2007 Jun;57(6):1196-202.
11. Ong F, Lustig M. SigPy: A Python Package for High Performance Iterative Reconstruction. 27th Annual ISMRM Meeting, Montreal, Canada, p. 4819.
12. Schrauben E, Wåhlin A, Ambarki K, et al. Fast 4D flow MRI intracranial segmentation and quantification in tortuous arteries. J Magn Reson Imaging. 2015 Nov;42(5):1458-64.
Figures