0213
Assessing White Matter Microstructural Changes Associated with Mild Cognitive Impairment using Laplacian-Regularized MAP MRI1Department of Medical Physics, University of Wisconsin-Madison, Madison, WI, United States, 2Department of Pediatrics, University of Wisconsin-Madison, Madison, WI, United States, 3Waisman Center, University of Wisconsin-Madison, Madison, WI, United States, 4Wisconsin Alzheimer’s Disease Research Center, University of Wisconsin-Madison, Madison, WI, United States, 5Geriatric Research Education and Clinical Center, Middleton Memorial VA Hospital, University of Wisconsin-Madison, Madison, WI, United States, 6Department of Psychiatry, University of Wisconsin-Madison, Madison, WI, United States
Synopsis
We implement Laplacian-regularized MAP MRI to investigate distinct white matter (WM) microstructural changes associated with mild cognitive impairment (MCI).
Comparisons of diffusion parameters (via TBSS) between healthy controls and MCI patients revealed significant group differences in a wide variety of WM pathways previously shown to be altered in MCI and Alzheimer’s Dementia (AD). In particular, the MCI group exhibited WM clusters with lower return to origin probability (RTOP) and return to plane probability (RTPP) magnitudes, suggesting structurally affected axons in those tracts.
Our findings provide an early quantitative framework for identifying specific WM microstructural deficiencies characteristic of MCI and AD.
Purpose
Mild cognitive impairment (MCI) is an intermediate stage between normal cognitive decline due to aging and Alzheimer’s disease (AD) dementia, characterized by deficiencies in one or more of the domains of memory, executive function, language, and judgement.1 While MRI investigations have consistently documented gray matter (GM) atrophy in AD patients, white matter (WM) deterioration associated with AD is less extensively characterized.2,3 However, several recent studies suggest that WM degeneration occurs early in the course of the development of AD,4-7 with some studies suggesting axonal and dendritic degeneration preceding gray matter atrophy.8-11Individuals with MCI incur a significantly increased risk of developing dementia,1 and prior diffusion tensor imaging (DTI) studies have shown WM changes in both MCI and AD.12 However, the diffusion tensor model is fundamentally limited in WM regions populated by crossing fibers and fails to account for more restricted diffusion. Furthermore, while conventional DTI metrics are extremely sensitive to minute disparities in WM microstructure (including deviations in myelination, axonal density, and axonal coherence), they are inherently non-specific to such changes.13,14
In order to delineate distinct WM microstructural alterations in MCI, we implemented the Laplacian-regularized mean apparent propagator (MAPL) MRI model to generate and compare an assortment of diffusion parameter maps between healthy and MCI brains, imaged with a hybrid diffusion imaging protocol.
Methods
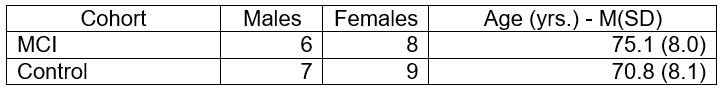
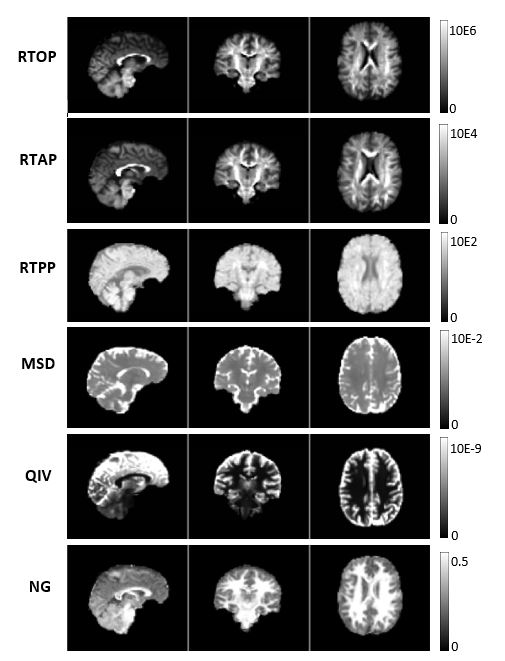
14 MCI patients and 16 healthy controls (Table 1) were imaged with a 5 shell (b=300, 1200, 2700, 4800, and 7600 s/mm2) hybrid diffusion imaging (HYDI)15 protocol in a 3T scanner, using two (opposing) phase encoding directions. After correcting for noise, Gibbs ringing, susceptibility-induced distortions (via FSL’s TOPUP)16 and eddy currents,17,18 diffusion tensors were estimated with weighted least squares regression using the three lowest b values (up to 2700 s/mm2) and standard DTI parameter maps (FA, MD, RD, AD) were computed.Next, the MAPL MRI model19 was applied to the diffusion data with Diffusion Imaging in Python (DIPY) software.20 This entailed fitting the q-space (diffusion) signal to a collection of 6 basis functions (Hermite polynomials) and regularizing corresponding weighting coefficients by minimizing the Laplacian of the reconstructed signal. Using the fact that the q-space signal is the Fourier Transform of the diffusion propagator (i.e. the mean apparent propagator - MAP), the estimated coefficients were manipulated to calculate various MAP-based parameters (Figure 1) that convey specific information about the underlying tissue microstructure. Namely: the return to origin probability (RTOP), the return to axis probability (RTAP), the return to plane probability (RTPP), the mean squared displacement (MSD), the Non-Gaussianity (NG), and the q-space inverse variance (QIV).
Tract-based spatial statistics (TBSS)21 was used to evaluate disparities in DTI and MAPL parameters between the MCI and control groups. Specifically, nonparametric permutation t-tests22 were conducted, accounting for sex and age. Threshold free cluster enhancement23 was used to identify clusters of WM voxels that exhibited significant group differences, correcting for multiple comparisons.
Results
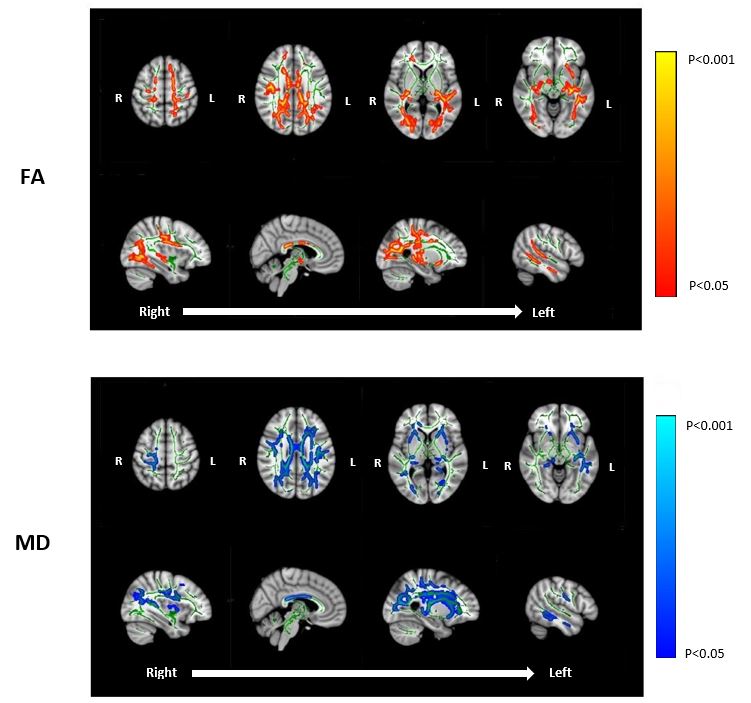
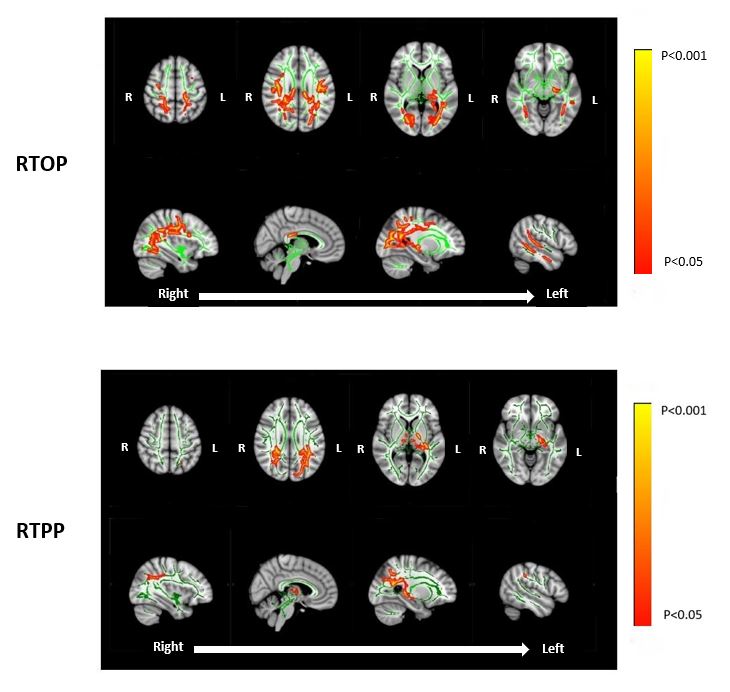
Several WM regions in the MCI group demonstrated significantly lower FA, RTOP, and RTPP (P<0.05) and significantly higher MD (P<0.05) compared to healthy controls (Figures 2 & 3). Pathways exhibiting significant differences included the corpus callosum, fornix, internal capsules, corona radiata, superior longitudinal fasciculi, cerebral peduncles, posterior thalamic radiations, and precuneus fibers. No significant differences in any of the remaining MAPL or DTI parameters survived correction for multiple comparisons.Discussion
A comparison of select diffusion parameters between groups revealed WM microstructural deficiencies in the MCI cohort within several tracts previously identified as exhibiting deterioration in DTI-based studies of white matter degeneration in MCI and AD.12,24The MAPL metrics examined appear to be more specific than those derived from DTI modeling. For example, RTOP quantifies the probability that a proton will remain in the same relative position between two consecutive diffusion gradient pulses and is inversely proportional to the volume of a pore.19 A higher RTOP indicates that the volume a spin occupies is smaller, implying greater restriction, and therefore, potentially more intact axons. RTOP reductions were particularly widespread in the MCI group, suggesting that axons in those tracts are structurally affected. This is consistent with the observed decreases in FA and increases in MD.
Meanwhile, the DTI measures appear to be sensitive to more spatially diffuse microstructural changes between groups. However, it should be noted that initial DTI comparisons using only the inner two shells (i.e. b= 300 and 1200 s/mm2) did not reveal significant group differences. Additionally, the third shell (b=2700 s/mm2) is very likely to include contributions from more restricted diffusion.
One limitation of our analysis is that, on average, a significant percentage of controls will have underlying AD pathology,25-27 and in this study, we have no way of identifying these subjects.
Our findings serve as a preliminary statistical analysis of white matter alterations among individuals with MCI, based on the computation of diffusion parameters derived directly from an estimate of the diffusion propagator, which innately holds the potential to reveal specific white matter microstructural deficiencies characteristic of MCI and AD. Future work will focus on translating this analysis to larger cohorts (which will improve statistical power), quantifying differences in microstructural parameters between specific ROIs, and employing tractography to visualize deterioration in specific WM tracts.
Acknowledgements
No acknowledgement found.References
1. Roberts, R., & Knopman, D. S. (2013). Classification and epidemiology of MCI. Clinics in geriatric medicine, 29(4), 753–772.
2. Teipel SJ, Grothe M, Lista S, et al. (2013). Relevance of magnetic resonance imaging for early detection and diagnosis of Alzheimer disease. Med Clin North Am. 97:399–424.
3. Masdeu JC, Kreisl WC, Berman KF. (2012). The neurobiology of Alzheimer disease defined by neuroimaging. Curr Opin Neurol. 25:410–420.
4. Chevalier-Larsen E, Holzbaur EL. Axonal transport and neurodegenerative disease. (2006). Biochim Biophys Acta.1762:1094–1108.
5. Gold BT, Johnson NF, Powell DK, et al. (2012). White matter integrity and vulnerability to Alzheimer’s disease: preliminary findings and future directions. Biochim Biophys Acta. 1822:416–422. 6. Stokin GB, Lillo C, Falzone TL, et al. (2005). Axonopathy and transport deficits early in the pathogenesis of Alzheimer’s disease. Science. 307:1282–1288.
7. Racine AM, Alduru N, et al. (2014) Associations between white matter microstructure and amyloid burden in preclinical Alzheimer's disease: A multimodal imaging investigation. NeuroImage: Clinical. 4:604-614.
8. Agosta F, Pievani M, Sala S, et al. (2011) White matter damage in Alzheimer disease and its relationship to gray matter atrophy. Radiology. 258:853–863.
9. Canu E, McLaren DG, Fitzgerald ME, et al. (2010). Microstructural diffusion changes are independent of macrostructural volume loss in moderate to severe Alzheimer’s disease. J Alzheimers Dis.19:963–976.
10. Salat DH, Tuch DS, van der Kouwe AJ, et al. (2010). White matter pathology isolates the hippocampal formation in Alzheimer’s disease. Neurobiol Aging. 31:244–256.
11. Stricker NH, Salat DH, Foley JM, et al. (2013). Decreased white matter integrity in neuropsychologically defined mild cognitive impairment is independent of cortical thinning. J Int Neuropsychol Soc.19:925–937.
12. Sun, X., Salat, D., Upchurch, K., Deason, R., Kowall, N., Budson, A., & Alzheimer’s Disease Neuroimaging Initiative (2014). Destruction of white matter integrity in patients with mild cognitive impairment and Alzheimer disease. Journal of investigative medicine: the official publication of the American Federation for Clinical Research, 62(7):927–933.
13. Alexander, A. L., Lee, J. E., Lazar, M., & Field, A. S. (2007). Diffusion tensor imaging of the brain. Neurotherapeutics : the journal of the American Society for Experimental NeuroTherapeutics, 4(3):316–329.
14. Jones DK, Thomas KR, Turner R. (2013). White matter integrity, fiber count, and other fallacies: The do’s and don’ts of diffusion MRI. NeuroImage. 73:239-254.
15. Wu, Y. C., & Alexander, A. L. (2007). Hybrid diffusion imaging. NeuroImage, 36(3), 617–629.
16. J.L.R. Andersson, S. Skare, J. Ashburner. (2003). How to correct susceptibility distortions in spin-echo echo-planar images: application to diffusion tensor imaging. NeuroImage, 20(2):870-888.
17. Jesper L. R. Andersson and Stamatios N. Sotiropoulos. (2016). An integrated approach to correction for off-resonance effects and subject movement in diffusion MR imaging. NeuroImage, 125:1063-1078. 18. Jesper L. R. Andersson, Mark S. Graham, Eniko Zsoldos and Stamatios N. Sotiropoulos. (2016). Incorporating outlier detection and replacement into a non-parametric framework for movement and distortion correction of diffusion MR images. NeuroImage, 141:556-572.
19. Fick Rutger HJ, Wasserman D, Caruyer E, Deriche R. (2016). MAPL: Tissue microstructure estimation using Laplacian-regularized MAP-MRI and its application to HCP data. NeuroImage. 134:365-385.
20. Garyfallidis E, Brett M, Amirbekian B, Rokem A, van der Walt S, Descoteaux M, Nimmo-Smith I; Dipy Contributors. Dipy, a library for the analysis of diffusion MRI data. Front Neuroinform. 2014 Feb 21;8:8. doi: 10.3389/fninf.2014.00008. PMID: 24600385; PMCID: PMC3931231.
21. Smith SM, M. Jenkinson, H. Johansen-Berg, D. Rueckert, T.E. Nichols, C.E. Mackay, K.E. Watkins, O. Ciccarelli, M.Z. Cader, P.M. Matthews, and T.E.J. Behrens. (2006). Tract-based spatial statistics: Voxelwise analysis of multi-subject diffusion data. NeuroImage, 31:1487-1505.
22. Winkler AM, Ridgway GR, Webster MA, Smith SM, Nichols TE. (2014). Permutation inference for the general linear model. NeuroImage, 92:381-397.
23. Smith SM, Nichols TE. (2009). Threshold-free cluster enhancement: Addressing problems of smoothing, threshold dependence and localisation in cluster inference. NeuroImage, 44(1):83-98.
24. Cooley, S. A., Cabeen, R. P., Laidlaw, D. H., Conturo, T. E., Lane, E. M., Heaps, J. M., … Paul, R. H. (2015). Posterior brain white matter abnormalities in older adults with probable mild cognitive impairment. Journal of clinical and experimental neuropsychology, 37(1), 61–69.
25. Kramer PL, Xu H, Woltjer RL, et al. (2011). Alzheimer disease pathology in cognitively healthy elderly: a genome-wide study. Neurobiol Aging. 32(12):2113–22.
26. Erten-Lyons D, Woltjer RL, Dodge H, et al. (2009). Factors associated with resistance to dementia despite high Alzheimer disease pathology. Neurology. 72(4):354–60.
27. Iacono D, O’Brien R, Resnick SM, et al. (2008). Neuronal hypertrophy in asymptomatic Alzheimer disease. J Neuropathol Exp Neurol. 67(6):578–89.
Figures