0212
Dynamic glucose enhanced (DGE) MRI at 3T detects alterations in glucose uptake and clearance in young and old Alzheimer’s mice1Department of Biomedical Engineering, City University of Hong Kong, Hong Kong, China, 2Department of Electrical and Electronic Engineering, The University of Hong Kong, Hong Kong, China, 3Department of Health Technology and Informatics, The Hong Kong Polytechnic University, Hong Kong, China, 4Russell H. Morgan Department of Radiology and Radiological Science, The Johns Hopkins University School of Medicine, Baltimore, MD, United States, 5F.M. Kirby Research Center for Functional Brain Imaging, Kennedy Krieger Research Institute, Baltimore, MD, United States
Synopsis
On-resonance variable delay multiple pulse (onVDMP) CEST MRI was applied to detect dynamic D-glucose enhanced signal in brain parenchyma and CSF of 6- and 16-month old APP/PS1 AD mice. A significantly slower D-glucose clearance from CSF was observed in young AD mice compared to age-matched wild type (WT) mice. Moreover, a reduced D-glucose uptake was observed both in parenchyma and CSF of old APP/PS1 mice. D-glucose kinetics detected by onVDMP can be used to assess the alterations in D-glucose uptake and clearance in AD and in the course of AD progression at 3T, a clinical relevant MRI field.
Introduction
Alzheimer’s disease (AD) is the most common form of dementia, which causes an increasing burden to aging societies (1-5). A change in cerebral glucose uptake is one of the hallmarks of AD (6,7). We and others have demonstrated that sugars can be detected by glucoCEST MRI (8-13). Alternative methods, such as chemical exchange sensitive spin-lock (CESL) (14-16) and T2 relaxation (17-19), can also detect glucose uptake in vivo. Dynamic glucose enhanced (DGE) MRI contains information regarding perfusion, tissue transport, and cellular metabolism (15,16,20-30). DGE studies are challenging at 3T, due to the scaling effects from magnetization transfer contrast (MTC) and water direct saturation (DS) and the fast exchange limit for OH protons. In this study, we applied an on-resonance variable delay multiple pulse (onVDMP) MRI (31-34) to dynamically detect D-glucose uptake and clearance in mouse brain parenchyma and CSF on a 3T animal scanner. By adjusting the length of the saturation period, onVDMP can simultaneously monitor kinetics for brain parenchyma and CSF. We studied kinetics in AD (amyloid precursor protein and presenilin-1, APP/PS1) (35) and wild type (WT) mouse brains for two age groups (6-month (6M) and 16-month (6M)). Studying the uptake and clearance of D-glucose in CSF could be a potential approach to examine the functioning of the glymphatic pathway, which has been reported to be affected in AD (36,37).Methods
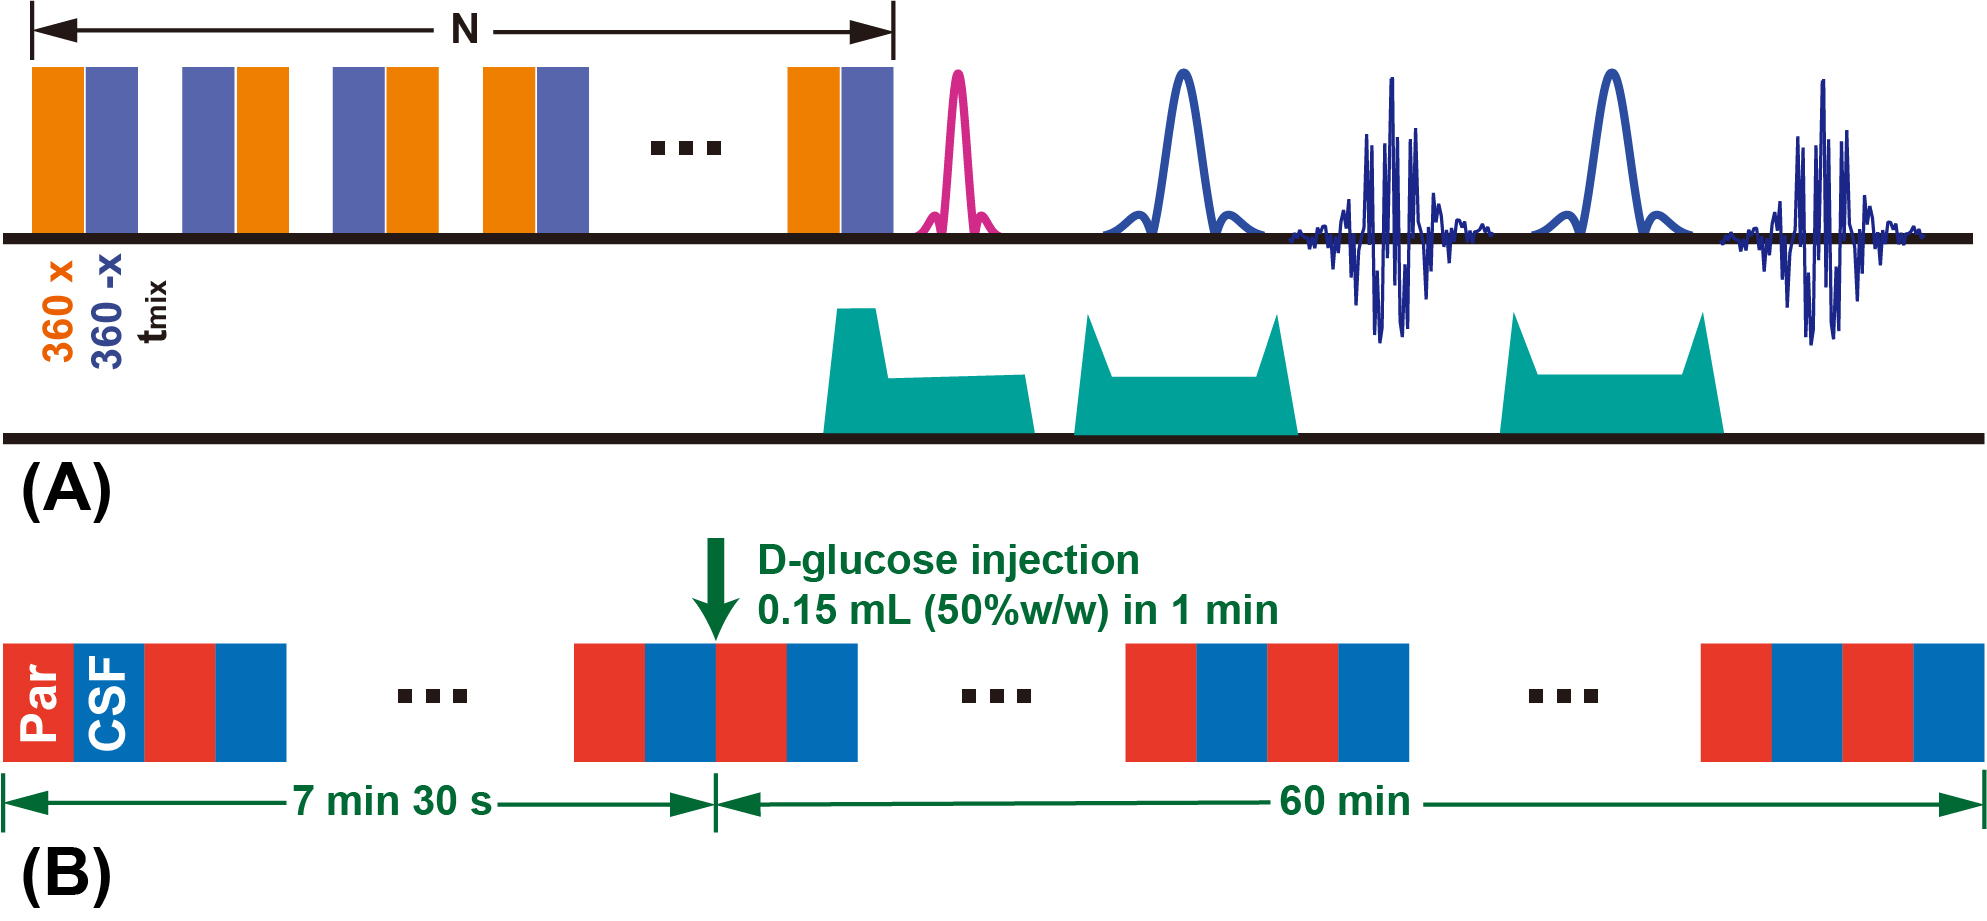
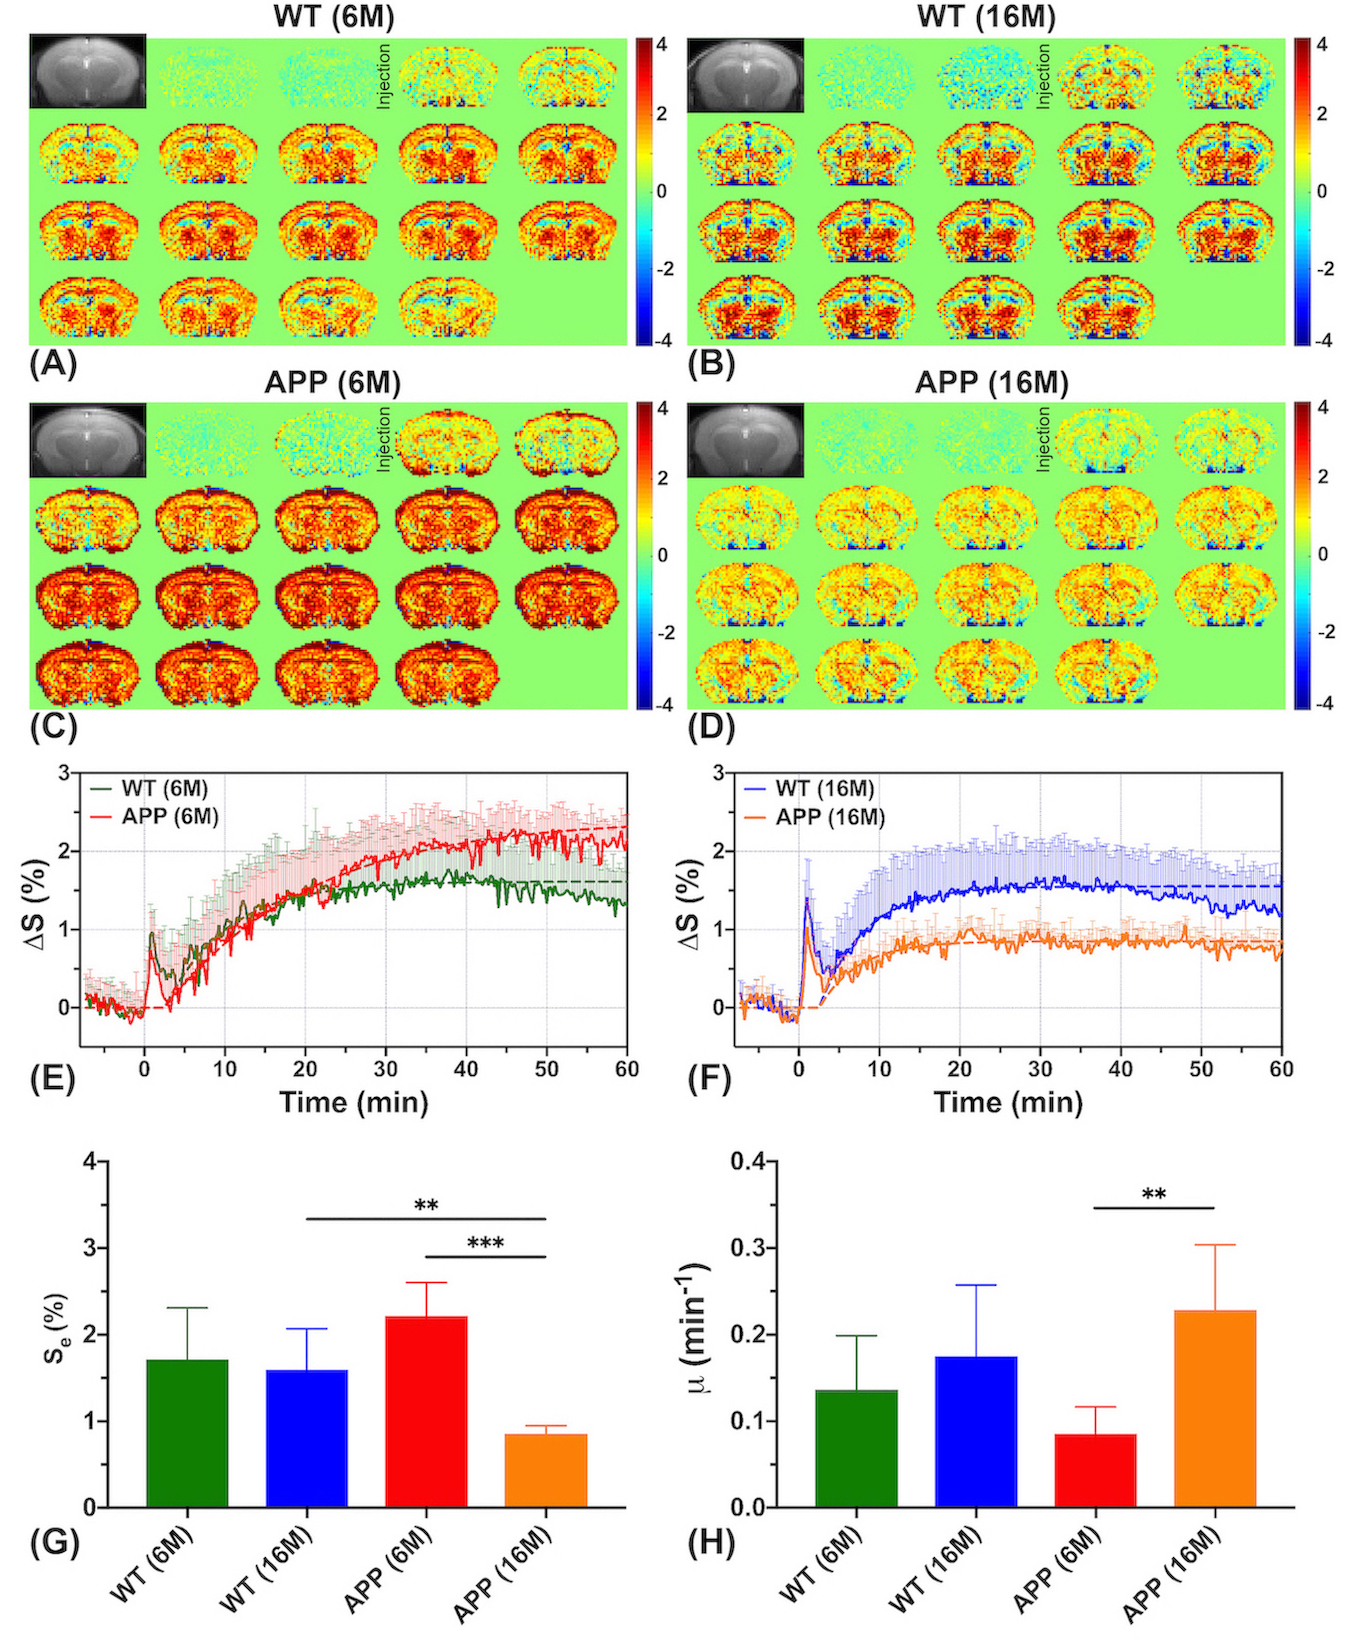
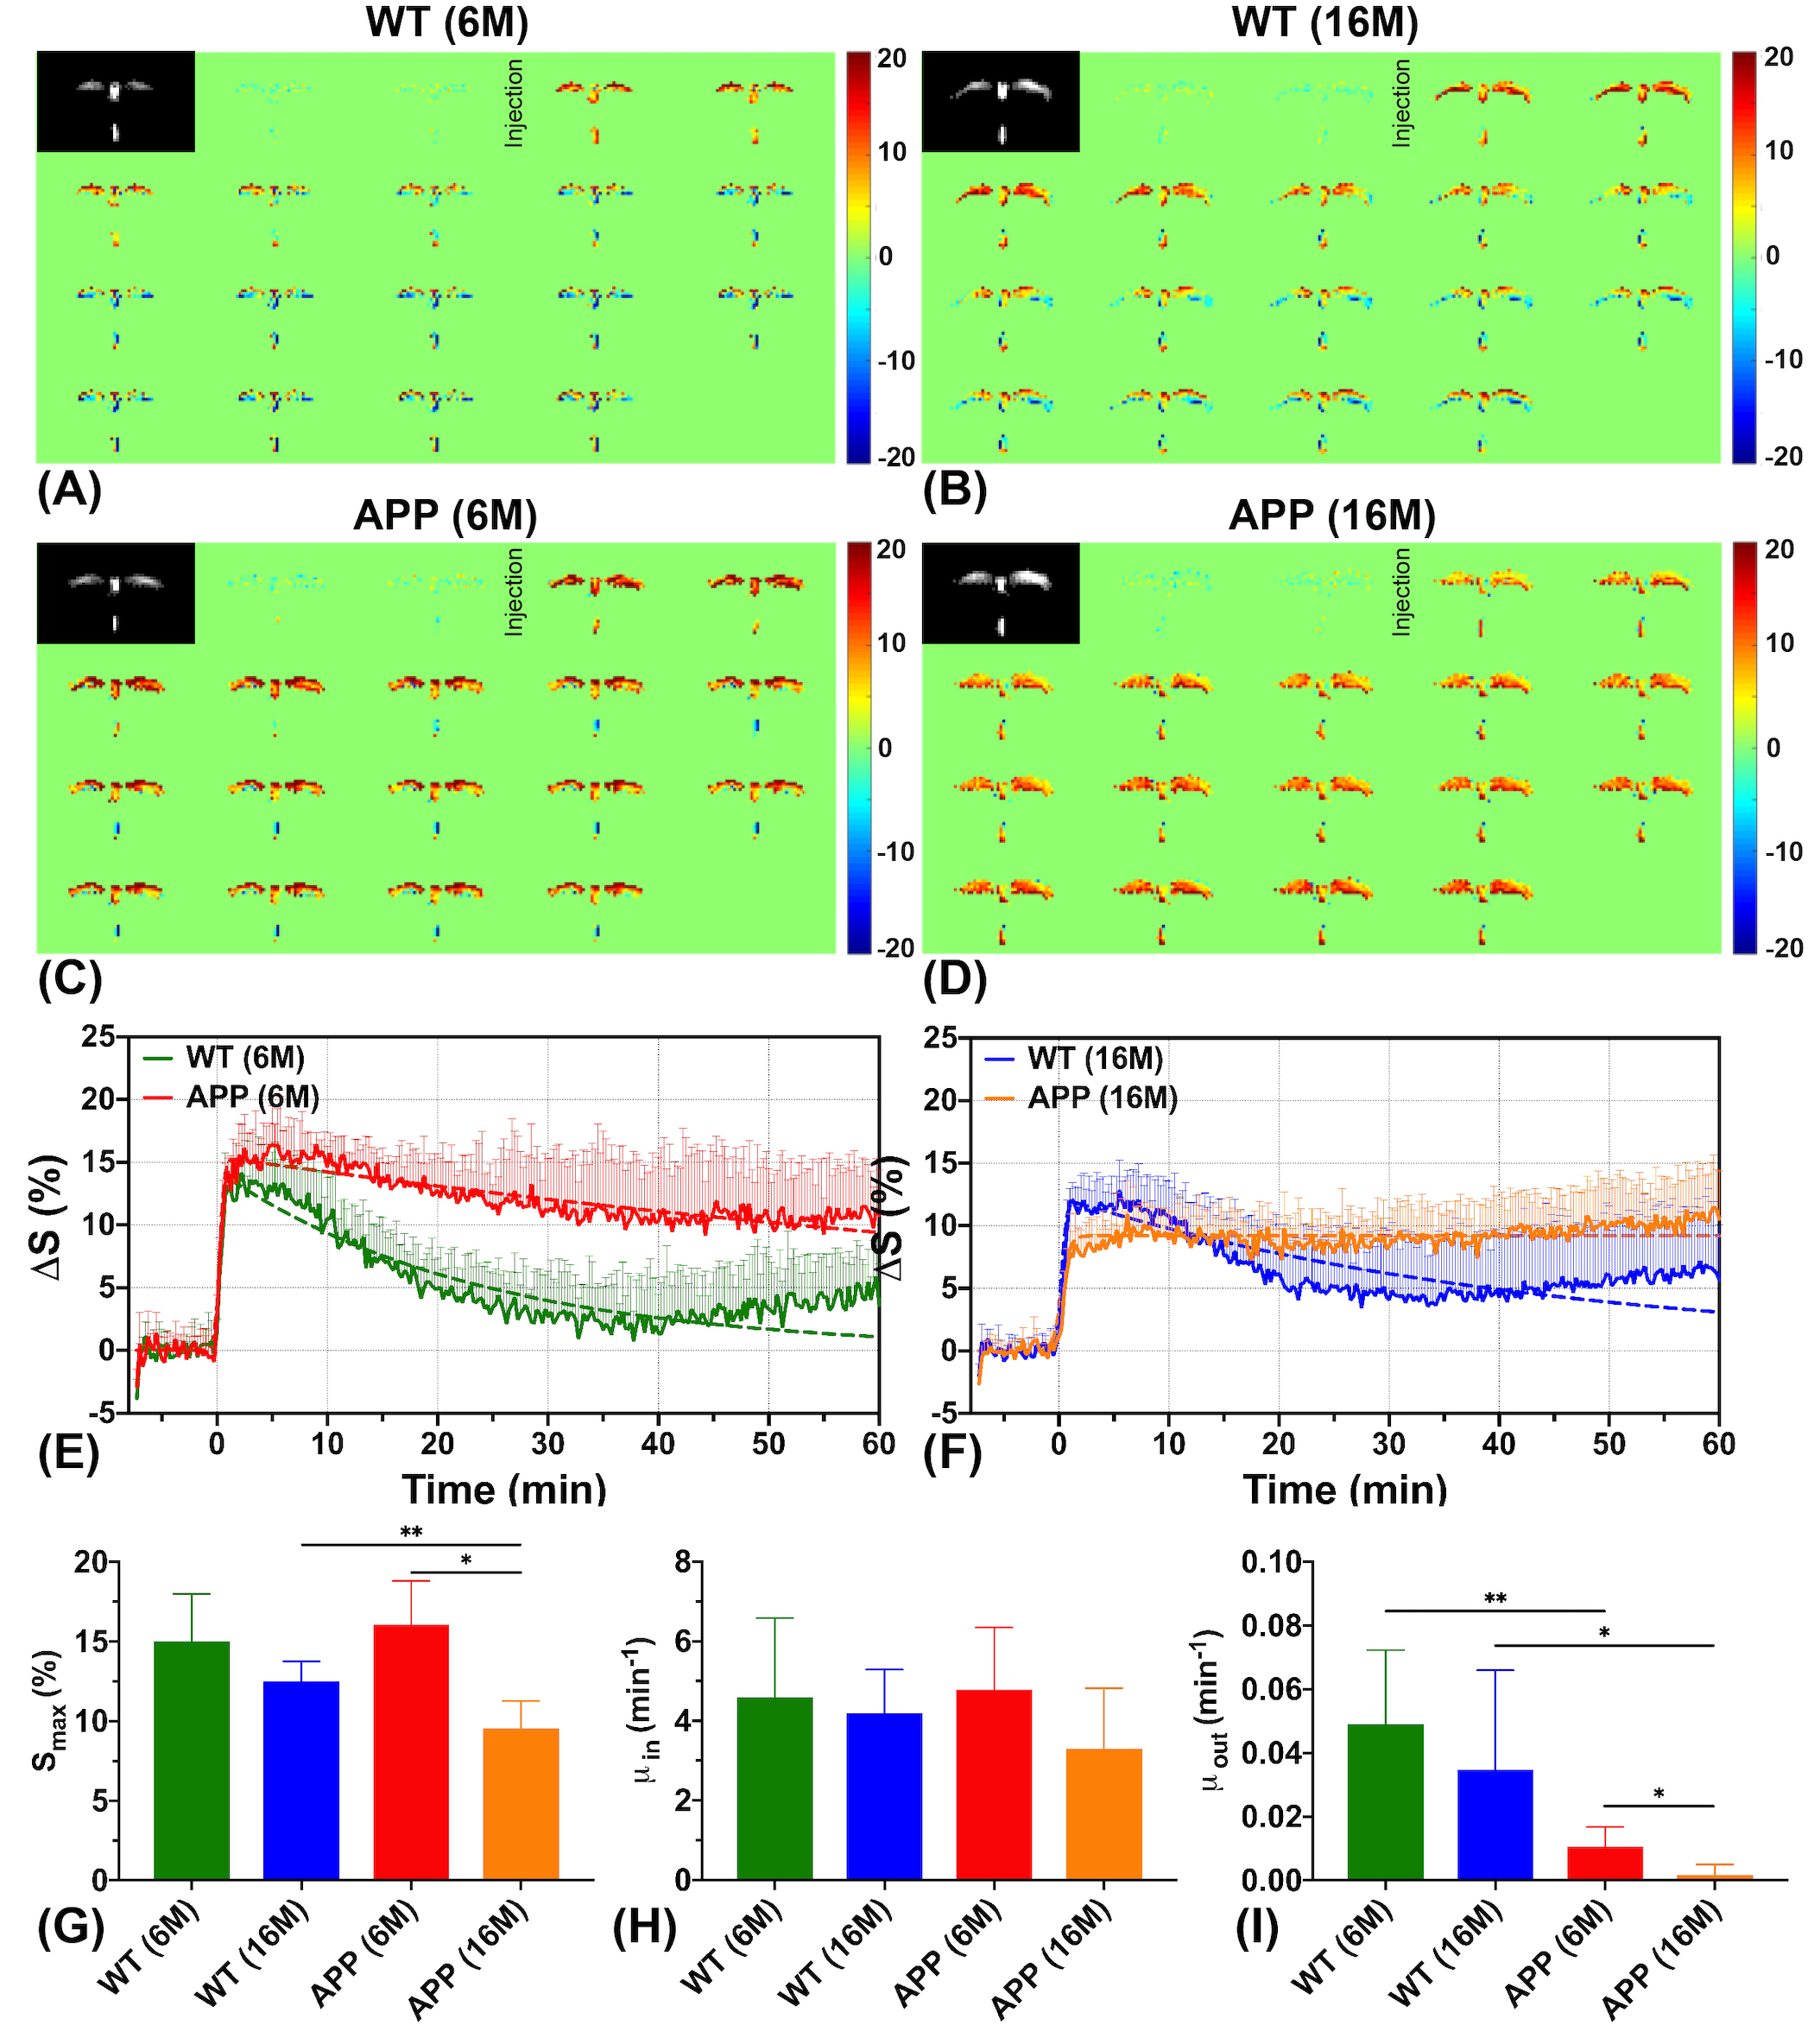
Ten APP/PS1 mice (five 6M and five 16M, male, Jackson Laboratory, Maine) and ten age-matched WT mice were used in this study. MRI experiments were performed on a horizontal bore 3T Bruker BioSpec system (Bruker, Germany). The basic saturation module in the onVDMP sequence (Fig. 1A) is a train of high-power binomial pulses with zero binomial pulse interval and offset at the water frequency (31-34). A phase cycling scheme was introduced to improve the resistance to B0 and B1 inhomogeneities (38). By setting different saturation lengths (60ms for parenchyma and 900ms for CSF here), we can image the parenchyma and CSF alternatingly. Time resolution for each pair of images was 15s (7.5s for parenchyma and CSF respectively), resulting in a total scanning time of 1h7min30s (540 images, 270 for parenchyma and CSF respectively). A bolus of 0.15 mL filtered 50% D-glucose was injected into mice at 7min30s through tail vein (1min) using a MRI-compatible syringe pump. Hence the baseline is 7min30s and the post monitoring time is 1h (Fig. 1B). The DGE kinetic curves were constructed as:$$\triangle S(t) = \frac{S_{base}-S(t)}{S_{base}}$$The parenchymal DGE uptake was fitted by an exponential model:$$\triangle S_{par}^\prime(t)=S_{e}(40min)\cdot(1-e^{-\mu(t-t_{0})})$$where t0 indicates the time point of D-glucose enhancing, μ is the D-glucose uptake rate and Se is the DGE signal at equilibrium. The CSF DGE uptake was approximated by a sigmoid model (39,40):$$\triangle S_{CSF}^\prime(t) = \frac{S_{max}e^{-\mu_{out}(t-t_{0})}}{1+e^{-\mu_{in}(t-t_{0})}}$$where μin represents the D-glucose uptake rate, μout the washout rate, and Smax the maximum signal reached.Results and Discussion
At younger age (6M), APP/PS1 mice showed a trend towards slightly higher D-glucose uptake (Se) than WT mice (2.22±0.39% vs 1.71±0.60%, P=0.150) in the brain parenchyma (Figs. 2A,C,E,G). The difference became significant at the later stage of the DGE curves (60 minutes) (APP/PS1:2.15±0.32% vs WT:1.29±0.43%, P<0.05), which may be due to similar transport but decreased D-glucose consumption in APP/PS1 mice. By comparing the two age groups (16M:6M), the WT mice did not show clear age dependence on the D-glucose uptake (Fig. 2G), but the D-glucose uptake of APP/PS1 significantly reduced, showing much smaller values compared to WT at old age (0.85±0.10% vs 1.60±0.47%, P=0.009) (Fig. 2G). Similarly, the D-glucose uptake rate μ of WT mice did not show a clear age dependence (P=0.429), but increased significantly for APP/PS1 mice at the older age (P=0.004). D-glucose uptake in the CSF (Smax) for APP/PS1 mice was close to that of WT at 6M (P=0.581) as seen from the CSF DGE curves (Figs. 3E,F). Similar to the D-glucose uptake in brain parenchyma, the CSF D-glucose uptake Smax was not age dependent in WT mice. However, the Smax became much lower at 16M for APP/PS1 compared to the younger APP/PS1 and age matched WT mice (Fig. 3G). In both young and old groups, the D-glucose clearance (μout), which is an indirect measurement of the brain glymphatic pathway, was significantly slower in APP/PS1 compared to WT (6M:P=0.007, 16M:P=0.046). This echoes a recent study showing impaired glymphatic function in the early stage of APP/PS1 AD mice prior to plaque formation (41). In parenchyma, D-glucose uptake measured by DGE MRI provides information on D-glucose transporter functioning as well as metabolism. In CSF, transport function and clearance can be visualized. For parenchyma, our results suggest that dysfunction of D-glucose metabolism occurs already in young AD mice, while transport and metabolism are impaired in older AD mice, in line with literature (42). Uptake in and clearance from CSF are impaired for APP/PS1 mice in the later stage of the disease.Conclusion
The onVDMP DGE method has potential as a diagnostic tool for the assessment of alterations in D-glucose uptake and clearance in AD mice at 3T. Moreover, it could be a robust method to study D-glucose transporter functioning at both the blood brain and blood CSF barriers, as well as functioning of the glymphatic pathway.Acknowledgements
We are grateful to receive funding support from the RGC [9042620], City University of Hong Kong [9610362, 9680247, 7200516, 7004859] and National Institutes of Health [R01EB019934].References
1. Barker WW, Luis CA, Kashuba A, Luis M, Harwood DG, Loewenstein D, Waters C, Jimison P, Shepherd E, Sevush S. Relative frequencies of Alzheimer disease, Lewy body, vascular and frontotemporal dementia, and hippocampal sclerosis in the State of Florida Brain Bank. Alz Dis Assoc Dis 2002;16(4):203-212.
2. Heneka MT, Carson MJ, El Khoury J, Landreth GE, Brosseron F, Feinstein DL, Jacobs AH, Wyss-Coray T, Vitorica J, Ransohoff RM. Neuroinflammation in Alzheimer's disease. Lancet Neurol 2015;14(4):388-405.
3. Huang Y, Mucke L. Alzheimer mechanisms and therapeutic strategies. Cell 2012;148(6):1204-1222.
4. Selkoe DJ, Hardy J. The amyloid hypothesis of Alzheimer's disease at 25 years. EMBO Mol Med 2016;8(6):595-608.
5. Wilson RS, Segawa E, Boyle PA, Anagnos SE, Hizel LP, Bennett DA. The natural history of cognitive decline in Alzheimer's disease. Psychol Aging 2012;27(4):1008-1017.
6. Beglopoulos V, Tulloch J, Roe A, Daumas S, Ferrington L, Watson R, Fan Z, Hyman B, Kelly P, Bard F. Early detection of cryptic memory and glucose uptake deficits in pre-pathological APP mice. Nat Commun 2016;7:11761.
7. Niwa K, Kazama K, Younkin SG, Carlson GA, Iadecola C. Alterations in cerebral blood flow and glucose utilization in mice overexpressing the amyloid precursor protein. Neurobiol Dis 2002;9(1):61-68.
8. Jones KM, Pollard AC, Pagel MD. Clinical applications of chemical exchange saturation transfer (CEST) MRI. J Magn Reson Imaging 2018;47(1):11-27.
9. van Zijl PC, Lam WW, Xu J, Knutsson L, Stanisz GJ. Magnetization transfer contrast and chemical exchange saturation transfer MRI. Features and analysis of the field-dependent saturation spectrum. NeuroImage 2018;168:222-241.
10. Van Zijl PC, Yadav NN. Chemical exchange saturation transfer (CEST): what is in a name and what isn't? Magn Reson Med 2011;65(4):927-948.
11. Ward K, Aletras A, Balaban RS. A new class of contrast agents for MRI based on proton chemical exchange dependent saturation transfer (CEST). J Magn Reson 2000;143(1):79-87.
12. Chan KW, McMahon MT, Kato Y, Liu G, Bulte JW, Bhujwalla ZM, Artemov D, van Zijl PC. Natural D‐glucose as a biodegradable MRI contrast agent for detecting cancer. Magn Reson Med 2012;68(6):1764-1773.
13. Walker-Samuel S, Ramasawmy R, Torrealdea F, Rega M, Rajkumar V, Johnson SP, Richardson S, Gonçalves M, Parkes HG, Årstad E. In vivo imaging of glucose uptake and metabolism in tumors. Nat Med 2013;19(8):1067-1072.
14. Jin T, Mehrens H, Hendrich KS, Kim S-G. Mapping brain glucose uptake with chemical exchange-sensitive spin-lock magnetic resonance imaging. J Cerebr Blood F Met 2014;34(8):1402-1410.
15. Jin T, Mehrens H, Wang P, Kim S-G. Chemical exchange-sensitive spin-lock MRI of glucose analog 3-O-methyl-d-glucose in normal and ischemic brain. J Cerebr Blood F Met 2018;38(5):869-880.
16. Paech D, Schuenke P, Koehler C, Windschuh J, Mundiyanapurath S, Bickelhaupt S, Bonekamp D, Bäumer P, Bachert P, Ladd ME. T1ρ-weighted dynamic glucose-enhanced MR imaging in the human brain. Radiology 2017;285(3):914-922.
17. Gore J, Brown M, Mizumoto C, Armitage I. Influence of glycogen on water proton relaxation times. Magn Reson Med 1986;3(3):463-466.
18. Yadav NN, Xu J, Bar-Shir A, Qin Q, Chan KW, Grgac K, Li W, McMahon MT, van Zijl PC. Natural D-glucose as a biodegradable MRI relaxation agent. Magn Reson Med 2014;72(3):823-828.
19. Zu Z, Spear J, Li H, Xu J, Gore JC. Measurement of regional cerebral glucose uptake by magnetic resonance spin-lock imaging. Magn Reson Imaging 2014;32(9):1078-1084.
20. Kentrup D, Bovenkamp P, Busch A, Schuette-Nuetgen K, Pawelski H, Pavenstädt H, Schlatter E, Herrmann K-H, Reichenbach JR, Löffler B. GlucoCEST magnetic resonance imaging in vivo may be diagnostic of acute renal allograft rejection. Kidney Int 2017;92(3):757-764.
21. Knutsson L, Seidemo A, Scherman AR, Bloch KM, Kalyani RR, Andersen M, Sundgren PC, Wirestam R, Helms G, van Zijl PC. Arterial Input Functions and Tissue Response Curves in Dynamic Glucose-Enhanced (DGE) Imaging: Comparison Between glucoCEST and Blood Glucose Sampling in Humans. Tomography 2018;4(4):164-171.
22. Nasrallah FA, Pagès G, Kuchel PW, Golay X, Chuang K-H. Imaging brain deoxyglucose uptake and metabolism by glucoCEST MRI. J Cerebr Blood F Met 2013;33(8):1270-1278.
23. Schuenke P, Koehler C, Korzowski A, Windschuh J, Bachert P, Ladd ME, Mundiyanapurath S, Paech D, Bickelhaupt S, Bonekamp D. Adiabatically prepared spin-lock approach for T1ρ-based dynamic glucose enhanced MRI at ultrahigh fields. Magn Reson Med 2017;78(1):215-225.
24. Schuenke P, Paech D, Koehler C, Windschuh J, Bachert P, Ladd ME, Schlemmer H-P, Radbruch A, Zaiss M. Fast and quantitative T1ρ-weighted dynamic glucose enhanced MRI. Sci Rep 2017;7:42093.
25. Sehgal AA, Li Y, Lal B, Yadav NN, Xu X, Xu J, Laterra J, van Zijl PC. CEST MRI of 3-O-methyl-D-glucose uptake and accumulation in brain tumors. Magn Reson Med 2019;81(3):1993-2000.
26. Tolomeo D, Micotti E, Serra SC, Chappell M, Snellman A, Forloni G. Chemical exchange saturation transfer MRI shows low cerebral 2-deoxy-D-glucose uptake in a model of Alzheimer’s Disease. Sci Rep 2018;8(1):9576.
27. Xu X, Chan KW, Knutsson L, Artemov D, Xu J, Liu G, Kato Y, Lal B, Laterra J, McMahon MT. Dynamic glucose enhanced (DGE) MRI for combined imaging of blood–brain barrier break down and increased blood volume in brain cancer. Magn Reson Med 2015;74(6):1556-1563.
28. Xu X, Xu J, Knutsson L, Liu J, Liu H, Li Y, Lal B, Laterra J, Artemov D, Liu G. The effect of the mTOR inhibitor rapamycin on glucoCEST signal in a preclinical model of glioblastoma. Magn Reson Med 2019;81(6):3798-3807.
29. Xu X, Yadav NN, Knutsson L, Hua J, Kalyani R, Hall E, Laterra J, Blakeley J, Strowd R, Pomper M. Dynamic glucose-enhanced (DGE) MRI: translation to human scanning and first results in glioma patients. Tomography 2015;1(2):105-114.
30. Huang J, Xu J, Dong CM, Chen L, Han X, Wu EX, Van Zijl P, Chan KW. Impaired glucose uptake in mouse brain with Alzheimer’s disease detected by dynamic glucose enhanced (DGE) MRI at 3T. Alzheimers Dement 2019;15(7):747.
31. Wu D, Xu J, Lei J, Mclane M, van Zijl PC, Burd I. Dynamic glucose enhanced MRI of the placenta in a mouse model of intrauterine inflammation. Placenta 2018;69:86-91.
32. Xu J, Chan KW, Xu X, Yadav N, Liu G, van Zijl PC. On-resonance variable delay multipulse scheme for imaging of fast-exchanging protons and semisolid macromolecules. Magn Reson Med 2017;77(2):730-739.
33. Xu X, Chan KWC, Liu H, Li Y, Liu G, van Zijl PCM, Xu J. On Resonance VDMP Technique for Improved glucoCEST Detection in Brain Tumors. 2016; Singapore. p 1515.
34. Xu X, Xu J, Chan KW, Liu J, Liu H, Li Y, Chen L, Liu G, van Zijl PC. GlucoCEST imaging with on‐resonance variable delay multiple pulse (onVDMP) MRI. Magn Reson Med 2019;81(1):47-56.
35. Drummond E, Wisniewski T. Alzheimer’s disease: experimental models and reality. Acta Neuropathol 2017;133(2):155-175.
36. Da Mesquita S, Louveau A, Vaccari A, Smirnov I, Cornelison RC, Kingsmore KM, Contarino C, Onengut-Gumuscu S, Farber E, Raper D. Functional aspects of meningeal lymphatics in ageing and Alzheimer’s disease. Nature 2018;560(7717):185-191.
37. Iliff JJ, Wang M, Liao Y, Plogg BA, Peng W, Gundersen GA, Benveniste H, Vates GE, Deane R, Goldman SA. A paravascular pathway facilitates CSF flow through the brain parenchyma and the clearance of interstitial solutes, including amyloid β. Sci Transl Med 2012;4(147):147ra111.
38. Levitt MH. Spin dynamics: basics of nuclear magnetic resonance: John Wiley & Sons; 2001.
39. Hamy V, Dikaios N, Punwani S, Melbourne A, Latifoltojar A, Makanyanga J, Chouhan M, Helbren E, Menys A, Taylor S. Respiratory motion correction in dynamic MRI using robust data decomposition registration–Application to DCE-MRI. Med Image Anal 2014;18(2):301-313.
40. Melbourne A, Hipwell J, Modat M, Mertzanidou T, Huisman H, Ourselin S, Hawkes D. The effect of motion correction on pharmacokinetic parameter estimation in dynamic-contrast-enhanced MRI. Phys Med Biol 2011;56(24):7693-7708.
41. Peng W, Achariyar TM, Li B, Liao Y, Mestre H, Hitomi E, Regan S, Kasper T, Peng S, Ding F. Suppression of glymphatic fluid transport in a mouse model of Alzheimer's disease. Neurobiol Dis 2016;93:215-225.
42. Hooijmans CR, Graven C, Dederen PJ, Tanila H, van Groen T, Kiliaan AJ. Amyloid beta deposition is related to decreased glucose transporter-1 levels and hippocampal atrophy in brains of aged APP/PS1 mice. Brain Res 2007;1181:93-103.
Figures