0211
Spatio-temporal alterations in functional connectivity, microstructure and cerebral glucose metabolism in a rat model of sporadic Alzheimer’s1Ecole Polytechnique Fédérale de Lausanne, Lausanne, Switzerland, 2Faculdade de Ciências da Universidade de Lisboa, Lisbon, Portugal
Synopsis
Impaired brain glucose consumption is a possible trigger of Alzheimer’s disease (AD). Animal models can help characterize each contributor to the cascade independently. Here we report a comprehensive longitudinal study of functional connectivity, white matter microstructure and brain glucose metabolism using resting-state fMRI, diffusion MRI and FDG-PET in the intracerebroventricular-streptozotocin rat model of AD. Our study highlights the dynamics of how brain insulin resistance affects brain structure and function, and identifies potent MRI-derived biomarkers to track neurodegeneration in human AD and diabetic populations.
Introduction
Impaired brain glucose consumption is a possible trigger of Alzheimer’s disease (AD)1, along with amyloid plaques and neurofibrillary tangles of tau. It has been shown that brain insulin resistance can be induced in rats and monkeys by an intracerebroventricular (icv) injection of streptozotocin (STZ) and several studies have reported AD-like features in icv-STZ animals2–4. However, the effects of brain insulin resistance on neurodegeneration are not fully understood.Here, we performed a first-time longitudinal study in the icv-STZ rat model to characterize alterations in functional connectivity (FC) and white matter (WM) microstructure using functional and diffusion MRI, and compare them to changes in brain glucose metabolism using FDG-PET. Our study highlights the dynamics of how insulin resistance affects brain structure and function, and identifies potent MRI-derived biomarkers to track neurodegeneration in human AD and diabetic populations.
Methods
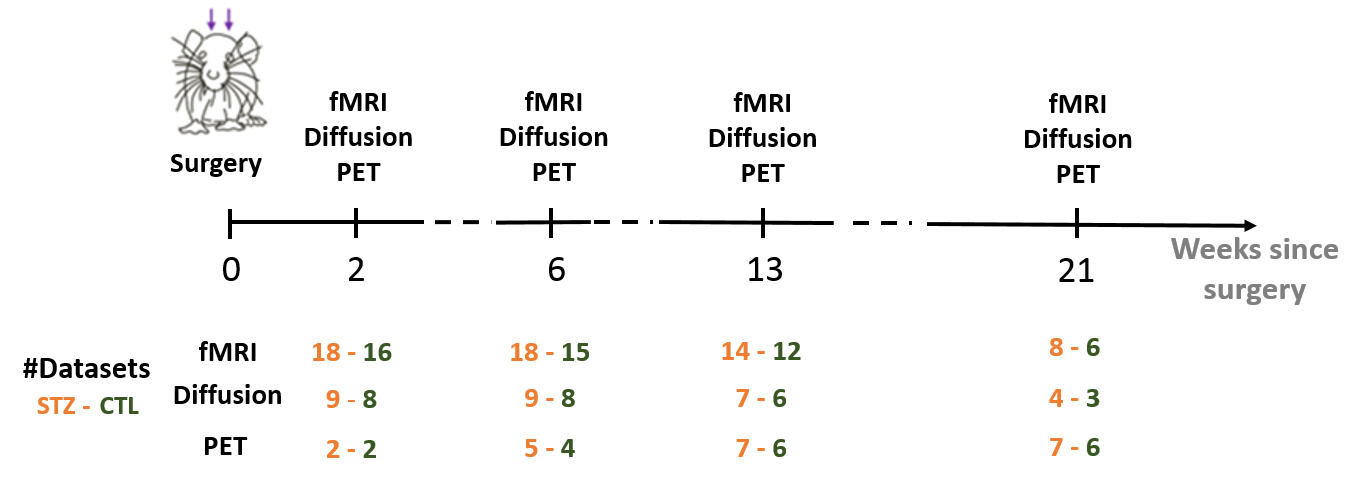
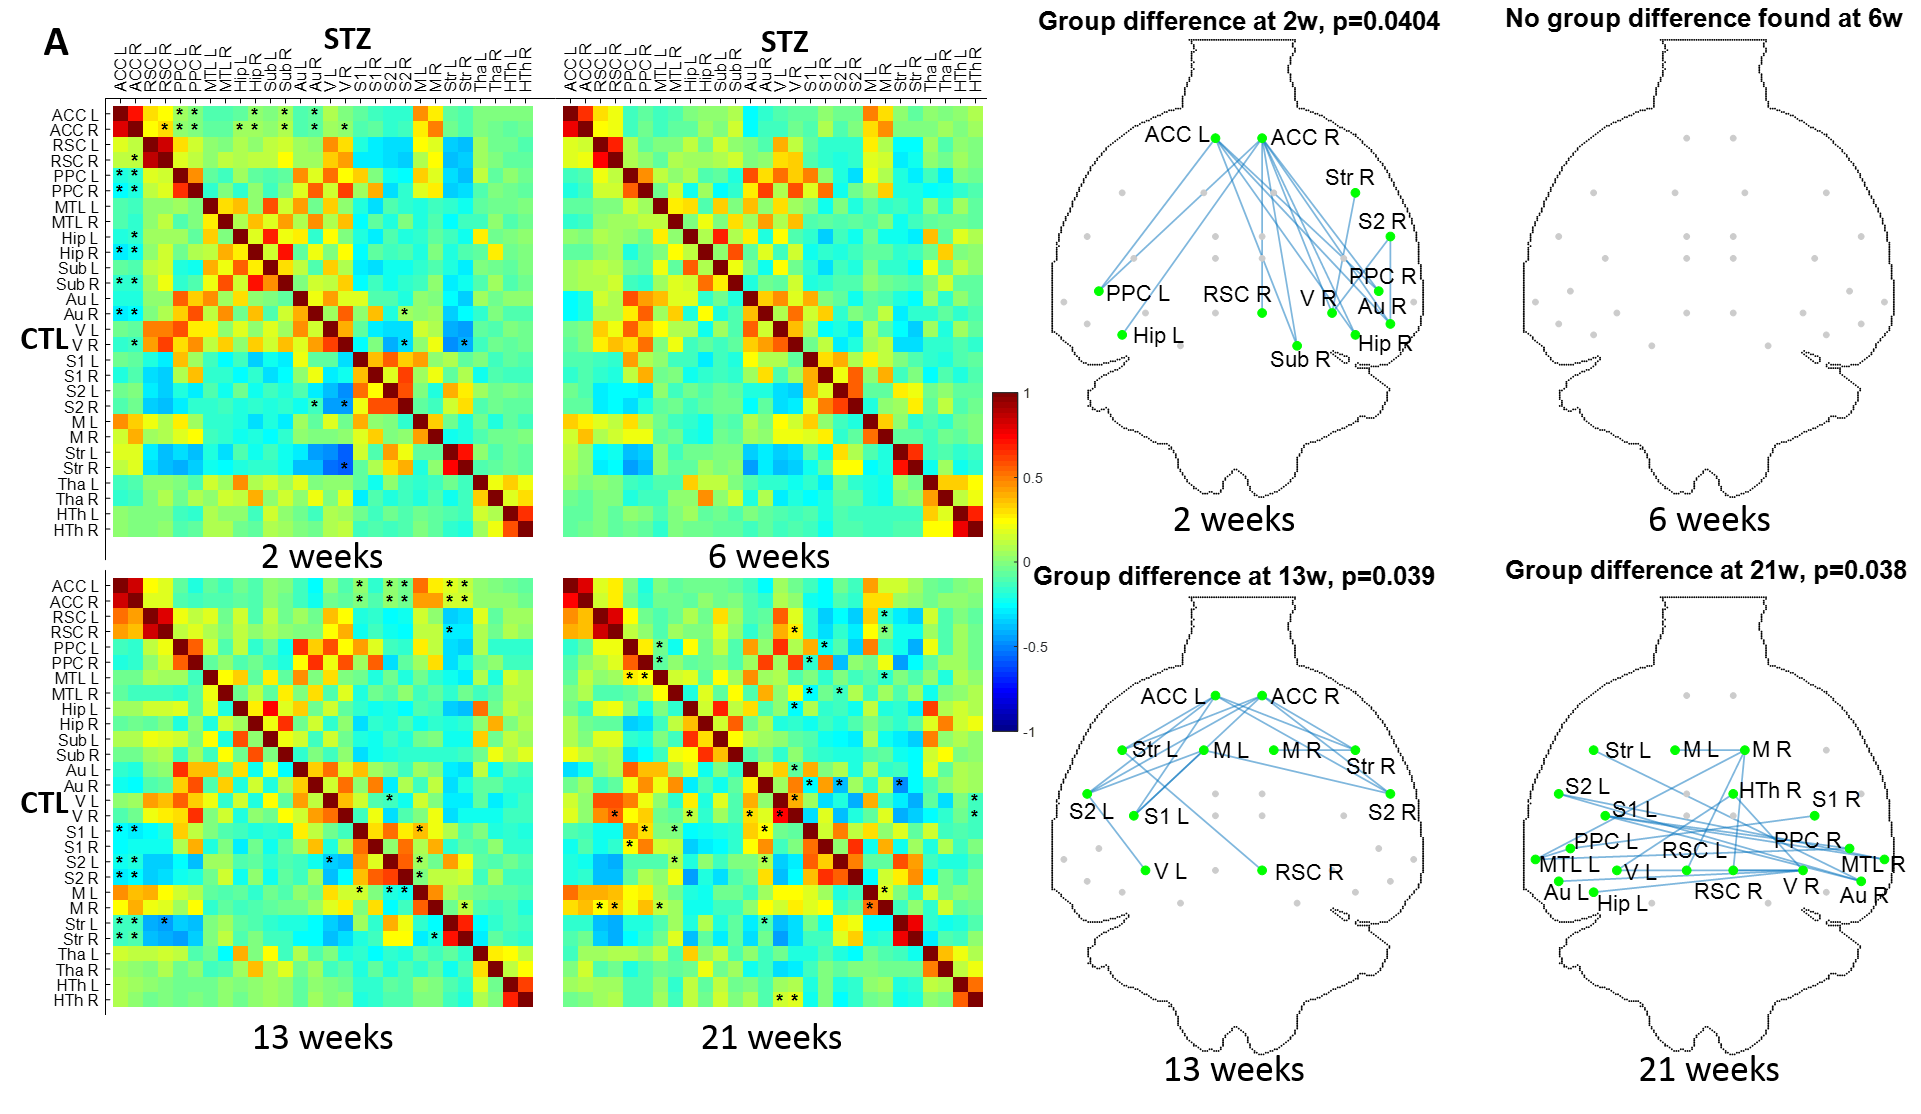
All experiments were approved by the local Service for Veterinary Affairs. Male Wistar rats (N=17) (236±11 g at baseline) underwent a bilateral icv-injection of either streptozotocin (3 mg/kg, STZ group, N=9) or buffer (CTL group, N=8). MRI: Rats were scanned at 4 timepoints following surgery (Figure 1), on a 14T Varian system. Briefly, rats were anesthetized using isoflurane for initial setup and switched to medetomidine sedation (bolus: 0.1mg/kg, perfusion: 0.1mg/kg/h). Resting-state (rs-)fMRI data were acquired using a two-shot gradient-echo EPI sequence (TE/TR=10/800ms; Matrix: 64x64; FOV: 23x23mm2; 8 1.12-mm slices; 370 repetitions; TA=10’). Diffusion data were acquired using a PGSE-EPI sequence (4 b=0 and 3 b-shells b=0.8/1.3/2 ms/μm2 with 12/16/30 directions; δ/Δ=4/27ms; TE/TR=48/2500ms, 9 1-mm slices, FOV=23x17mm2, matrix=128x64). PET: List-mode data were acquired on a LabPET-4 small-animal scanner (Gamma Medica-Ideas Inc.) following tail vein delivery of 18FDG (~50MBq) in non-fasted rats. Data between 30 and 50 minutes post-injection were reconstructed and Standardized Uptake Value (SUV)-normalized to generate a steady-state image.Data processing for rs-fMRI included denoising5, distortion correction6, slice-timing correction, spatial smoothing7, and removal of physiological noise following independent component (IC) analysis decomposition8. FC matrices between 28 atlas-based ROIs were computed, co-varying for the global signal. Group differences at each timepoint were tested using non-parametric permutation tests (N=5000) with NBS9.
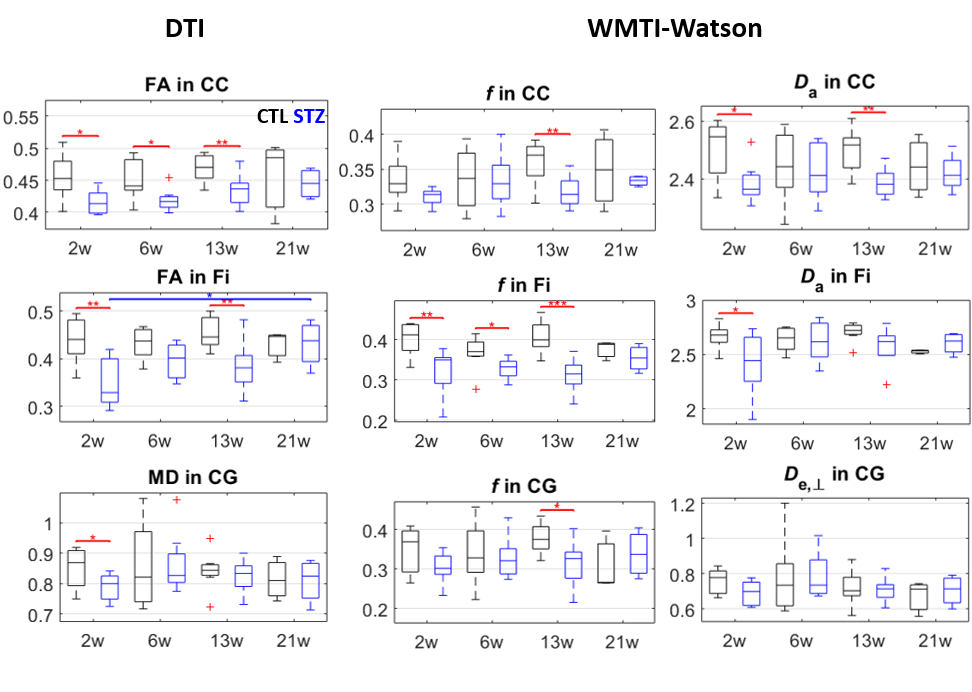
Diffusion MRI images were denoised10, Gibbs-ringing corrected11 and EDDY-corrected12. Diffusion and kurtosis tensors were calculated13 and the WMTI-Watson model14 was estimated in WM voxels. Corpus callosum, cingulum and fimbria were automatically segmented using atlas-based registration. Average diffusion metrics in each ROI were compared between CTL and STZ groups using two-tailed t-tests at each timepoint. Within-group longitudinal changes were assessed using one-way ANOVA and Tukey-Cramer correction.
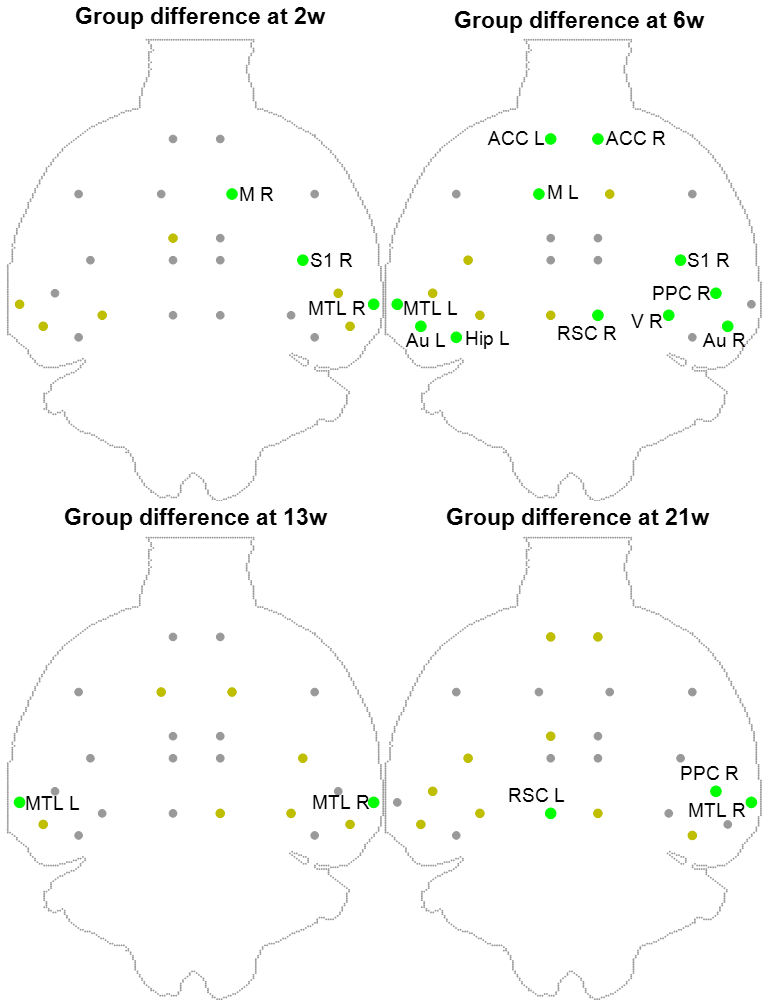
PET datasets were registered to their corresponding MRI anatomical image with cross-correlation15 using ANTs16 and 26 ROIs were segmented. SUV images were normalized to mean SUV over the brain to correct for inter-rat experimental variability17. Regional differences in SUV between STZ and CTL were evaluated using one-tailed t-test (STZ<CTL) at each timepoint.
Results
FC was affected in the STZ group at 2, 13 and 21 weeks, in different spatial patterns (Figure 2). Main hub at 2 and 13 weeks was ACC, with altered connections to regions involved in AD (RSC, PPC, Hip, Sub) but also to sensory and motor areas (Au, V, S1/S2) and striatum. The FC alteration at 21 weeks evolved towards the posterior and temporal brain regions, involving mainly RSC, PPC, MTL, Hip, V and Au, but also motor and somatosensory cortex. A non-monotonic trend with temporary recovery at 6 weeks was evident.WM degeneration was very marked in the corpus callosum and fimbria of the hippocampus, and more mildly in the cingulum (Figure 3). White matter modeling improved the characterization of the damage compared to DTI and suggested the most prominent on-going process was axonal injury followed by axonal loss. Non-monotonic trends with partial recovery at 6 weeks were also found.
FDG-PET highlighted reduced SUV in STZ rats, in a more stable pattern over time (Figure 4). Regions with reduced SUV broadly agreed with regions of altered FC: ACC, RSC, PPC, MTL, Hip, Au, V S1/S2 and M.
Discussion and Conclusions
FC was altered in STZ rats in varying spatio-temporal patterns, with early ACC involvement, temporary recovery at 6 weeks and later posterior/temporal involvement. WM degeneration agreed with changes in FC, with marked acute and chronic changes in corpus callosum, fimbria and cingulum at 2 and 13 weeks, and fewer differences at 6 weeks. FDG-PET showed impaired glucose uptake in icv-STZ rats in regions typically involved in AD, remarkably with most pronounced differences at 6 weeks. This suggests that the brain may solicit other forms of energy (e.g. ketone bodies18) to compensate for the lack of glucose and restore normal FC past the acute phase, which is consistent with reduced body weight in STZ vs CTL rats (~100g difference). In the chronic phase, neurodegeneration resumes. The succession of acute change, remission and chronic degeneration has also been reported in memory performance of icv-STZ rats2, as well as in dynamics of several biomarkers of AD19,20. MRI-derived biomarkers of FC and WM degeneration in animal models of brain insulin resistance have therefore great potential for the investigation of neurodegeneration in the context of AD and diabetes.Acknowledgements
The authors thank Mario Lepore and Stefan Mitrea for assistance with animal setup and monitoring. This work was supported by the Centred'Imagerie BioMedicale (CIBM) of the University of Lausanne, the Swiss Federal Institute of Technology Lausanne, the University of Geneva, the CentreHospitalier Universitaire Vaudois and the Hôpitaux Universitaires de Genève.References
1. Talbot, K. et al. Demonstrated brain insulin resistance in Alzheimer’s disease patients is associated with IGF-1 resistance, IRS-1 dysregulation, and cognitive decline. J. Clin. Invest. 122, 1316–1338 (2012).
2. Knezovic, A. et al. Staging of cognitive deficits and neuropathological and ultrastructural changes in streptozotocin-induced rat model of Alzheimer’s disease. J. Neural Transm. Vienna Austria 1996 122, 577–592 (2015).
3. Kraska, A. et al. In vivo cross-sectional characterization of cerebral alterations induced by intracerebroventricular administration of streptozotocin. PloS One 7, e46196 (2012).
4. Shoham, S., Bejar, C., Kovalev, E. & Weinstock, M. Intracerebroventricular injection of streptozotocin causes neurotoxicity to myelin that contributes to spatial memory deficits in rats. Exp. Neurol. 184, 1043–1052 (2003).
5. Veraart, J. et al. Denoising of diffusion MRI using random matrix theory. NeuroImage 142, 394–406 (2016).
6. Smith, S. M. et al. Advances in functional and structural MR image analysis and implementation as FSL. NeuroImage 23 Suppl 1, S208-219 (2004).
7. Friston, K. J., Ashburner, J., Kiebel, S. J., Nichols, T. E. & Penny, W. D. Statistical Parametric Mapping. in (2007).
8. Griffanti, L. et al. Hand classification of fMRI ICA noise components. NeuroImage 154, 188–205 (2017).
9. Zalesky, A., Fornito, A. & Bullmore, E. T. Network-based statistic: Identifying differences in brain networks. NeuroImage 53, 1197–1207 (2010).
10. Veraart, J., Fieremans, E. & Novikov, D. S. Diffusion MRI noise mapping using random matrix theory: Diffusion MRI Noise Mapping. Magn. Reson. Med. 76, 1582–1593 (2016).
11. Kellner, E., Dhital, B., Kiselev, V. G. & Reisert, M. Gibbs-ringing artifact removal based on local subvoxel-shifts. Magn. Reson. Med. 76, 1574–1581 (2016).
12. Andersson, J. L. R. & Sotiropoulos, S. N. An integrated approach to correction for off-resonance effects and subject movement in diffusion MR imaging. NeuroImage 125, 1063–1078 (2016).
13. Veraart, J., Sijbers, J., Sunaert, S., Leemans, A. & Jeurissen, B. Weighted linear least squares estimation of diffusion MRI parameters: Strengths, limitations, and pitfalls. NeuroImage 81, 335–346 (2013).
14. Jespersen, S. N., Olesen, J. L., Hansen, B. & Shemesh, N. Diffusion time dependence of microstructural parameters in fixed spinal cord. NeuroImage 182, 329–342 (2018).
15. Avants, B. B., Epstein, C. L., Grossman, M. & Gee, J. C. Symmetric diffeomorphic image registration with cross-correlation: Evaluating automated labeling of elderly and neurodegenerative brain. Med. Image Anal. 12, 26–41 (2008).
16. Avants, B. B., Tustison, N. & Song, G. Advanced Normalization Tools (ANTS). (2011).
17. Heo, J.-H. et al. Spatial Distribution of Glucose Hypometabolism Induced by Intracerebroventricular Streptozotocin in Monkeys. J. Alzheimers Dis. 25, 517–523 (2011).
18. Gano, L. B., Patel, M. & Rho, J. M. Ketogenic diets, mitochondria, and neurological diseases. J. Lipid Res. 55, 2211–2228 (2014).
19. Sierra-Marcos, A. Regional Cerebral Blood Flow in Mild Cognitive Impairment and Alzheimer’s Disease Measured with Arterial Spin Labeling Magnetic Resonance Imaging. International Journal of Alzheimer’s Disease (2017).
20. Pegueroles, J. et al. Longitudinal brain structural changes in preclinical Alzheimer’s disease. Alzheimers Dement. 13, 499–509 (2017).
Figures