0208
QUANTITATIVE SUSCEPTIBILITY MAPPING AS A DIAGNOSTIC TOOL TO DISTINGUISH TREMOR DOMINANT PD FROM ESSENTIAL TREMOR.1Neuroimaging and Interventional Radiology, National Institute of Mental Health and Neurosciences, Bangalore, India, 2Philips India, Bangalore, India, 3Clinical neurosciences, National Institute of Mental Health and Neurosciences, Bangalore, India, 4Neurology, National Institute of Mental Health and Neurosciences, bangalore, India
Synopsis
Tremor dominant PD and ET often pose a diagnostic difficulty in view of overlapping clinical features. We aimed at distinguishing the two using the novel technique of QSM to measure iron deposition in various gray matter nuclei including the substantia nigra pars compacta(SNPc). A statistically significant difference was seen in the QSM values of the SNPc, SNPr and caudate nucleus. ROC curve analysis showed a sensitivity and specificity of 90 and 87.5% respectively using a cut off value of 12 ppb for the SNPc. Thus, QSM is a potentially useful problem solving technique for distinguishing tremor dominant PD from ET.
INTRODUCTION
Parkinson Disease (PD) and Essential Tremor (ET) are among the most common neurodegenerative movement disorders affecting the aging population. Tremor is a cardinal manifestation of both the disease entities. The diagnosis, till date, is based on clinical criteria. Although ET is characterized by action tremor and rest tremor is a feature of PD, there can be a significant overlap in the tremor characteristics leading to a diagnostic dilemma1 . This is especially true of tremor dominant PD in which tremor is the predominant symptom with minimal akinesia and rigidity. Also, ET plus syndromes can have other motor and non-motor manifestations2. Currently, there are no robust imaging methods to distinguish tremor dominant PD from ET. Recent studies have pointed to the potential of neuromelanin based contrast in differentiating PD from ET.3 Given the effect that neuromelanin and tissue iron have on MRI signal in the brain on gradient echo imaging4 and the relation between iron deposition and neurodegeneration5, in this study, we evaluated the role of Quantitative Susceptibility Mapping (QSM) as a possible diagnostic tool to distinguish tremor dominant PD from ET. QSM evaluates the source magnetic susceptibility of the tissue that leads to phase contrast and T2* contrast.METHODS
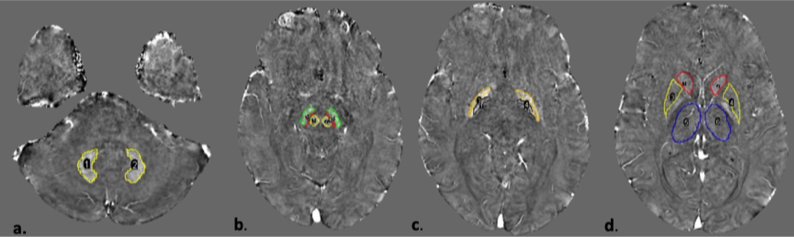
Twenty five (25) patients of tremor dominant PD and 10 patients of ET were recruited based on previously described clinical criteria 6-8. After obtaining informed consent, all subjects underwent MRI in a 3 Tesla Philips Ingenia scanner and multi echo susceptibility weighted imaging (SWI) data were acquired. Imaging parameters - #echoes=4, minimum TE=7.2msec, echo spacing=6.2 msec, TR-31 msec, flip angle= 17 degree, voxel size= 0.6x0.6x2mm, FOV=23 cm. QSM maps were calculated using Meineke et al’s method9 . Multiecho SWIp data was utilized for generating the field map which was then used as input into a regularized de-convolution algorithm for generating the susceptibility map. Manual ROIs were drawn by a neuroradiologist for bilateral dentate, red nuclei, substantia nigra pars compacta (SNPc), substantia nigra pars reticulata (SNPr), globus pallidus interna (GPi), externa (GPe), caudate, putamina and thalami using Image J as described in a previous study 10(Figure 1). Continuous variables were expressed as mean with standard deviation. QSM values between the two groups were compared using the Mann Whitney U test. A p value of <.05 was regarded as significant. Receiver operating characteristic curve analysis was performed for the SNPc, SNpr and caudate nucleus.RESULTS
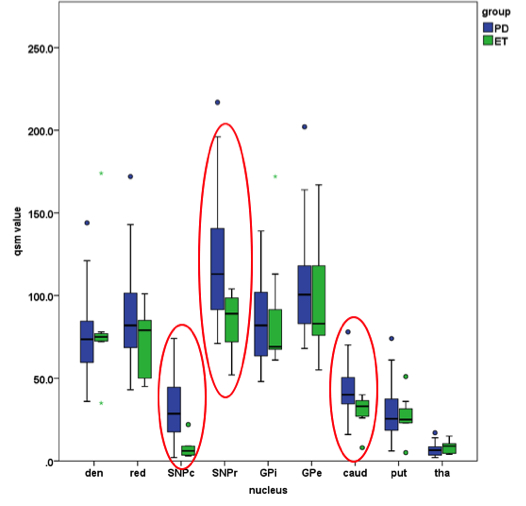
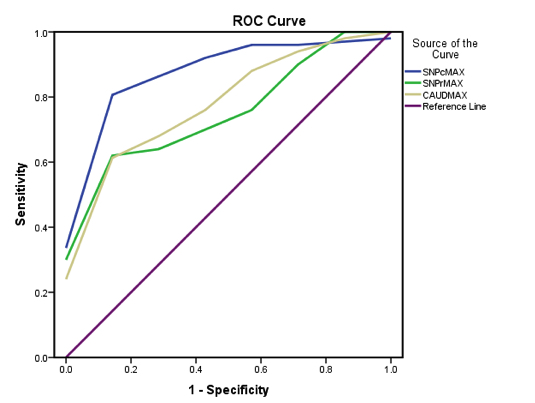
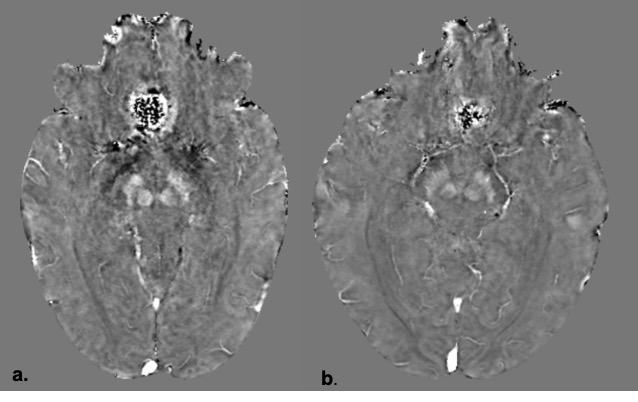
The mean QSM values in parts per billion (ppb) for the SNPc, SNPr and caudate nucleus were 33±17, 121±35, 44±14ppb respectively for tremor dominant PD and 8±6, 84±20, 29±10ppb respectively for ET. There was a significant difference in the QSM values for SNPc, SNPr and caudate nucleus between the two groups with p values of <.001, .026 and .015 respectively. Figure 2 summarises these findings. ROC curve analysis (Figure 3) revealed area under the curve of .906, .800 and .774 for the SNPc, caudate and SNPr respectively. Using cut off values of 12ppb for the SNPc achieved a sensitivity of 90% and specificity of 85.7% in distinguishing tremor dominant PD from ET. Sensitivity and specificity of 80 and 57% respectively were seen by setting a cut off value of 34ppb for the caudate and 72% and 57% respectively for the SNPr using a cut off value of 92ppb. Representative QSM maps for each group are shown in Figure 4.DISCUSSION
This study showed that there is a significant difference in the QSM values of the SNPc and caudate nucleus between tremor dominant PD and ET. Our findings are consistent with the basic pathophysiology of PD which involves a loss of dopaminergic neurons in the substantia nigra pars compacta. The globus pallidus interna and cerebello-thalamo-cortical loop is proposed to be involved in essential tremor, although no significant difference was seen on QSM 1. There is plausible evidence to show that iron deposition may be a primary phenomena in the causation of PD rather than a secondary neurodegenerative process 11. Compared to PD, GABAergic dysfunction is proposed to play a role in the pathophysiology of ET1. Another significant finding in our study was increased iron deposition in the caudate nucleus in tremor dominant PD. There is extensive evidence for the hypothesis that the pacemaker for parkinsonian tremor is located in the striatum 1,12. Earlier studies have shown that increased relaxometry values in the basal ganglia especially the caudate, putamen and thalamus correlate with the tremor dominant phenotype of PD 13, which is in agreement with our results. Our study has limitations in the sense that it was a hospital based study with a small sample size. Studies with a larger sample size are required to further validate our findings. However, this study has demonstrated the feasibility of using QSM for future research in this direction.CONCLUSION
The results of our study show that QSM could be a useful diagnostic tool for distinguishing tremor dominant PD from ET. QSM maps can easily be obtained from multi echo susceptibility weighted sequences without the hassle of contrast administration, patient preparation, radiation and cost issues related to molecular imaging. It has the potential to serve as a problem solving tool for the movement disorder specialist.Acknowledgements
No acknowledgement found.References
1. Helmich RC, Toni I, Deuschl G, Bloem BR. The pathophysiology of essential tremor and parkinson’s tremor. Current Neurology and Neuroscience Reports. 2013;13(9).
2. Deuschl G, Bain P, Brin M. Consensus Statement of the Movement Disorder Society on Tremor. Movement Disorders. 2008 Oct 20;13(S3):2–23.
3. Wang J, Huang Z, Li Y, Ye F, Wang C, Zhang Y, et al. Neuromelanin-sensitive MRI of the substantia nigra: An imaging biomarker to differentiate essential tremor from tremor-dominant Parkinson’s disease. Parkinsonism and Related Disorders. 2019 Jan 1;58:3–8.
4. Lee JH, Baek SY, Song Y, Lim S, Lee H, Nguyen MP, Kim EJ, Huh GY, Chun SY, Cho H. The Neuromelanin-related T2* Contrast in Postmortem Human Substantia Nigra with 7T MRI. Sci Rep. 2016 Sep 6;6:32647.
5. Lian TH, Guo P, Zuo LJ, Hu Y, Yu SY, Yu QJ, Jin Z, Wang RD, Li LX, Zhang W. Tremor-Dominant in Parkinson Disease: The Relevance to Iron Metabolism and Inflammation. Front Neurosci. 2019 Mar 27;13:255.
6. Marsili L, Rizzo G, Colosimo C. Diagnostic criteria for Parkinson’s disease: From James Parkinson to the concept of prodromal disease. Vol. 9, Frontiers in Neurology. Frontiers Media S.A.; 2018.
7. Korchounov A, Schipper HI, Preobrazhenskaya IS, Kessler KR, Yakhno NN. Differences in age at onset and familial aggregation between clinical types of Idiopathic Parkinson’s disease. Movement Disorders. 2004 Sep;19(9):1059–64.
8. Bhatia KP, Bain P, Bajaj N, Elble RJ, Hallett M, Louis ED, et al. Consensus Statement on the classification of tremors. from the task force on tremor of the International Parkinson and Movement Disorder Society. Movement Disorders. 2018 Jan 1;33(1):75–87.
9. Meineke, J., Wenzel, F., Wilkinson, I. & Katscher, U. No significant increase of magnetic susceptibility found in subcortical gray matter of patients with Alzheimer’s Disease. in ISMRM 25th Annual Meeting, Honolulu, HI #2348 (2017).
10. Guan X, Xuan M, Gu Q, Huang P, Liu C, Wang N, et al. Regionally progressive accumulation of iron in Parkinson’s disease as measured by quantitative susceptibility mapping. NMR in Biomedicine. 2017 Apr 1;30(4).
11. Brass SD, Chen NK, Mulkern R v., Bakshi R. Magnetic resonance imaging of iron deposition in neurological disorders. Topics in Magnetic Resonance Imaging. 2006 Feb;17(1):31–40.
12. Dovzhenok A, Rubchinsky LL. On the origin of tremor in Parkinson’s disease. PloS one. 2012 Jul 27;7(7):e41598.
13. Bunzeck N, Singh-Curry V, Eckart C, Weiskopf N, Perry RJ, Bain PG, et al. Motor phenotype and magnetic resonance measures of basal ganglia iron levels in Parkinson’s disease. Parkinsonism and Related Disorders. 2013 Dec;19(12):1136–42.
Figures