0207
Dopaminergic premotor and motor pathways are dominant in the progression of motor disability in Parkinson’s disease1Department of Diagnostic Radiology, Singapore General Hospital, Singapore, Singapore, 2Department of Neurology, National Neuroscience Institute – SGH Campus, Singapore, Singapore, 3Duke-NUS Medical School, Singapore, Singapore, 4Department of Ophthalmology, Yong Loo Lin School of Medicine, National University of Singapore, Singapore, Singapore
Synopsis
White matter microstructural changes in relation to the neurotransmitter systems in Parkinson’s disease (PD) progression remains unclear. We used diffusion spectrum imaging and local connectome fingerprint analysis to investigate microstructural integrity of the the premotor and motor pathways in associations with various neurotransmitter systems in the brainstem, and disease duration and severity of motor-related symptoms. We found greater microstructural changes in the dopaminergic pathways in association with motor progression than for the other neurochemical pathways. Patients with longer disease duration or more severe motor dysfunctions showed increased anisotropic water diffusion in these pathways, suggesting a compensatory effect of axonal sprouting.
Introduction
Parkinson’s disease (PD) is mainly characterized by dopaminergic neurodegeneration in the substantia nigra pars compacta (SNc) and nigrostriatal pathway, leading to motor-related symptoms.1,2 Neuropathological and molecular imaging studies suggested that PD progression with Lewy body pathology and abnormal neurotransmitter binding started from the dorsal raphe nuclei (DR) of the serotoninergic neurotransmitter system at the early premotor stage, and spread to other brain areas involved in multiple neurotransmitter systems at the later motor stage.3,4,5 These findings are in concordance to the Braak stages of PD progression3 which proposed that the serotoninergic deficits might occur before the presence of dopaminergic deficits.5 However, to date, few studies investigate the microstructural changes of white matter (WM) tracts at the neurotransmitter system level with respect to PD progression. Therefore, we performed diffusion spectrum imaging (DSI) and local connectome fingerprint analysis to measure microstructural properties along premotor and motor pathways in the dopaminergic and serotoninergic/cholinergic systems, and aimed to investigate their associations with clinical variables in patients with PD, viz disease duration and severity of motor symptoms quantified by the Unified Parkinson's Disease Rating Scale (UPDRS III). We hypothesized that these clinical variables, being traditionally biased towards motor aspects of the disease, were more strongly correlated with the dopaminergic premotor and motor pathways than the serotoninergic/cholinergic pathways, but nevertheless reflect brain topological progression in the cortical-striatal-brainstem WM structures that fits the Braak staging in PD.Methods
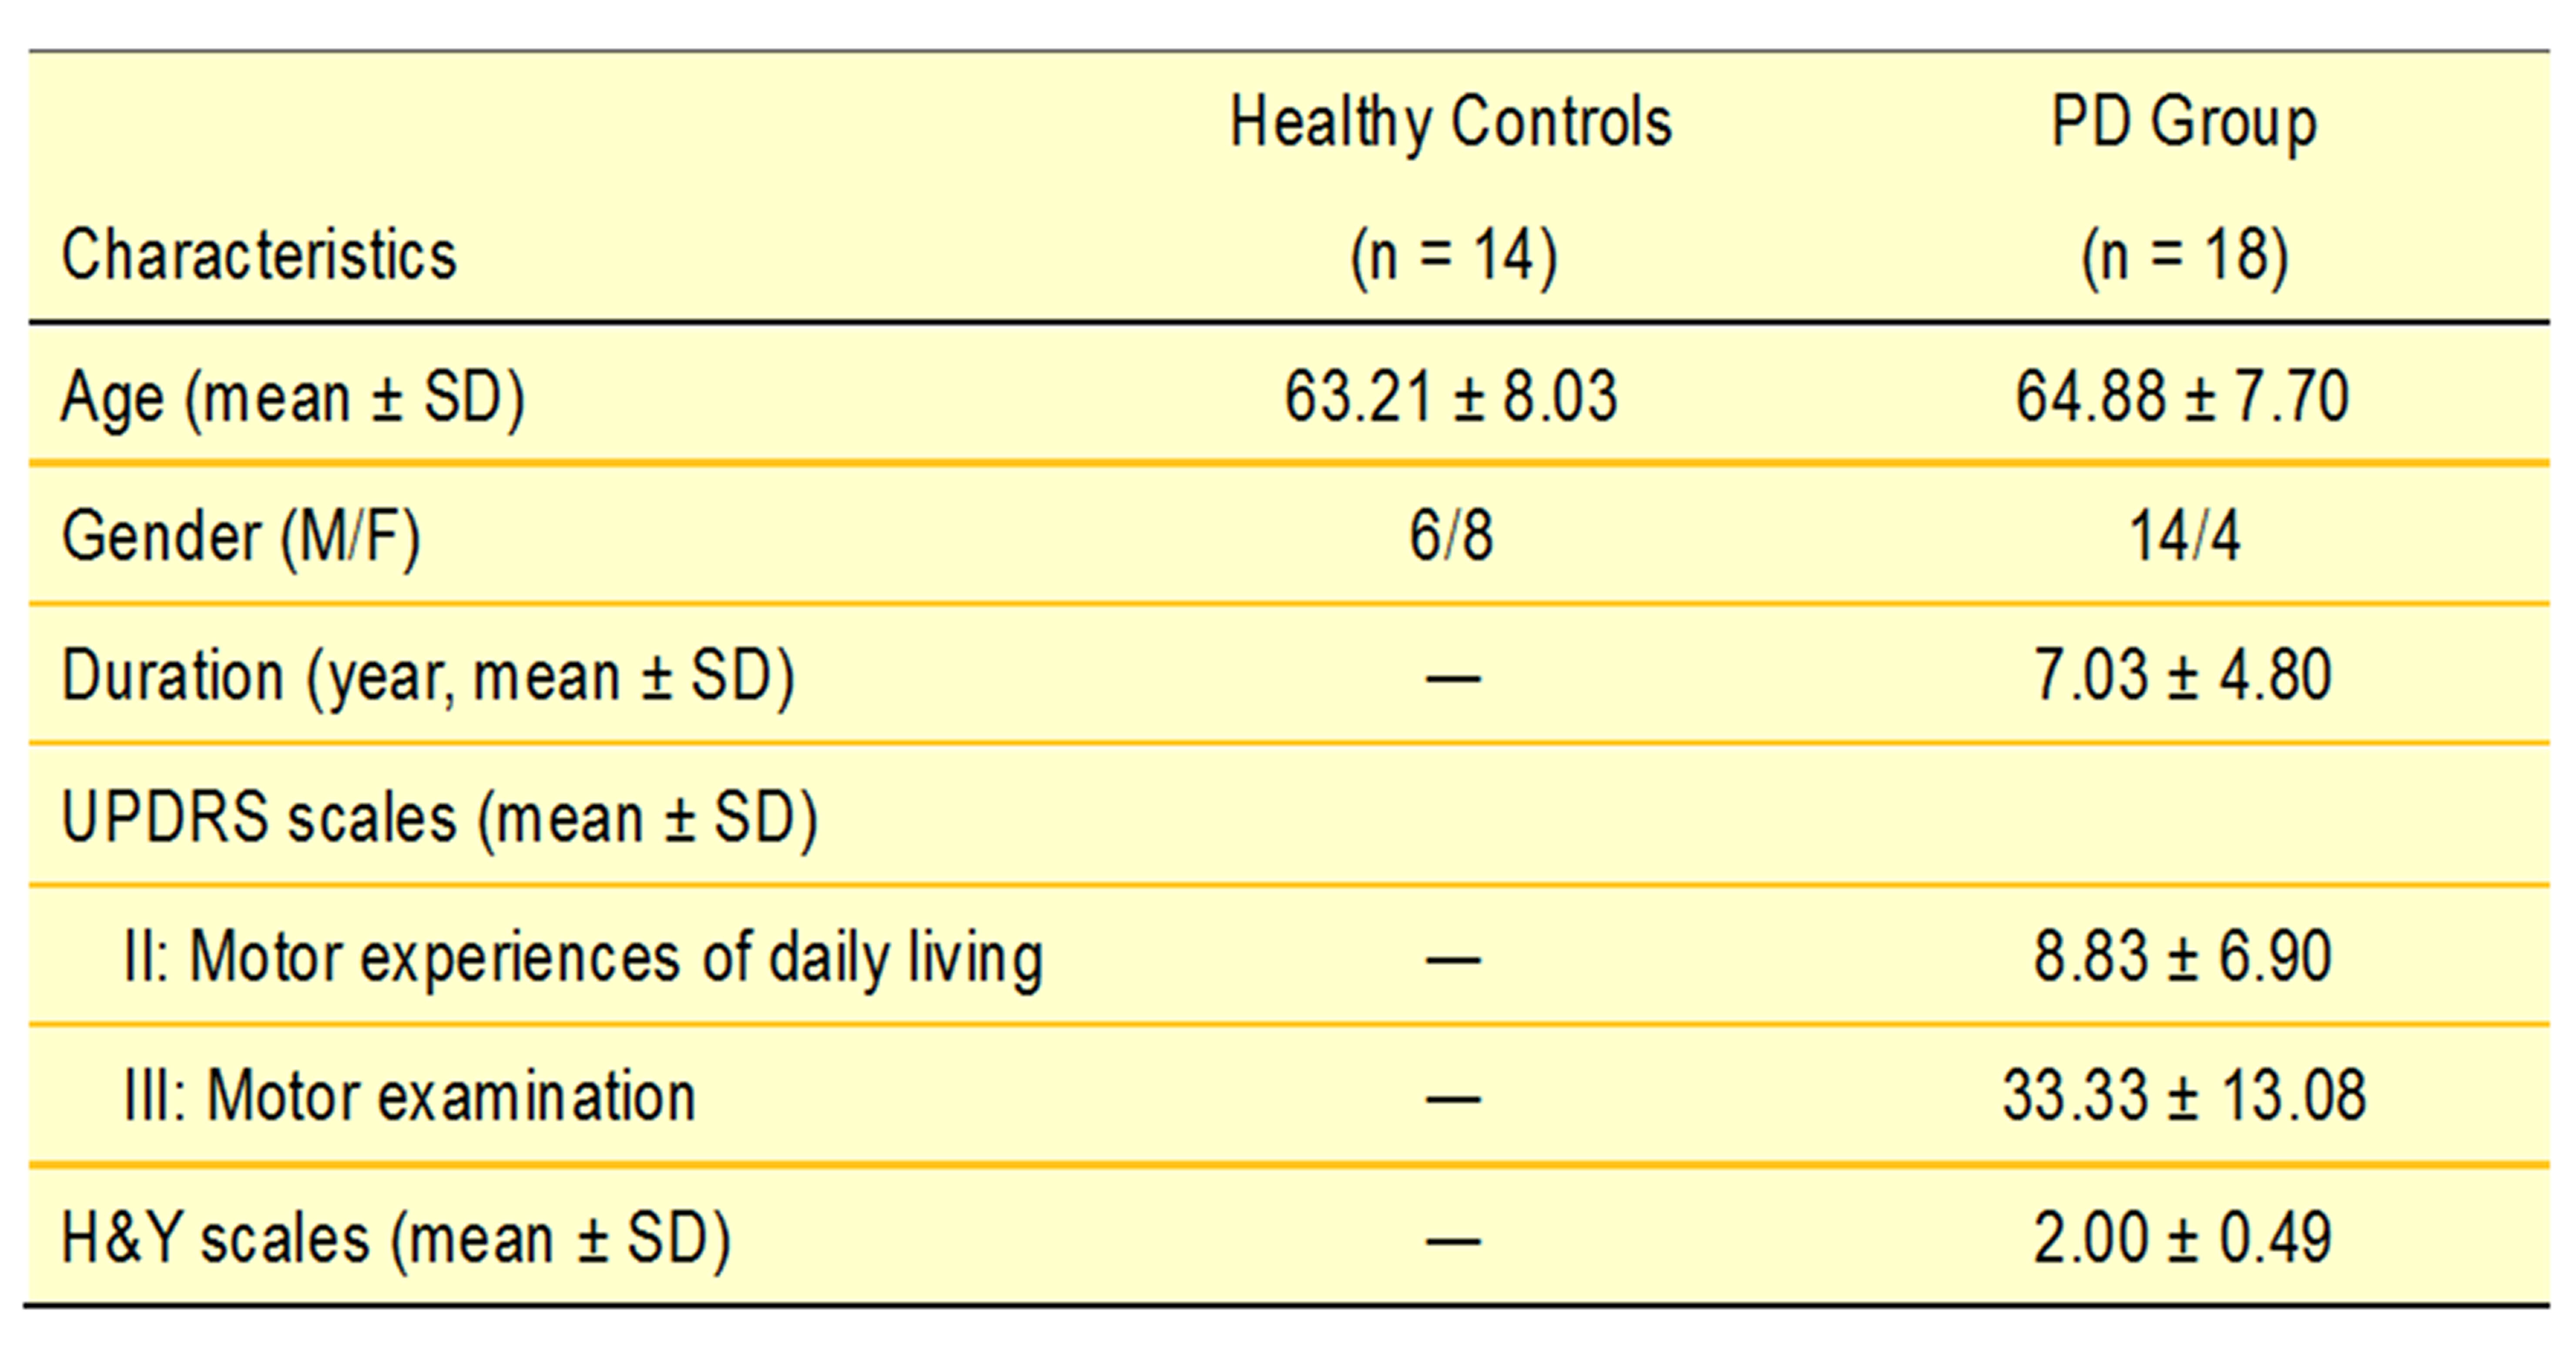
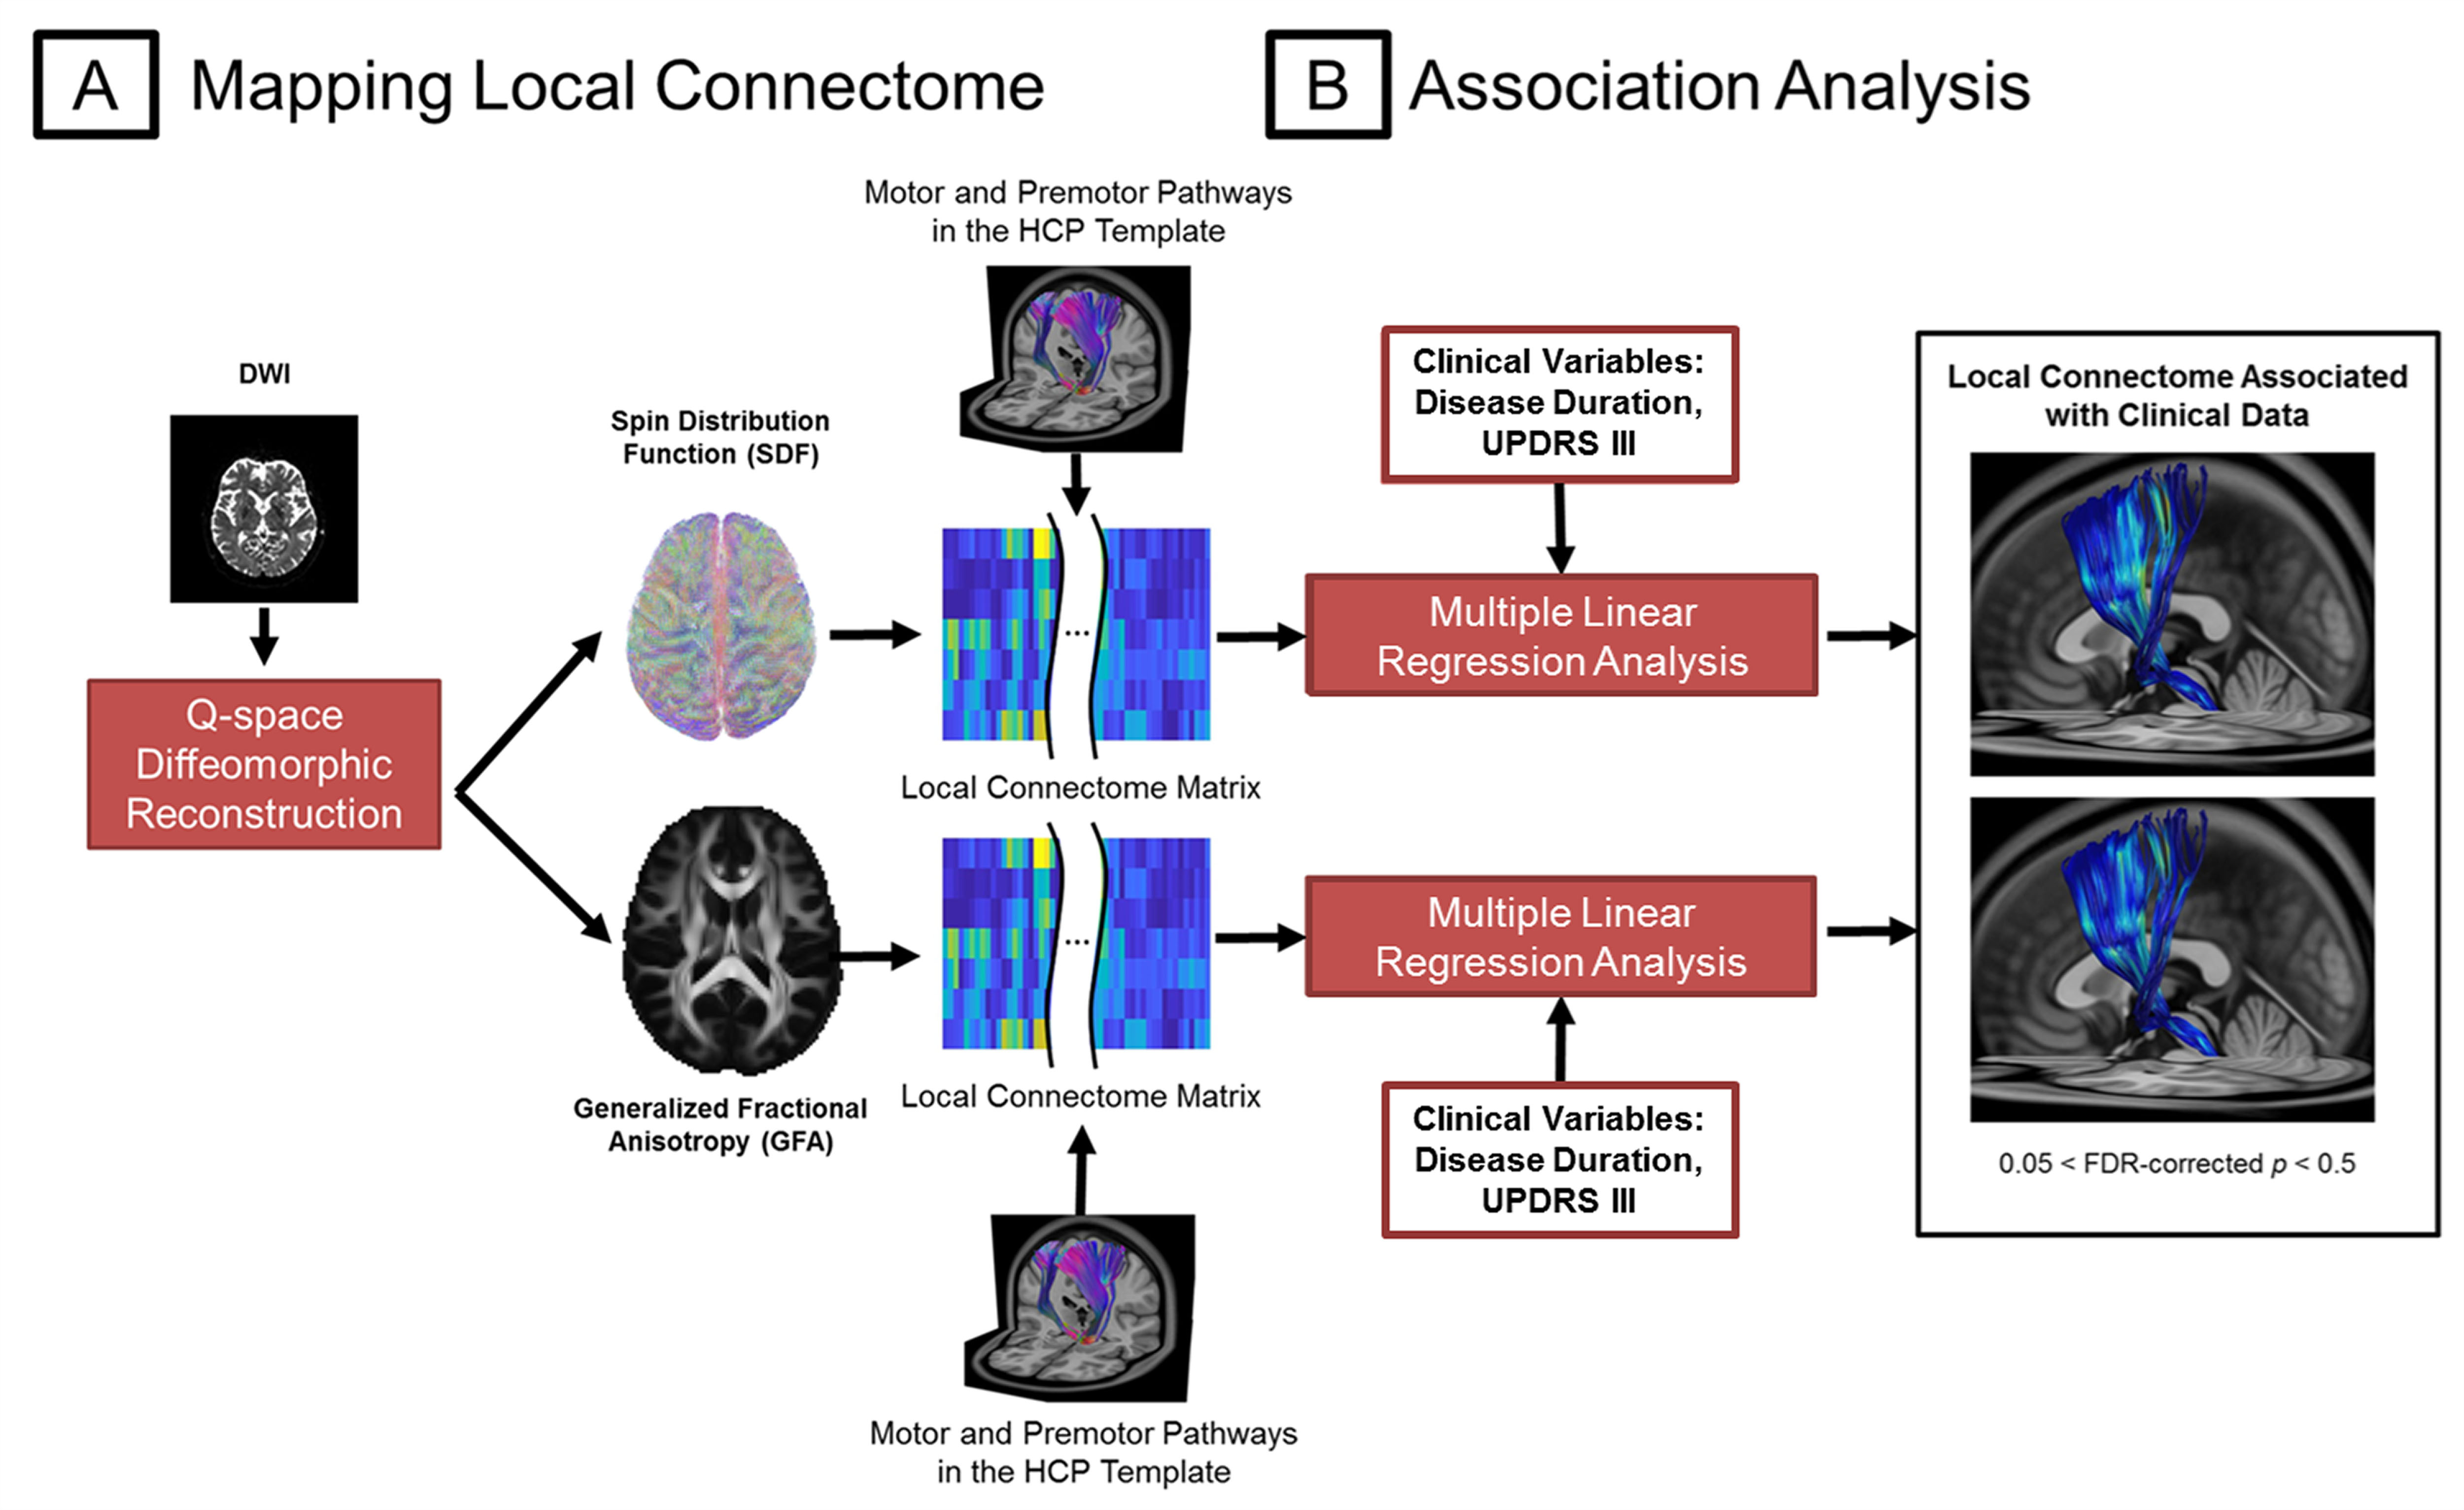
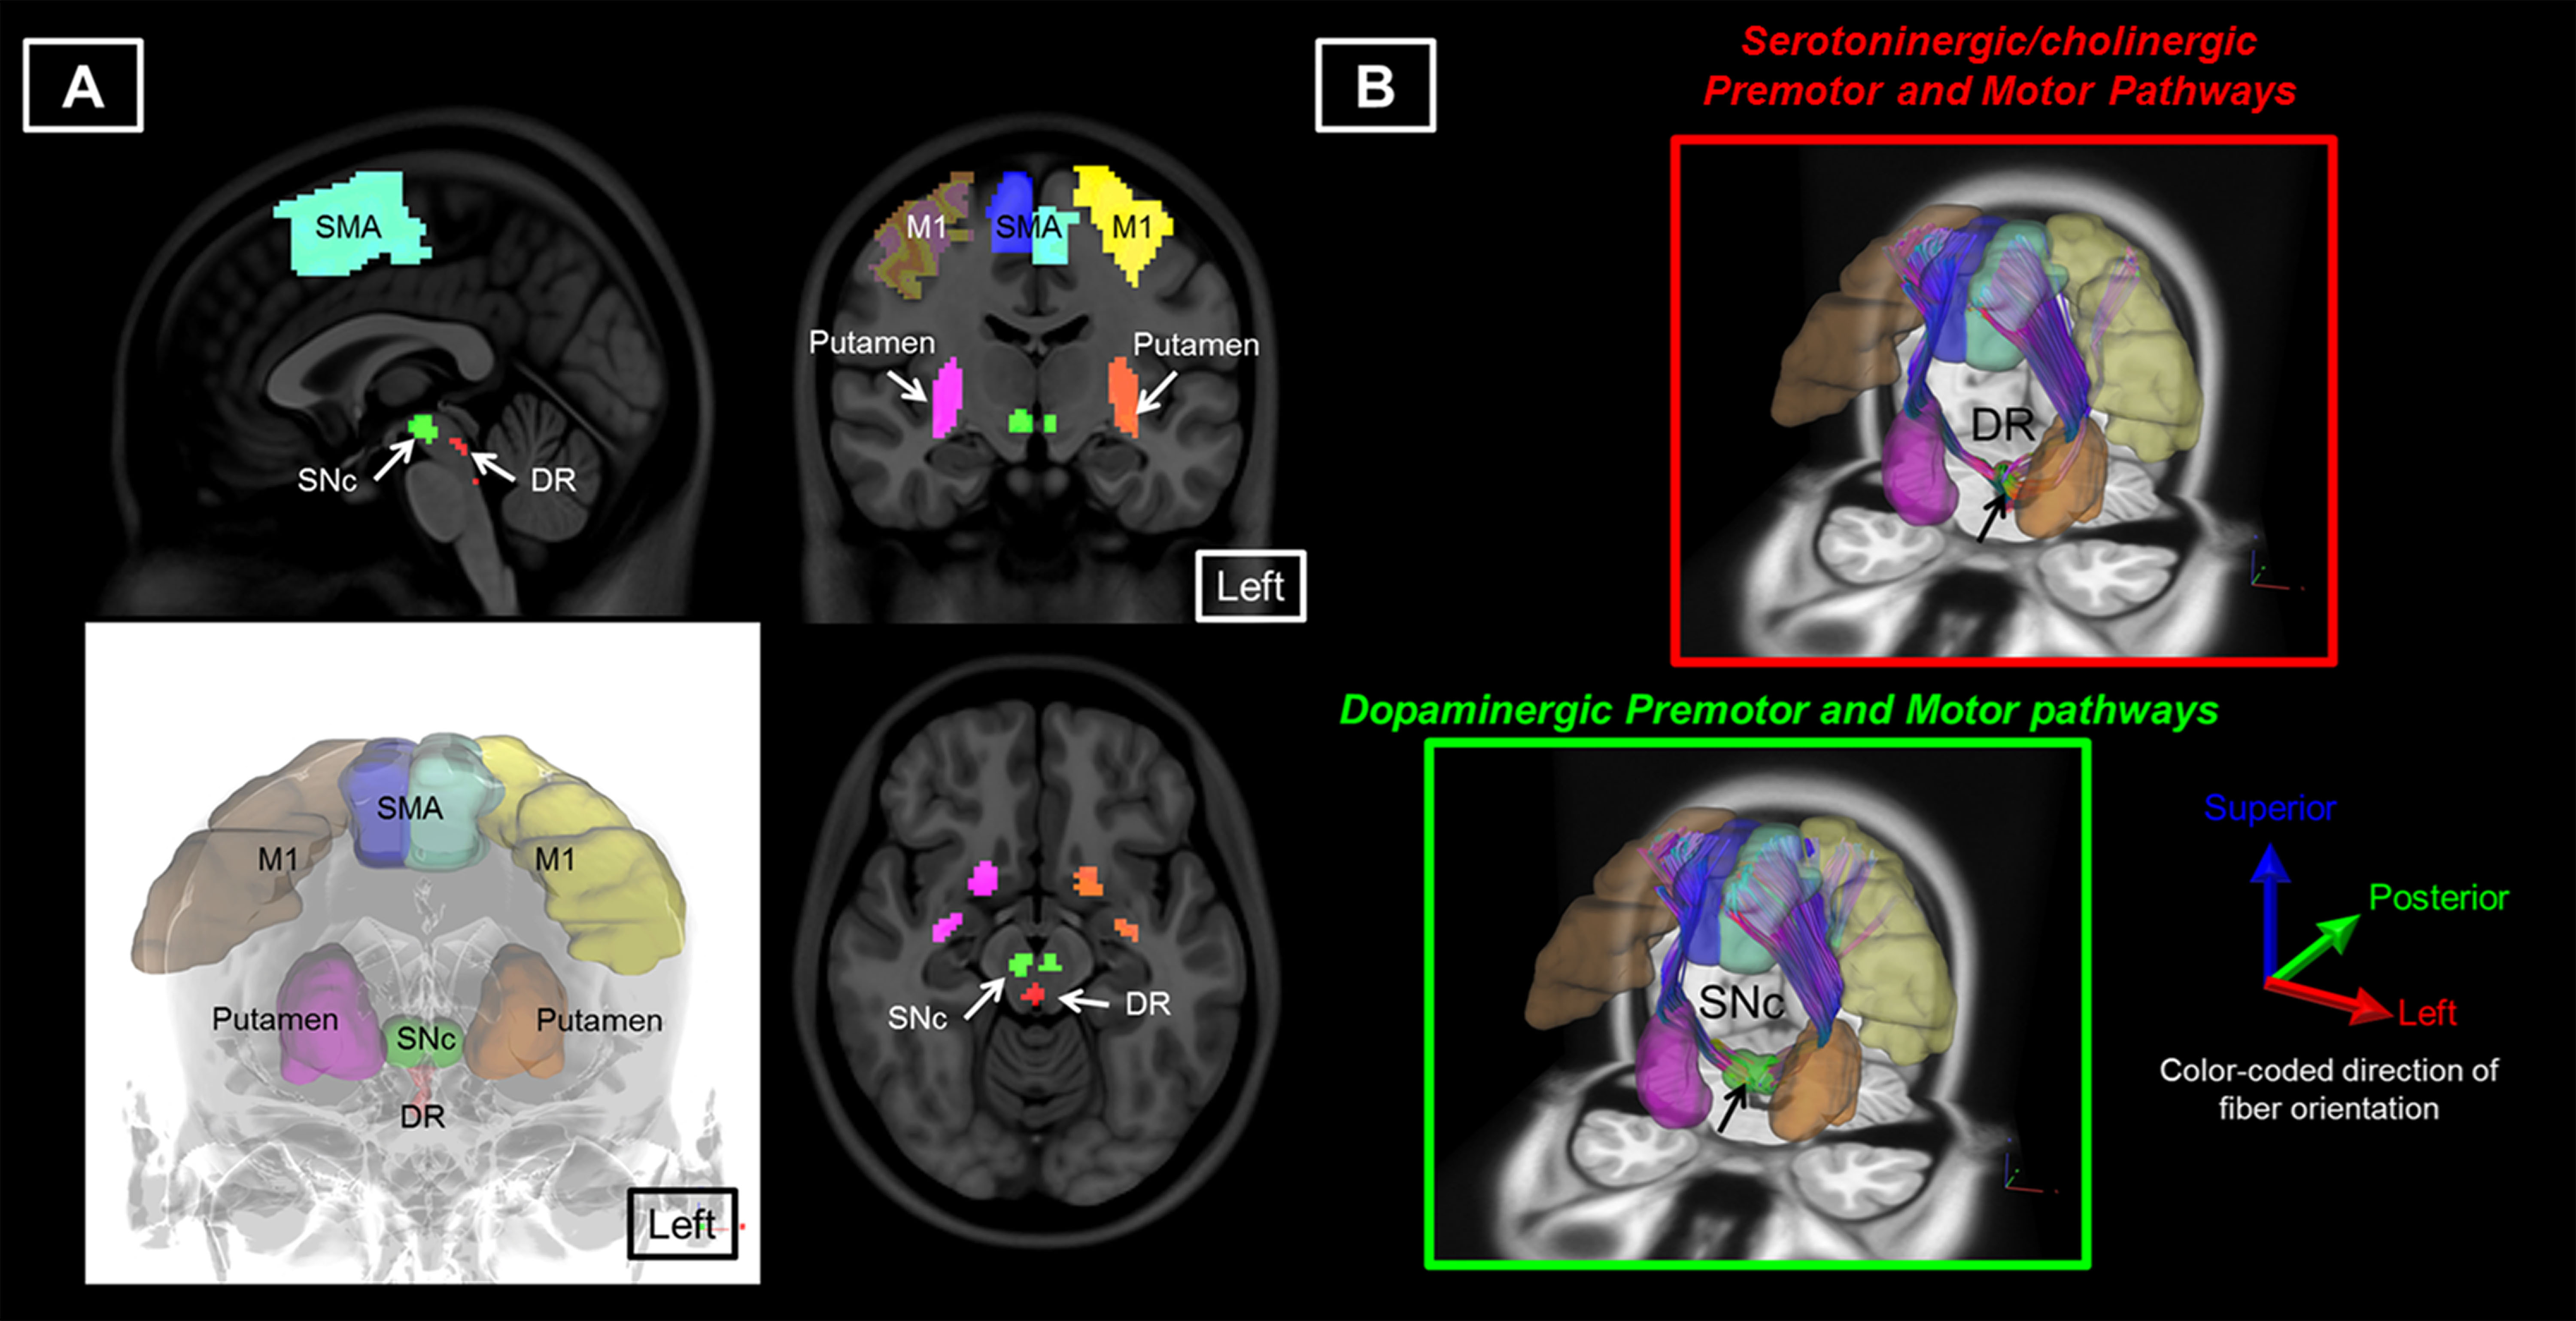
18 patients with PD and 14 age-matched healthy controls (HC) were included in this study (Table 1). The DSI acquisition was performed on a 3-Tesla MRI scanner (Siemens, Skyra) using a 2-dimensional spin-echo echo-planar-imaging sequence with simultaneous-multislice factor 3 (TR/TE = 4100/110 ms, flip angle = 90°, voxel size = 2 x 2 x 2 mm3, matrix size = 200 x 200, number of slices = 81). A total of 128 diffusion samplings were acquired. DSI data was reconstructed, and normalized to the human-connectome-project (HCP) 1021 diffusion template in the MNI space using q-space diffeomorphic reconstruction6 to obtain diffusion indices of spin distribution function7 (SDF) and generalized fractional anisotropy (GFA) for each individual. We performed the local connectome fingerprint analysis8 to extract local connectome SDF and GFA values along fiber tracts (Fig 1A), where deterministic fiber tracking for premotor and motor pathways in two neurotransmitter systems was conducted in the HCP 1021 diffusion template (Fig 2). Finally, we separately performed the connectometry analysis and partial-Spearman correlation analysis to evaluate associations between the local connectome values of fiber pathways and clinical variables. Connectometry analysis9 based on voxel-wise multiple linear regression model was applied to identify subcomponents of the major premotor and motor WM pathways that associated with the clinical variables of interest (Fig 1B). The regressors included confounding factors of gender, age, and age^2 in 18 PD patients. Partial-Spearman correlation analysis controlling for the above confounding factors was used to assess the relationships between the mean local connectome values of WM pathways and clinical variables to confirm the results of the connectometry analysis.Results
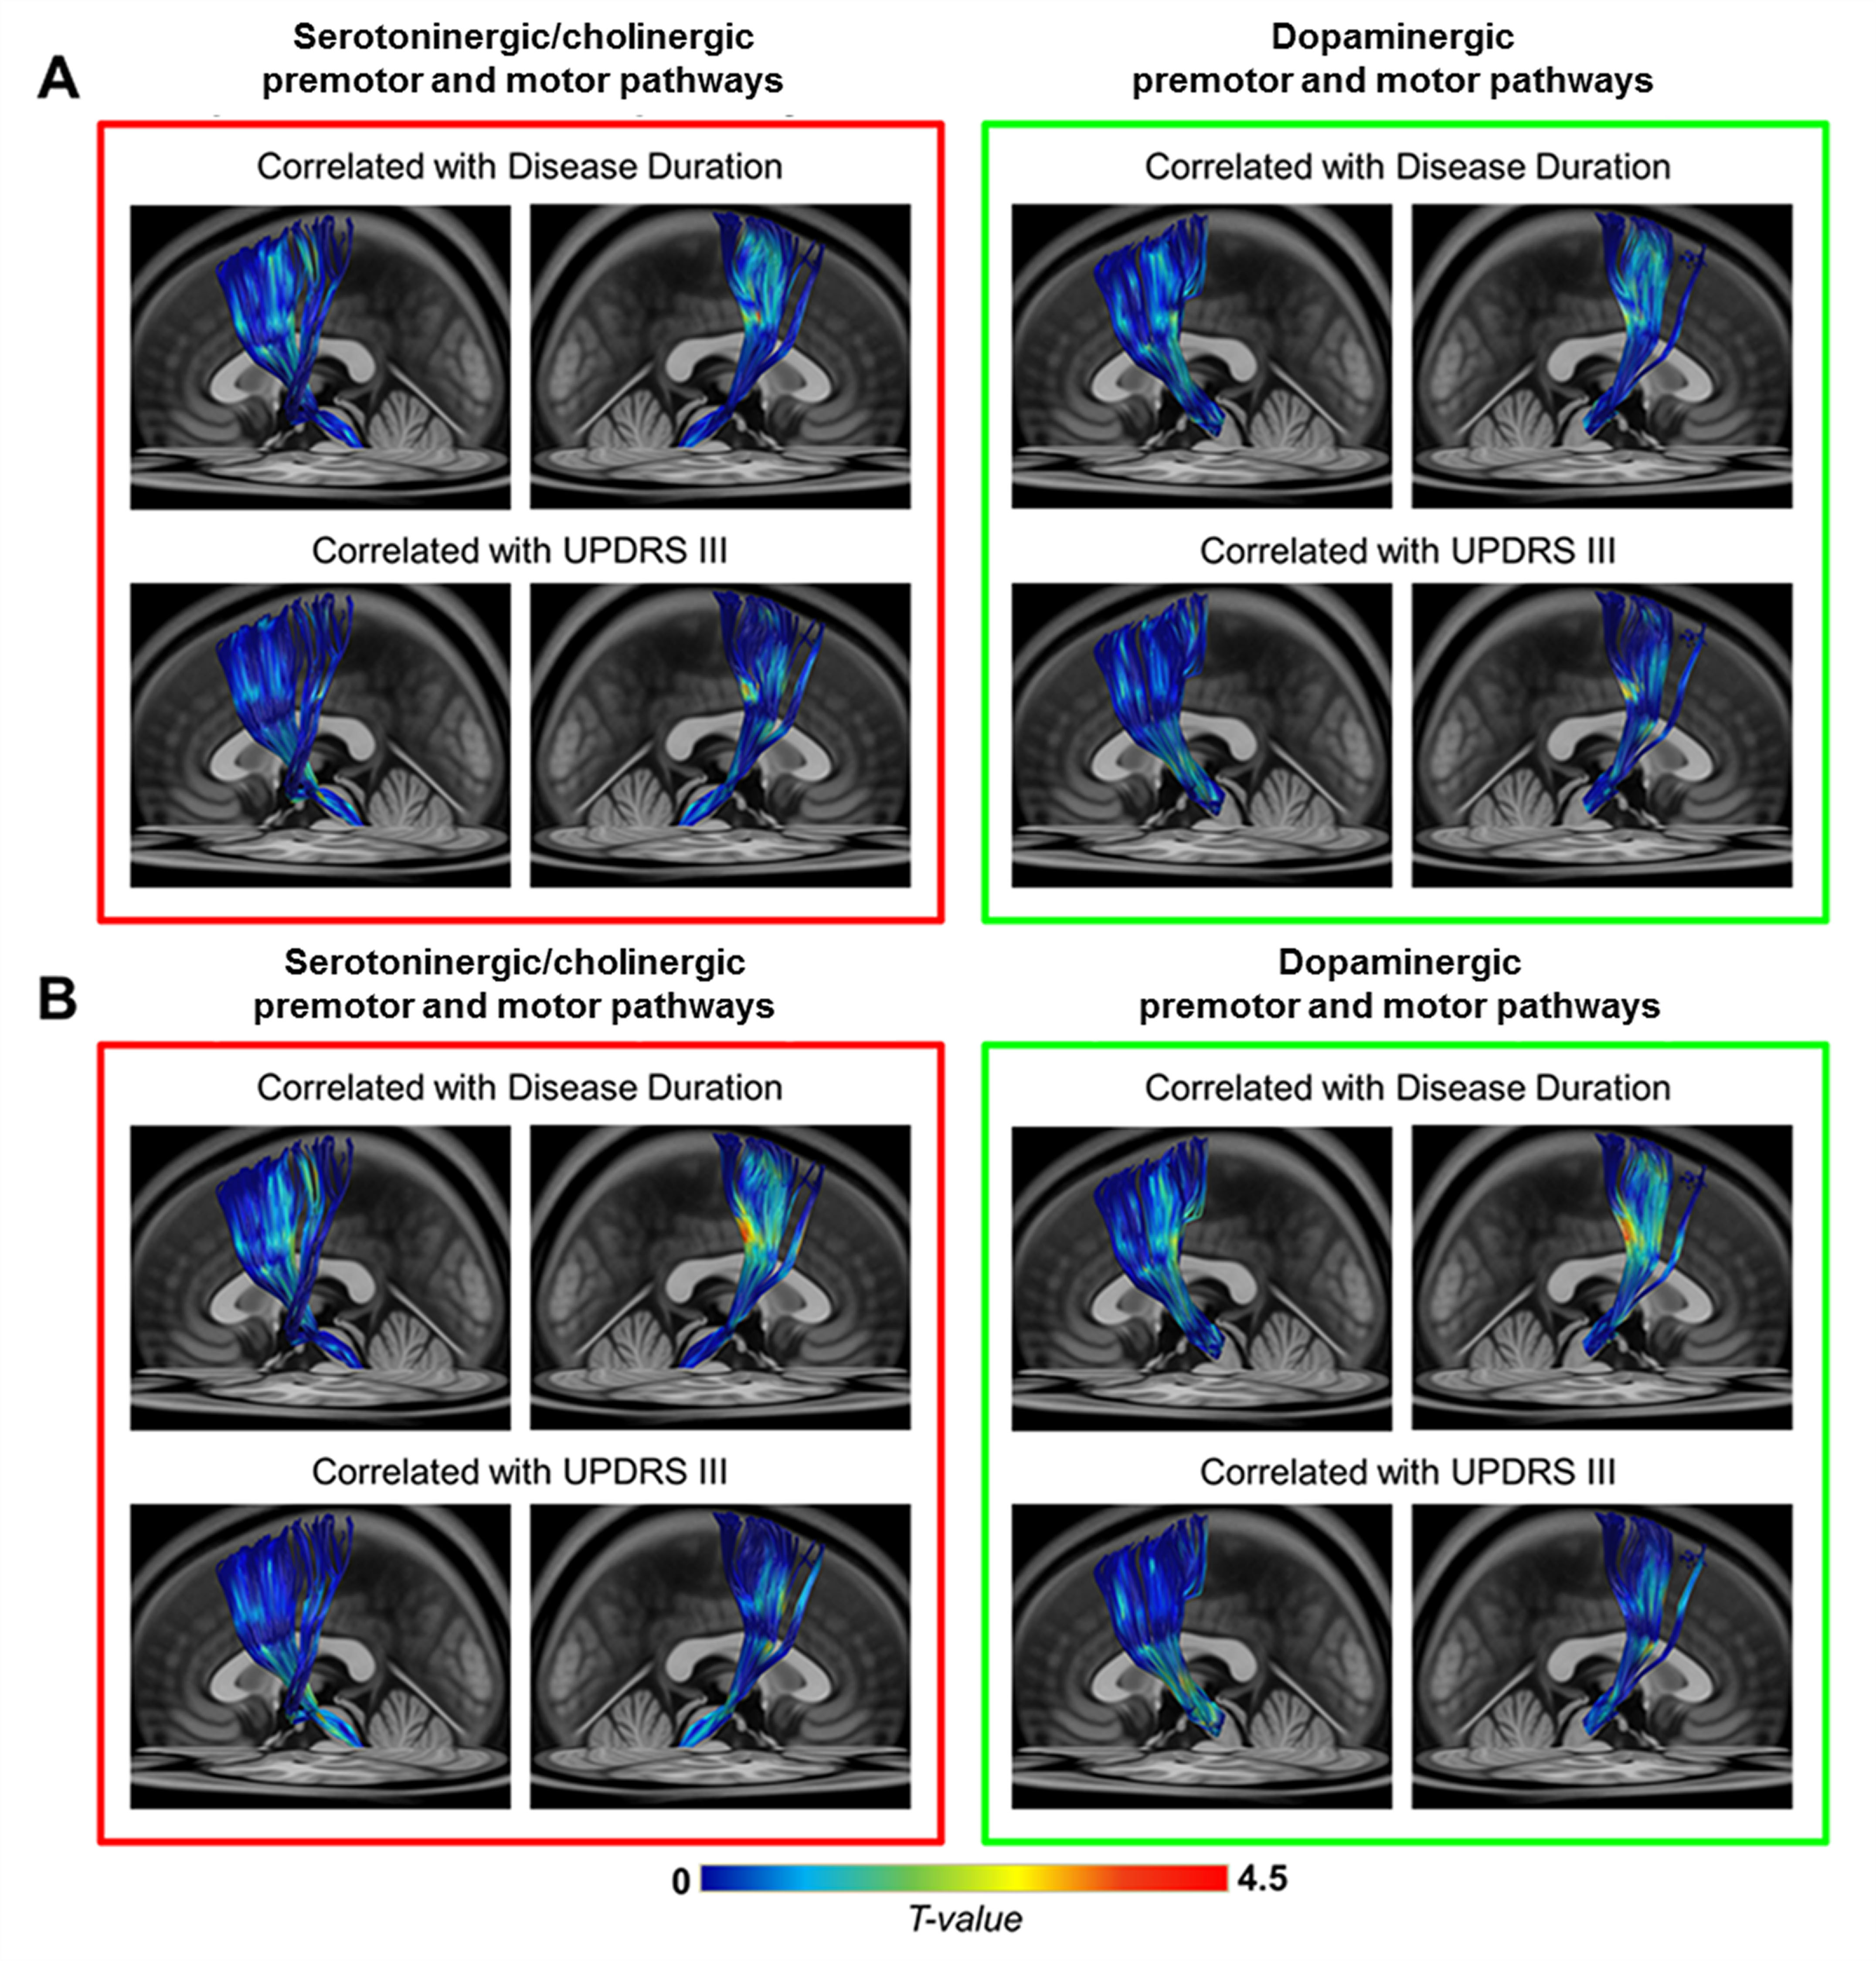
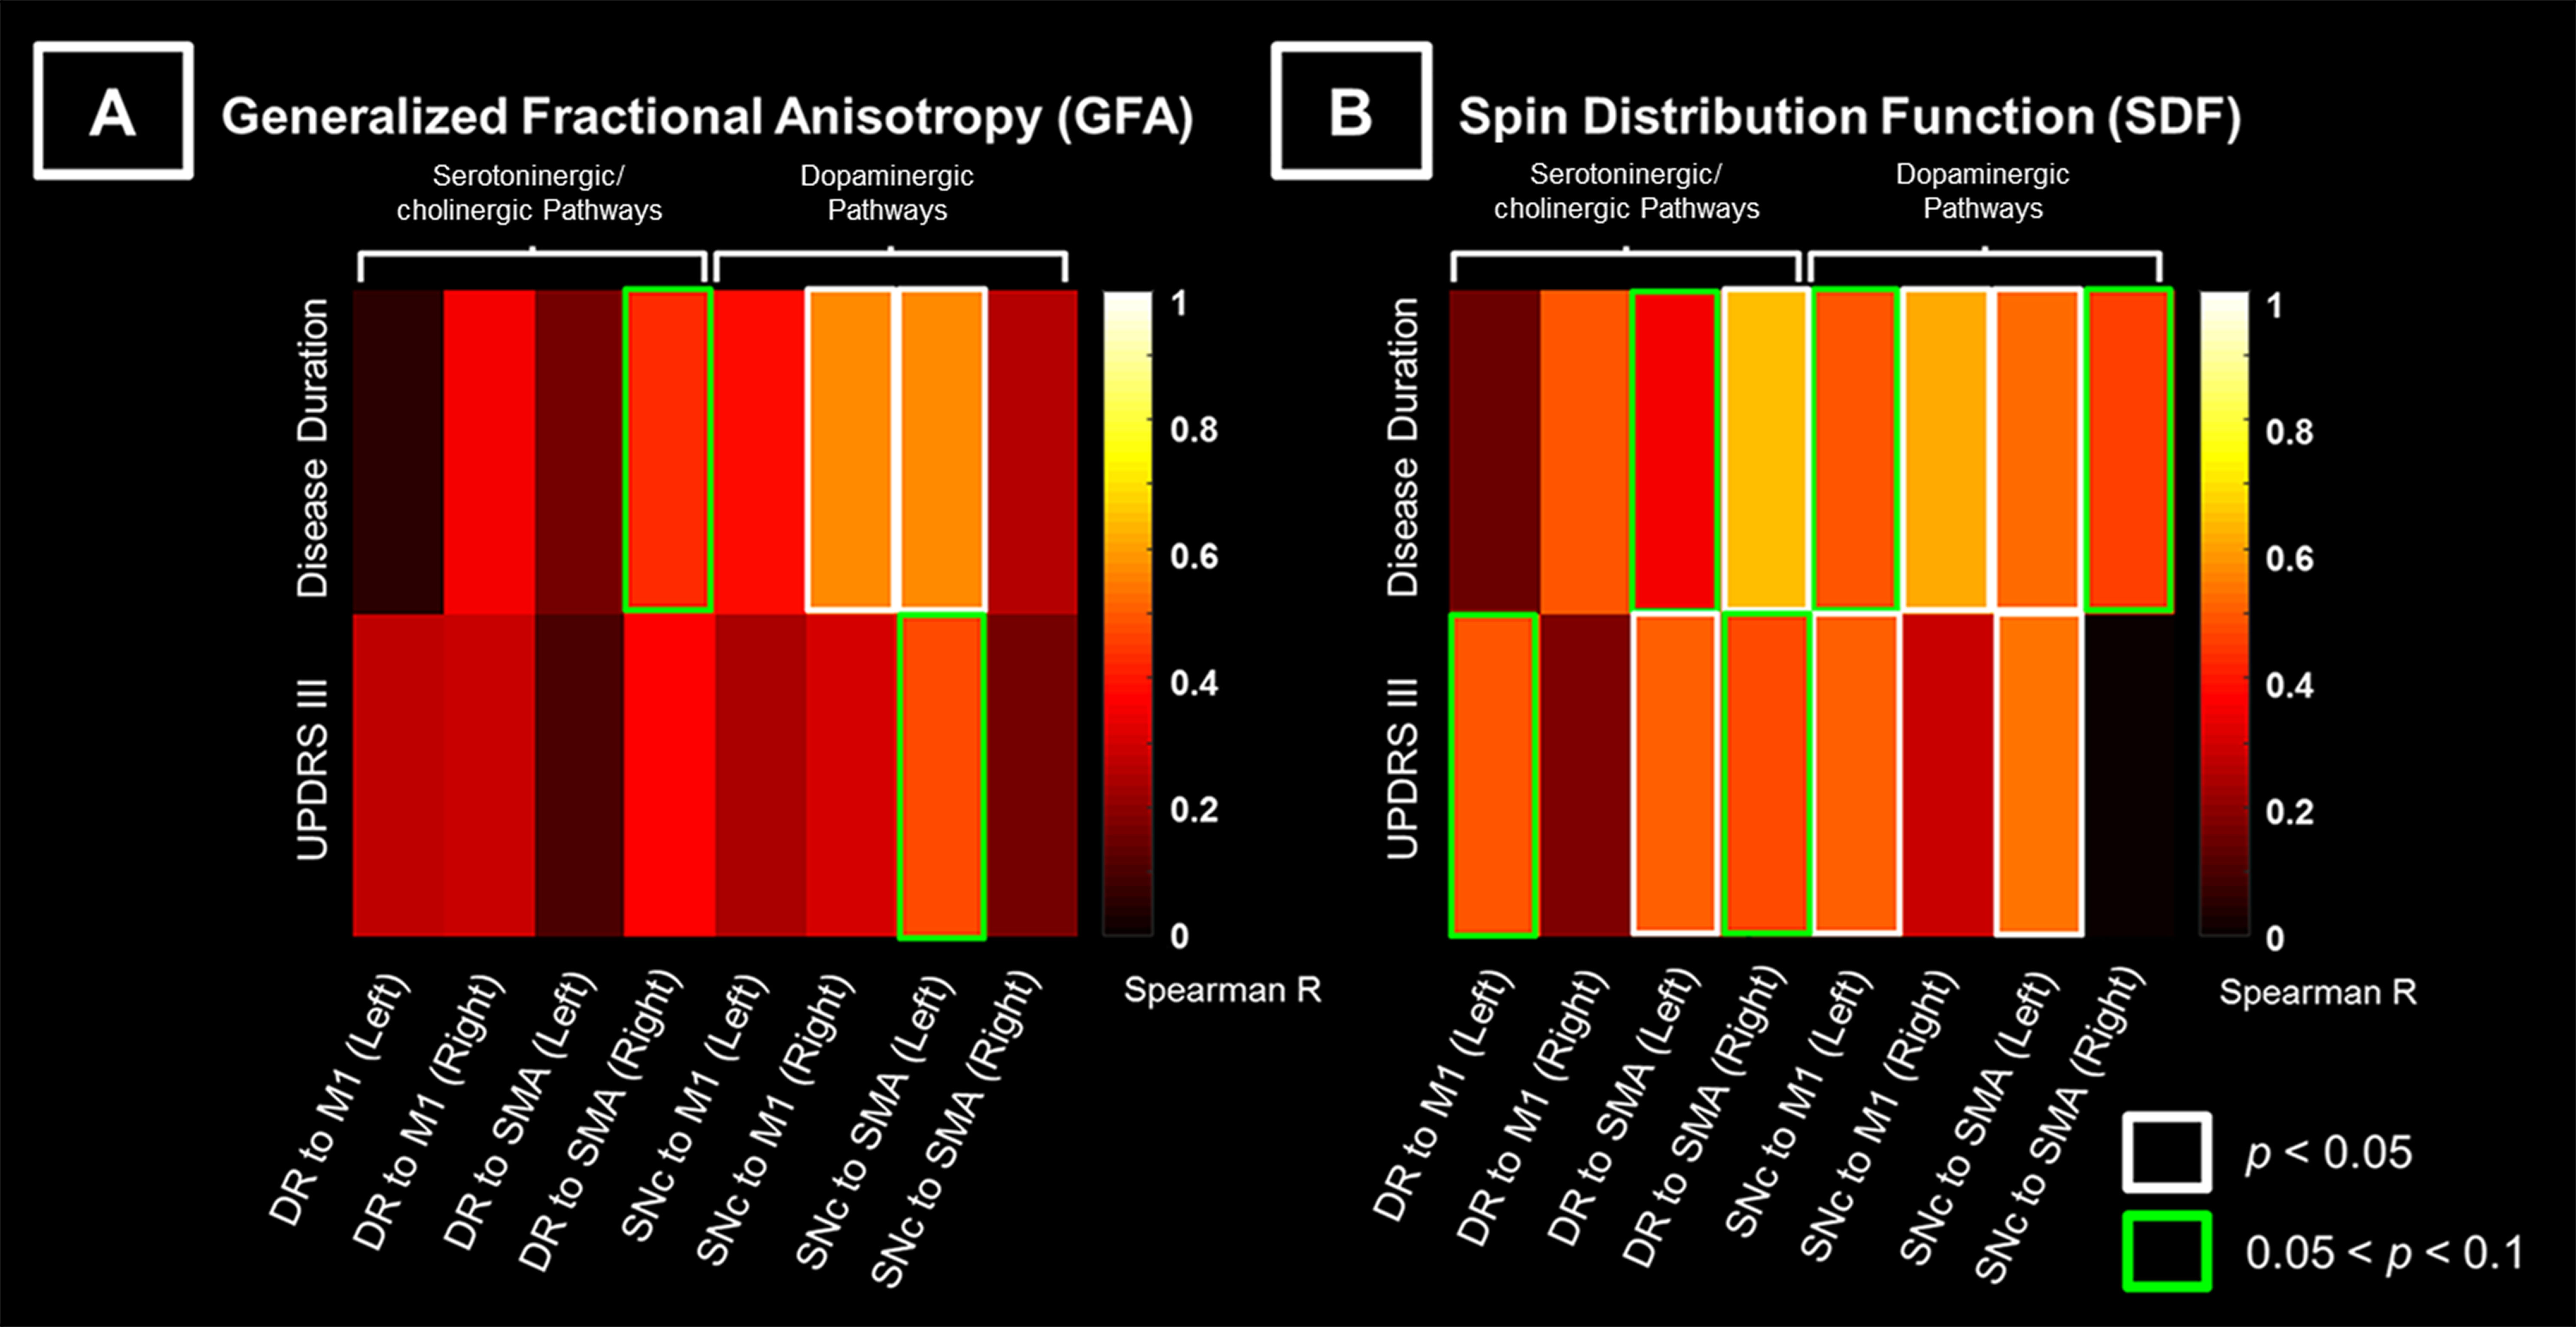
The subcomponents of premotor and motor pathways in both neurotransmitter systems showed positive correlations between GFA values and clinical variables [0.05 < false-discovery-rate-p (FDR-p) < 0.5, Fig 3A]. Stronger positive correlations between SDF values and clinical variables (0.05 < FDR-p < 0.5, Fig 3B) were observed compared to findings of GFA values (Fig 3A). The range of FDR-p value here suggests a higher possibility of positive findings. Partial-Spearman correlation analysis revealed that, when associating GFA values with clinical variables, few pathways with positive correlations were found. In contrast, when associating SDF values with clinical variables, more pathways with positive correlations were identified (p < 0.05, Fig 4).Discussion
Most positive correlations of SDF values of fiber pathways with disease duration and UPDRS III were identified in the dopaminergic premotor and motor pathways, and fewer were found in the serotoninergic/cholinergic premotor pathways. Given that GFA and SDF respectively reflect the microstructural integrity of fiber tracts10 and the axonal density within a voxel7,9, our findings suggested that PD patients with longer disease duration or more severe motor dysfunctions had either more compact bundle or higher axonal complexity in these WM pathways. We also observed a trend of increased GFA and SDF values in the motor pathways projected from the DR and SNc in patients compared to HC group (0.05 < p < 0.1). This finding was consistent with previous PD studies using diffusion tensor imaging.11,12 Taken together, in the cortical-striatal-brainstem WM structures, the dopaminergic pathways dominates over the serotoninergic/cholinergic pathways in PD progression. Increased GFA and SDF of WM pathways in PD group may reflect a compensatory effect of axonal sprouting in response to neuronal degeneration in the brainstem13 in agreement with findings from previous animal studies.14,15 Since the connectometry analysis enables us to identify fiber pathways associated with study variables, future work will investigate the microstructural changes of other neurochemical WM pathways with respect to the progression of non-motor symptoms in PD.Conclusion
Local structural connectome values of premotor and motor pathways in multiple neurotransmitter systems relevant to disease duration and UPDRS III reflect potentially differential PD progression in their WM circuitry that fits the Braak stages.3Acknowledgements
No acknowledgement found.References
1. Bernheimer H, Birkmayer W, Hornykiewicz O, et al. Brain dopamine and the syndromes of Parkinson and Huntington. Clinical, morphological and neurochemical correlations. J Neurol Sci. 1973;20(4):415–455.
2. Zhang Y, Wu IW, Buckley S, et al. Diffusion tensor imaging of the nigrostriatal fibers in Parkinson’s disease. Mov Disord. 2015;30(9):1229–1236.
3. Braak H, Del Tredici K, Rüb U, et al. Staging of brain pathology related to sporadic Parkinson’s disease. Neurobiol Aging. 2003;24:197–211.
4. Jellinger KA. Pathology of Parkinson’s disease. Changes other than the nigrostriatal pathway. Mol Chem Neuropathol. 1991;14:153–197.
5. Wilson H, Dervenoulas G, Pagano G, et al. Serotonergic pathology and disease burden in the premotor and motor phase of A53T α-synuclein parkinsonism: a cross-sectional study. Lancet Neurol. 2019;18:748–759.
6. Yeh FC, Tseng WY. NTU-90: a high angular resolution brain atlas constructed by q-space diffeomorphic reconstruction. NeuroImage. 2011; 58: 91–99.
7. Yeh FC, Wedeen VJ, Tseng WY. Generalized q-sampling imaging. IEEE Trans Med Imaging. 2010;29:1626–1635.
8. Yeh FC, Vettel JM, Singh A, et al. Quantifying differences and similarities in whole-brain white matter architecture using local connectome fingerprints. PLoS computational biology. 2016; 12(11):e1005203. 9. Yeh FC, Badre D, Verstynen T. Connectometry: A statistical approach harnessing the analytical potential of the local connectome. NeuroImage. 2016;125:162–171.
10. Fritzsche KH, Laun FB, Meinzer HP, et al. Opportunities and pitfalls in the quantification of fiber integrity: what can we gain from Q-ball imaging? NeuroImage. 2010;51(1):242–251.
11. Ziegler E, Rouillard M, André E, et al. Mapping track density changes in nigrostriatal and extranigral pathways in Parkinson's disease. NeuroImage. 2014;99:498–508.
12. Perlbarg V, Lambert J, Butler B, et al. Alterations of the nigrostriatal pathway in a 6-OHDA rat model of Parkinson's disease evaluated with multimodal MRI. PLoS One. 2018;13(9): e0202597.
13. Azuma M, Hirai T, Yamada K, et al. Lateral asymmetry and spatial difference of iron deposition in the substantia nigra of patients with Parkinson disease measured with quantitative susceptibility mapping. AJNR AM J Neuroradiol. 2016;37(5):782–788.
14. Arkadir D, Bergman H, Fahn S. Redundant dopaminergic activity may enable compensatory axonal sprouting in Parkinson disease. Neurology. 2014;82(12):1093–1098.
15. Gagnon D, Gregoire L, Di Paolo T, et al. Serotonin hyperinnervation of the striatum with high synaptic incidence in parkinsonian monkeys. Brain Stuct Funct. 2016;221(7):3675–3691.
16. Rolls ET, Joliot M, Tzourio-Mazoyer N. Implementation of a new parcellation of the orbitofrontal cortex in the automated anatomical labeling atlas. NeuroImage. 2015;122:1–5.
17. Zhang Y, Larcher KM, Misic B, et al. Anatomical and functional organization of the human substantia nigra and its connections. Elife. 2017; 6.pii:e26653.
18. Edlow BL, Takahashi E, Wu O, et al. Neuroanatomic connectivity of the human ascending arousal system critical to consciousness and its disorder. J Neuropathol Exp Neurol. 2012;71(6):531–546.
Figures