0204
Brainstem structural connectivity changes in prodromal Parkinson’s disease by 7 Tesla HARDI1Department of Radiology, Athinoula A. Martinos Center for Biomedical Imaging, Massachusetts General Hospital and Harvard Medical School, Boston, MA, United States, 2Department of Neurology, Massachusetts General Hospital and Harvard Medical School, Boston, MA, United States
Synopsis
REM-sleep-behavior-disorder (RBD) is a sleep disorder characterized by the absence of muscular atonia during REM sleep. RBD patients have a high risk of developing Parkinson’s disease (PD) within 10 years from RBD diagnosis. Thus, RBD allows the investigation of early/prodromal neurodegenerative-stages. Changes in brainstem-nuclei-connectivity are expected in RBD/prodromal-PD based on animal and ex-vivo human-studies. Yet, their investigation in living-humans is understudied. Through high-spatial-resolution 7 Tesla HARDI MRI and a recently-developed probabilistic-brainstem-nuclei-atlas, we built a brainstem-based structural-connectome in living RBD-patients and age-matched controls. Interestingly, in RBD-patients we detected structural-connectivity-changes within the brainstem in line with the pathophysiology of RBD in animal-models.
Introduction
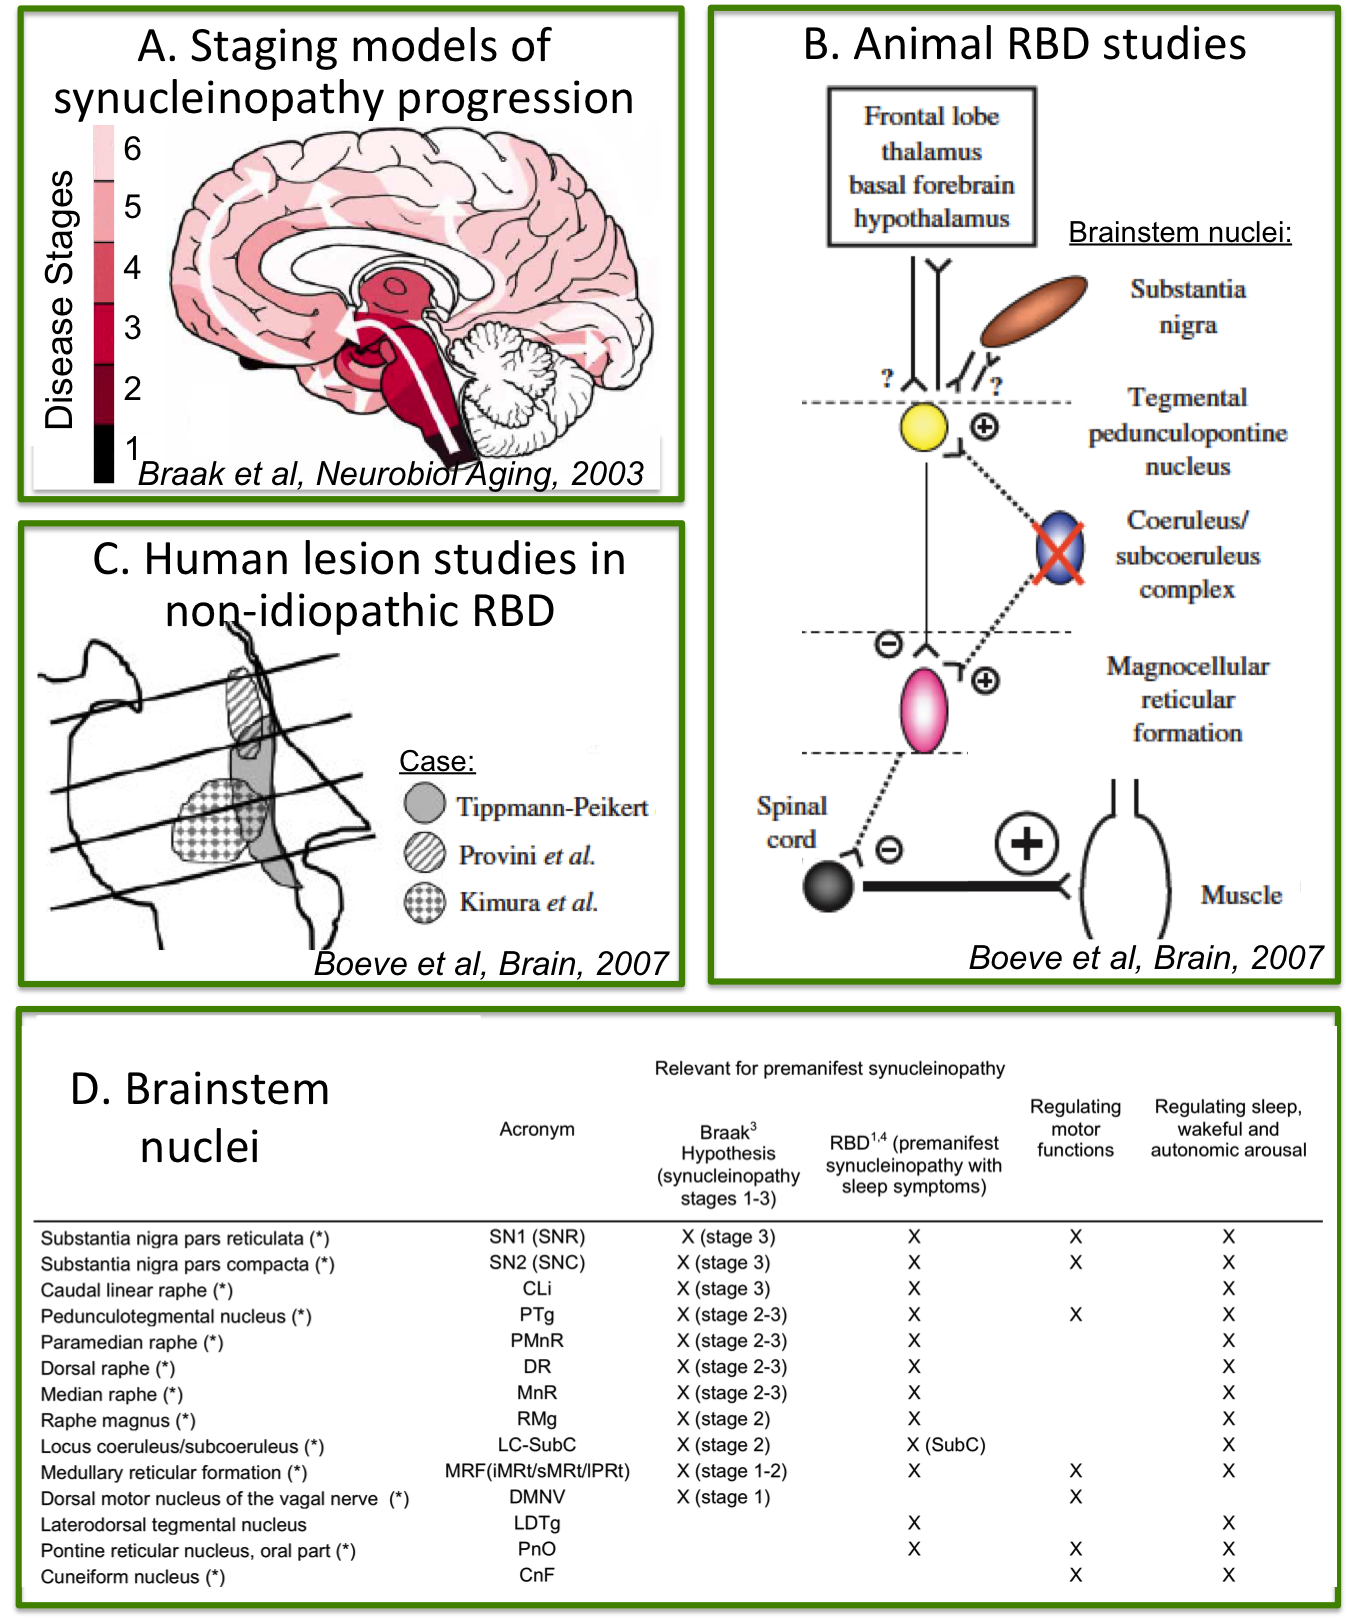
Rapid-eye-movement (REM) sleep behavior disorder (RBD) is a sleep disorder characterized by the absence of muscular atonia during REM sleep. RBD patients have up to a 66% risk of developing Parkinson’s disease (PD) after 7.5 years from RBD-diagnosis1, 2. Thus RBD allows the investigation of early, premanifest neurodegenerative stages when treatment can be most effective in delaying the development of full-blown disease3. Changes in the microstructure and connectivity of brainstem nuclei are expected in RBD/premanifest-synucleinopathy based on (Figure 1A-C): (i) ex-vivo human staging models of PD progression4; (ii) in-vivo human lesion studies of non-idiopathic-RBD5; (iii) RBD animal studies5. Nevertheless, these brainstem changes underlying RBD/prodromal-PD are currently understudied in living humans.Purpose
To investigate the presence of structural connectivity changes of brainstem nuclei in RBD by the use of high spatial and high angular resolution diffusion imaging (HARDI) at 7 Tesla as well as a recently developed probabilistic structural atlas of brainstem nuclei of the arousal and motor systems in Montreal-Neurological-Institute (MNI) space6-9.Methods
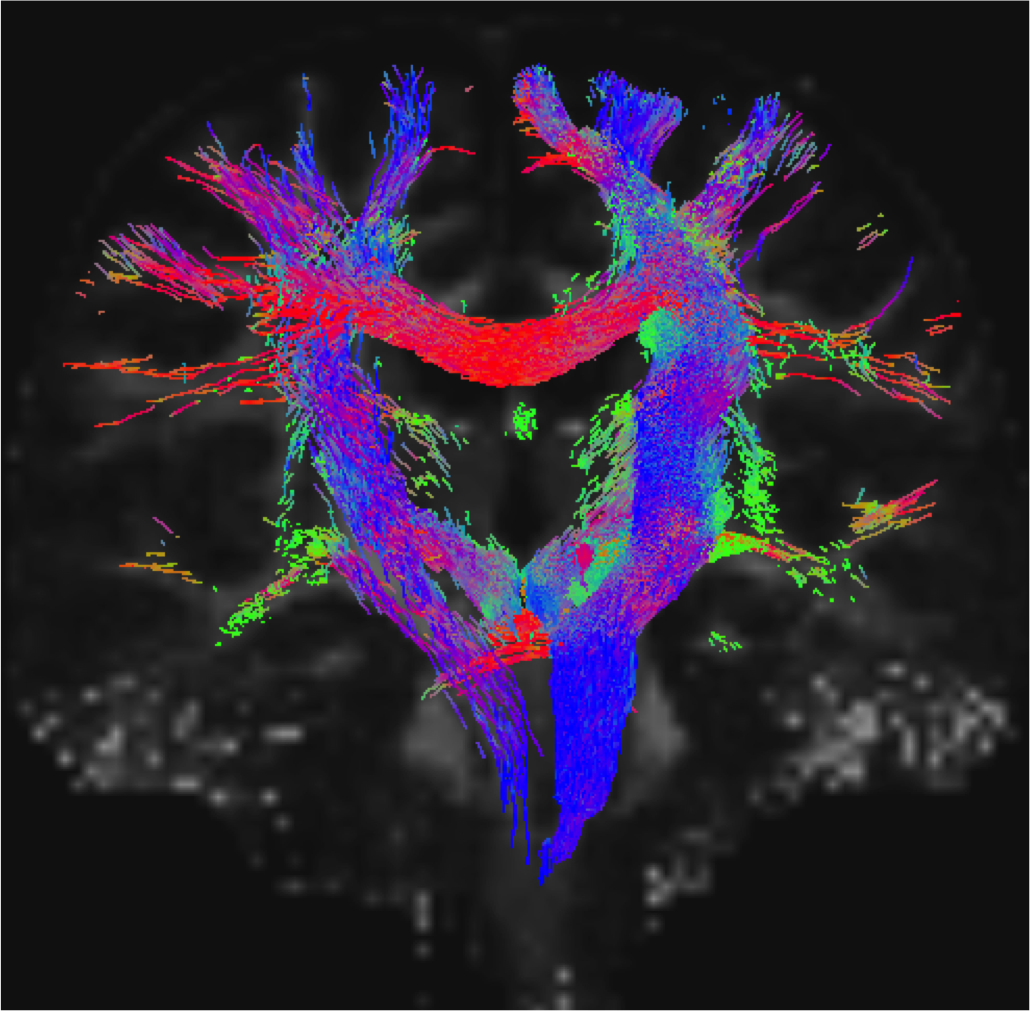
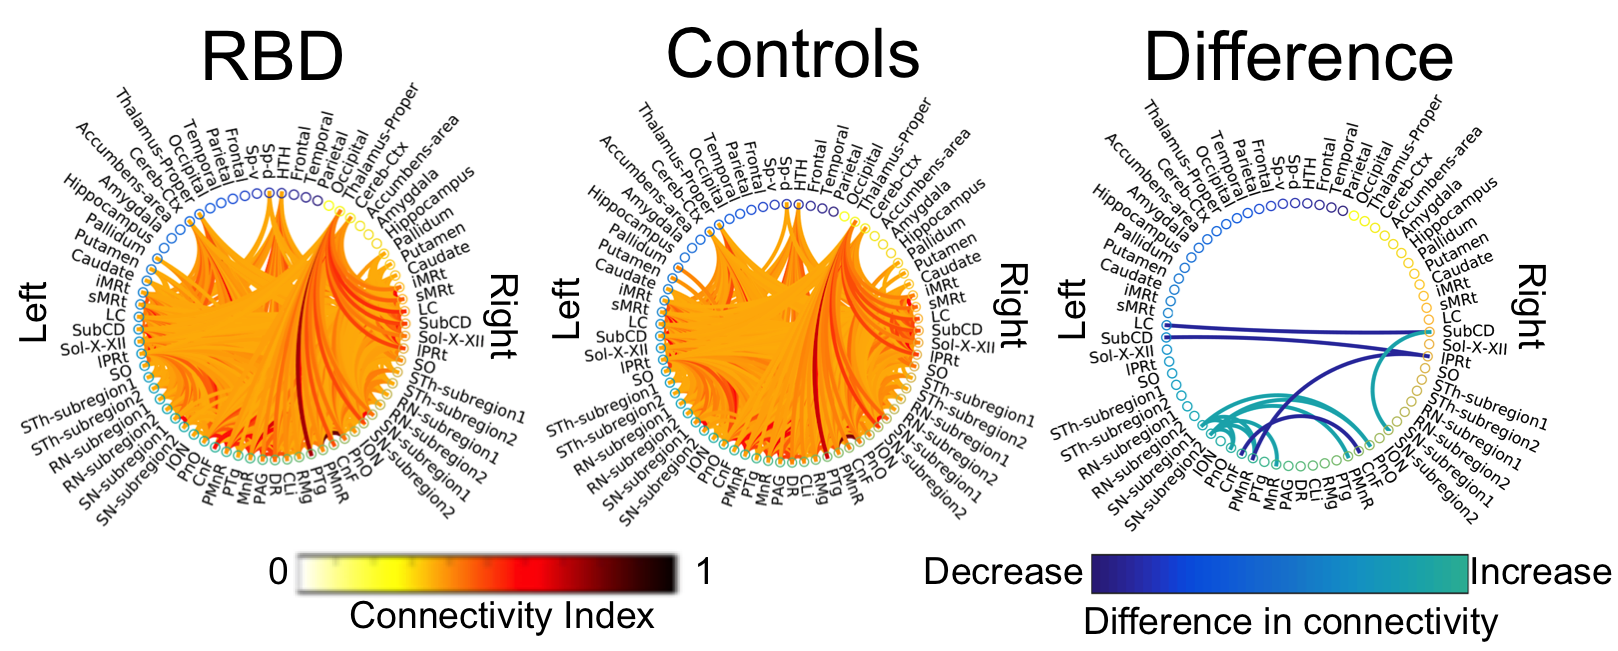
Data acquisition: Ten patients with idiopathic-RBD (age 69.7 ± 1.5) and ten age/gender matched healthy subjects (age 67.2 ± 2.1) underwent MRI under IRB-approval using a 7 Tesla whole-body research scanner. T1-weighted multi-echo MEMPRAGE image: with parameters repetition-time/echo-times/inversion time/ flip angle/ FOV/ bandwidth/GRAPPA factor: 2.51s/1.6, 3.5, 5.3, 7.2 ms/1.5 s/7°/256×256×176 mm3/“651 Hz/pixel”/2, acquisition time: 6′34′′. HARDI: common single-shot 2D spin-echo EPI (using a prototype sequence which supports unipolar diffusion encoding) with parameters n. slices/echo-time/repetition-time/phase-encoding direction/bandwidth/partial-Fourier/n. diffusion-directions/b-value: 82 /66.8 ms/7.4 s/“anterior/posterior”/“1456 Hz/pixel”/“6/8”/60/2500 s/mm2, seven interspersed “b0” images (T2-weighted, non-diffusion weighted, b-value = 0 s/mm2), acquisition-time: 8′53′′. To perform distortion-correction we also acquired seven “b0” images with opposite phase-encoding direction.Data analysis: a) Preprocessing: We computed the root-mean-square MEMPRAGE image across echo-times, rotated it to standard-orientation (“RPI”), cropped the most inferior slices containing the spinal-cord (in order to aid its coregistration to MNI-space) and bias-field corrected it (SPM8); we then parcellated the resulting image with Freesurfer10. HARDIs were rotated to standard-orientation, de-noised11, motion and distortion-corrected (FSL, topup/eddy). We then computed the diffusion tensor, tensor-invariants (e.g. fractional anisotropy, FA) and S0 (T2-weighted) image from the preprocessed HARDIs (FSL, dtifit). To map the Freesurfer parcellation to native HARDI-space, we computed an affine boundary-based transformation (FSL, FLIRT-BBR) between the preprocessed MEMPRAGE image and single-subject S0 images. To map the brainstem nuclei atlas to native HARDI-space, we computed the bivariate high-dimensional diffeomorphic transformations (ANTs) between IIT-MNI FA/S0 templates12 and single-subject FA/S0 images. b)Definition of seed and target regions for HARDI-based connectivity analysis: As seed regions, we used the structural probabilistic atlas labels6-9 of seventeen brainstem nuclei relevant for premanifest synucleinopathy (Figure 2, Figure 1D) mapped from IIT-MNI-space to native-space (using the coregistration transformations explained above). As target regions, we used the probabilistic atlas labels of 41-brainstem nuclei6-9, as well as the 82-cortical/subcortical bilateral regions obtained in each subject from the MEMPRAGE Freesurfer-parcellation (mapped to native space as explained above). For display-purposes, we grouped cortical parcellations within each cerebral lobe (frontal/parietal/temporal/occipital). c) Single-subject HARDI-based connectivity analysis: We performed probabilistic tractography using MRtrix3 iFOD2 algorithm based on constrained spherical deconvolution, with a maximum angle of 120 degrees between successive steps and a minimum streamline length of 1 mm (Figure 3). We propagated 100,000 streamlines from each seed-mask, and computed a “structural-connectivity-index” (range: [0 1]) for each pair of seed-target masks (= fraction of streamlines propagated from the seed reaching the target mask). d) Group HARDI-based connectivity analysis: We averaged across subjects the structural-connectivity-index of brainstem nuclei with target-regions to yield a group structural connectome of these nuclei. We displayed this connectome using a 2D circular diagram13 (Figure 4). e) Statistical analysis: We used the Wilcoxon rank-sum test (p < 0.01) to compare the differences in connectivity between groups.
Results
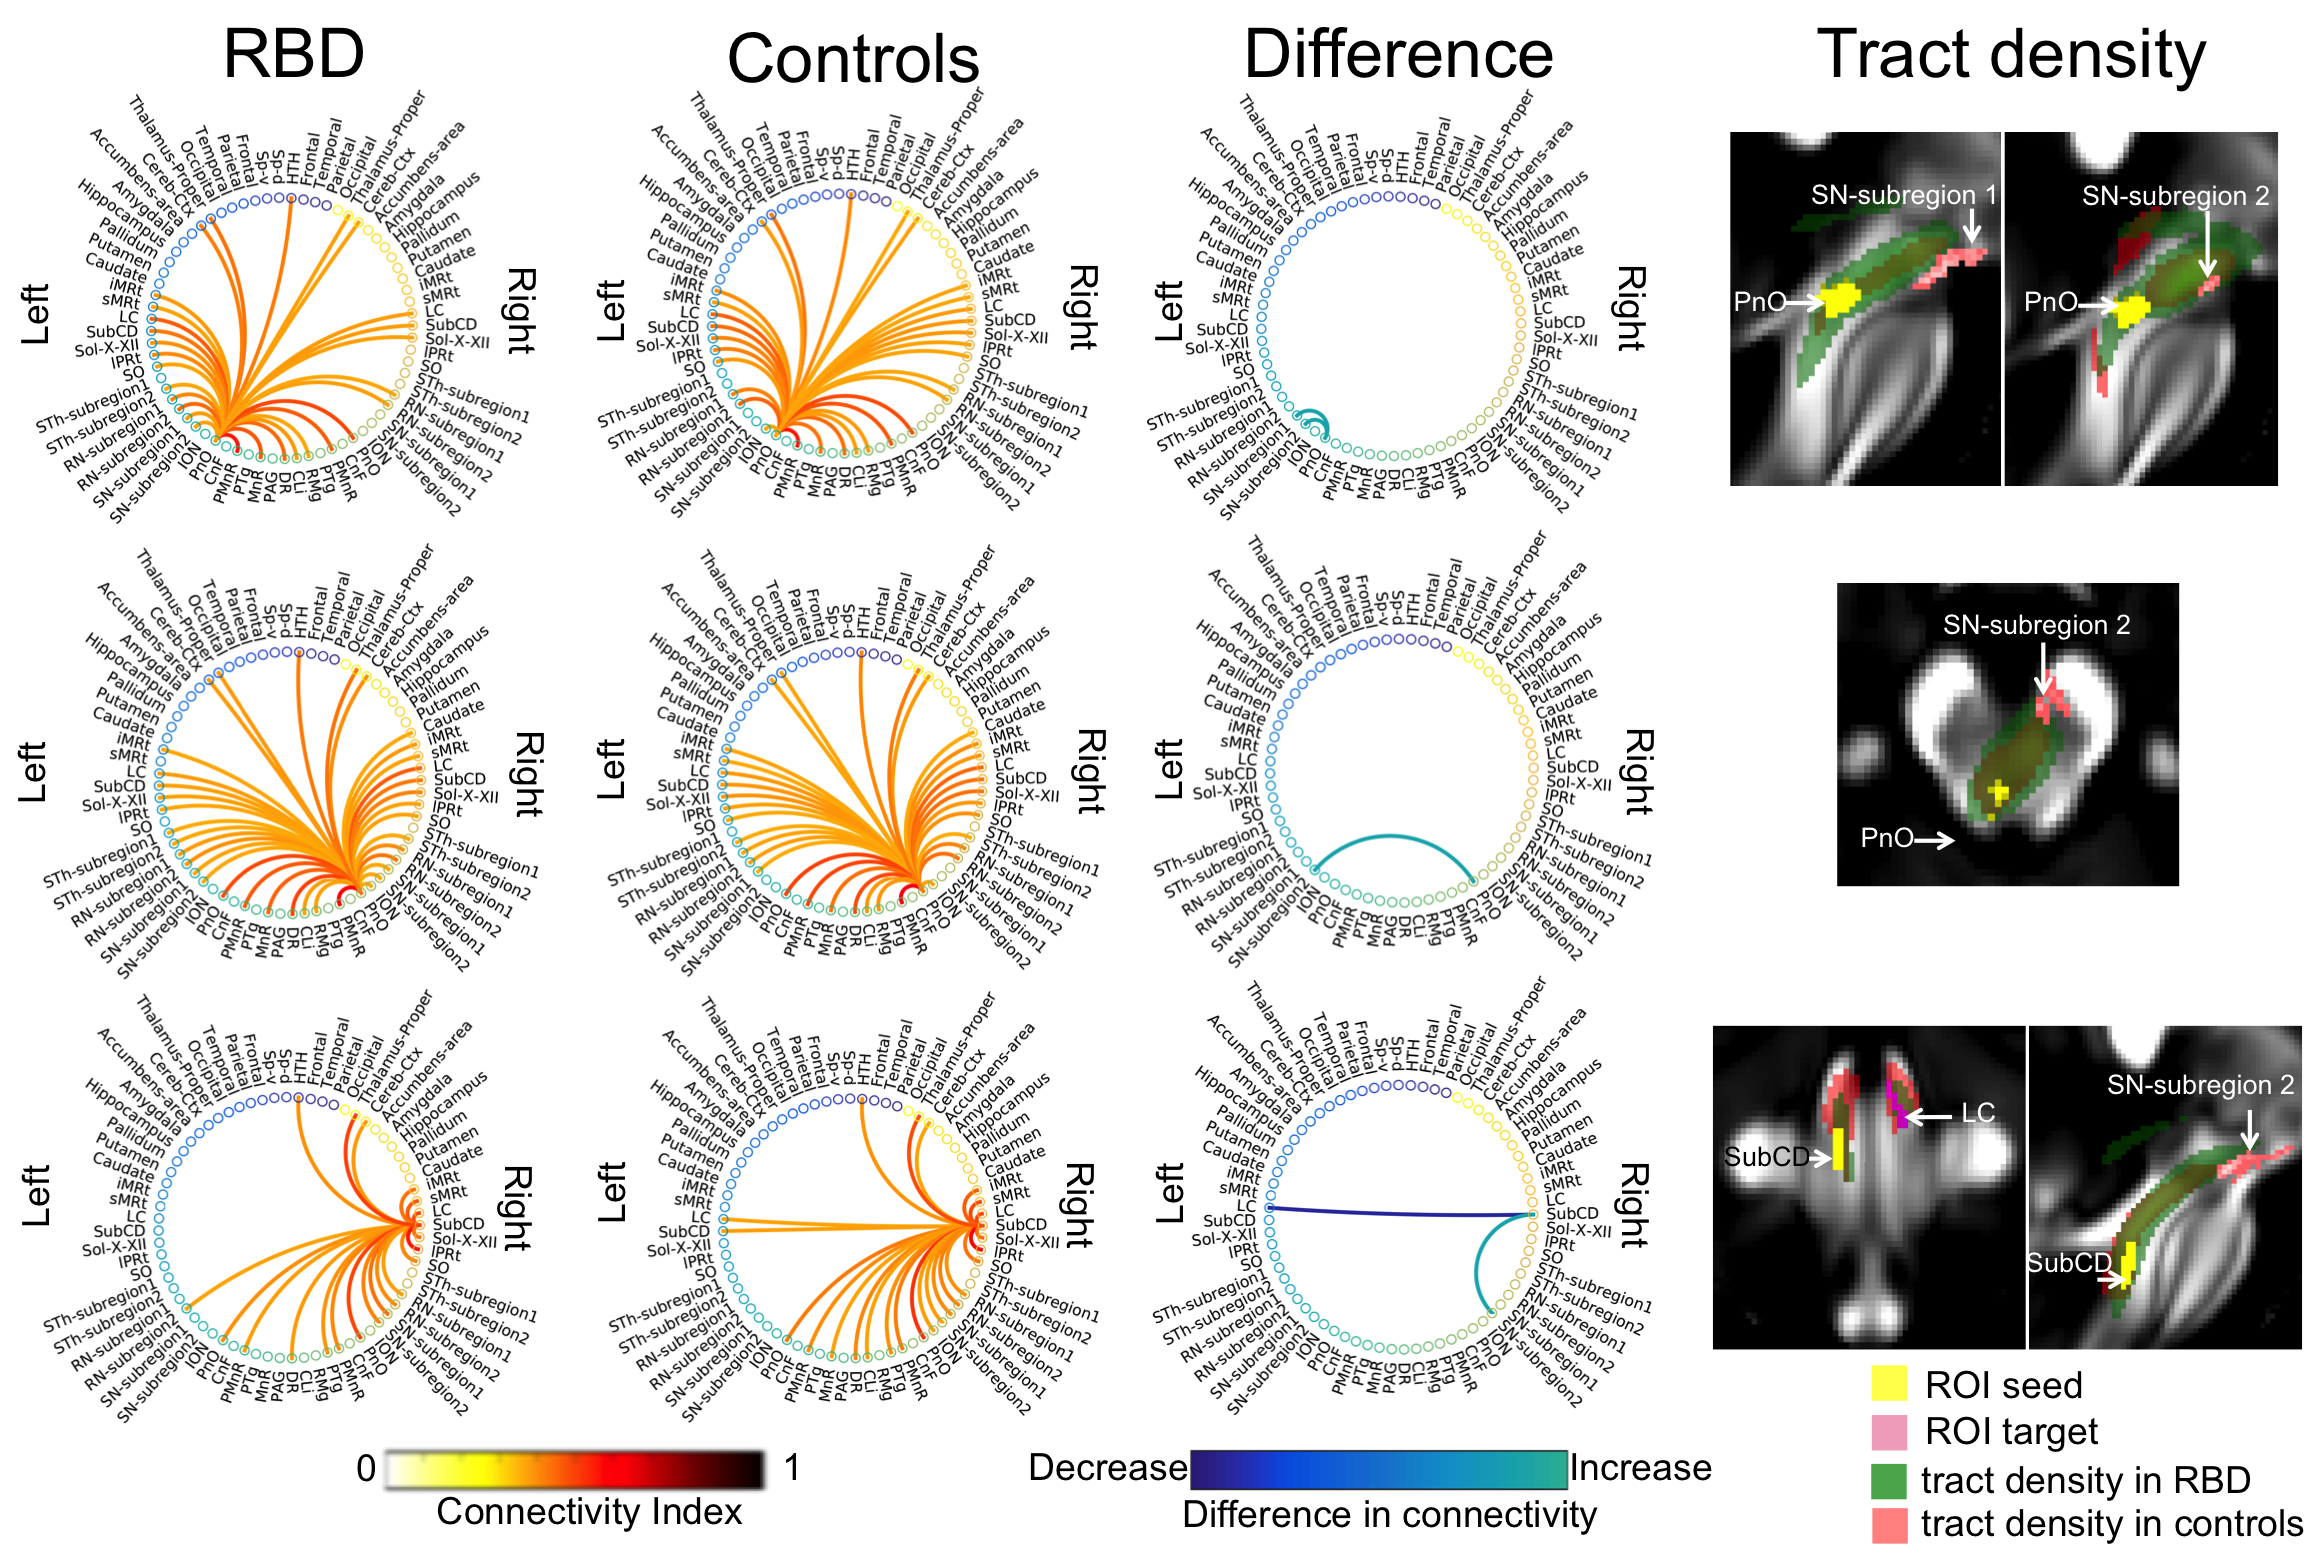
The structural connectome of seventeen brainstem nuclei demonstrated connectivity changes specifically within the brainstem in RBD compared to controls (Figure 4). Interestingly, the left oral pontine reticular nucleus (PnO) showed increased connectivity with ipsilateral and contralateral substantia nigra subregion2 (SN2, compatible with pars-compacta, SNC) in RBD compared to controls. In addition the right PnO showed increased connectivity in RBD compared to controls with ipsilateral substantia nigra subregion1 (SN1, compatible with pars-reticulata, SNR) (Figure 5). The subcoeruleus nucleus (SubCD) showed decreased connectivity with contralateral locus coeruleus (LC) and increased connectivity with ipsilateral substantia nigra subregion1 in RBD compared to controls (Figure 5).Discussion
The PnO is involved in the generation and maintenance of REM sleep14; interestingly we observed changes in the structural connectivity of this nucleus in RBD patients compared to controls. The altered connectivity of the SubCD with the LC and SN1 in RBD patients (prodromal PD) is in line with animal RBD-studies5 (Figure 1B) and with models of PD progression4 (Figure 1A,D). These results provide compelling empirical evidence of the hypothesized role of specific brainstem pathways in the pathogenesis of RBD/prodromal PD, in line with animals and ex-vivo human studies.Conclusions
The structural connectome of brainstem nuclei in living humans is a promising tool to better understand and assess prodromal PD.Acknowledgements
MGH-Claflin-Distinguished-Scholar; Harvard-Mind-Brain-Behavior-Faculty-Award; NIH-NIBIB-K01EB019474; NIH-NIBIB-P41EB015896; Dr. Thorsten Feiweier for providing the diffusion sequence used in this study.References
1. Postuma RB, Gagnon JF, Bertrand JA, et al., Parkinson risk in idiopathic REM sleep behaviour disorder. Neurology. 2015; 84: 1104-1113.
2. Postuma RB. Prodromal Parkinson’s disease – using REM sleep behavior disorder as a window. Parkinsonism Relat Disord. 2014; Suppl1: S1-4.
3. Postuma RB, Berg D. Advances in markers of prodromal Parkinson disease. Nature Reviews, Neurology. 2016; 12: 622-634.
4. Braak H, Del Tredici K, Rub U, et al., Staging of brain pathology related to sporadic Parkinson’s disease. Neurobiol Aging. 2003; 24: 197-211.
5. Boeve BF, Silber MH, Saper CB, et al., Pathophysiology of REM sleep behavior disorder and relevance to neurodegenerative disease. Brain. 2007; 130: 2770-2788.
6. Bianciardi M, Toschi N, Edlow BE, et al., Toward an in vivo neuroimaging template of human brainstem nuclei of the ascending arousal, autonomic, and motor systems. Brain Connect. 2015; 5: 597-607.
7. Bianciardi M, Strong C, Toschi N, et al., A probabilistic template of human mesopontine tegmental nuclei from in vivo 7T MRI. Neuroimage. 2018; 170: 222-230.
8. García-Gomar MG, Strong C, Toschi N, et al., In vivo probabilistic structural atlas inf the inferior and superior colliculi, medial and lateral geniculate nuclei and superior olivary complex in humans based on 7 Tesla MRI. Front. Neurosci. 2019; 13(764): 1-15.
9. Singh K, Indovina I, Augustinack JC, et al., Probabilistic atlas of the lateral parabrachial nucleus, medial parabrachial nucleus, vestibular nuclei complex and medullary viscero-sensory-motor nuclei complex in living humans form 7 Tesla MRI. Biorxiv. 2019. (https://www.biorxiv.org/content/10.1101/814228v1)
10. Desikan RS, Segonne F, Fischl B, et al., An automated labeling system for subdividing the human cerebral cortex on MRI scans into gyral based regions of interest. Neuroimage. 2006; 31: 968-980.
11. Manjon JV, Coupé P, Concha L, et al., Diffusion Weighted Image Denoising Using Overcomplete Local PCA. PLoS ONE. 2013; 8(9): e73021.
12. Varentsova A, Zhang S, Arfanakis K., Development of a high angular resolution diffusion imaging human brain template. Neuroimage. 2014; 91: 177-186.
13. Irimia A, Chambers MC, Torgerson CM, et al., Circular representation of human cortical networks for subject and population-level connectomic visualization.Neuroimage. 2012; 60: 1340-1351.
14. Reinoso-Suárez F, De Andres I, Rodrigo-Angulo ML, et al., Location and Anatomical Connections of a Paradoxical Sleep Induction Site in the Cat Ventral Pontine Tegmentum.European Journal of Neuroscience. 1994; 6: 1829-1836.
Figures