0203
Investigating Spatiotemporal Changes in the Substantia Nigra of Patients with Prodromal and Clinical Parkinson's Disease1Brain and Spine Institute - ICM, Centre for NeuroImaging Research - CENIR, Paris, France, 2Brain and Spine Institute - ICM, Team "Movement Investigations and Therapeutics", Paris, France, 3Brain and Spine Institute - ICM, INSERM U 1127, CNRS UMR 7225, Sorbonne University, Paris, France, 4National Institute of Health and Medical Research - INSERM, Clinical Investigation Centre, Pitié-Salpêtrière Hospital, Paris, France, 5Department of Neuroradiology, Pitié-Salpêtrière Hospital, Public Assistance - Paris Hospitals (AP-HP), Paris, France, 6Biogen Inc., Cambridge, MA, United States, 7Department of Neurology, Pitié-Salpêtrière Hospital, Public Assistance - Paris Hospitals (AP-HP), Paris, France
Synopsis
Parkinson's disease (PD) and idiopathic rapid eye movement sleep behaviour disorder (iRBD, a prodromal condition of Parkinsonism) are characterised by the progressive loss of neuromelanin-containing neurons in the substantia nigra (SN). Based on longitudinal neuromelanin-sensitive magnetic resonance imaging (NM-MRI) of healthy controls, patients with iRBD and patients with PD, and voxel-wise analysis of NM-MRI on a study-specific anatomical brain template, we showed the temporal evolution of SN atrophy in disease. We also found significant correlations between temporal changes in the NM-MRI signal-to-noise ratio and clinical scores of disease severity, reflecting the functional organisation (motor, cognition and behaviour/mood) of the SN.
Introduction
Parkinson’s disease (PD) is characterised by the progressive loss of neuromelanin (NM)-containing dopaminergic neurons in the substantia nigra (SN). PD often features early symptoms, e.g. rapid eye movement (REM) sleep behaviour disorder (RBD), but is only diagnosed after ~30-50% of dopaminergic neurons in the SN have died1,2.Previous studies using NM-sensitive MRI (NM-MRI) have found significant global or regional reductions in both the average signal intensity and size of the visible SN in PD. To fully assess the spatiotemporal degeneration of the SN, however, it is essential to obtain fine-grained anatomical information. To this aim, here we performed a voxel-wise analysis of longitudinal changes in the SN of patients with idiopathic RBD (iRBD) or PD. Because distinct areas of the SN project to distinct regions of the nigrostriatal system3, we also evaluated the correlation between voxel-wise signal-to-noise ratios (SNRs) and motor, cognitive and behavioural clinical scores.
Methods
Two cohorts were prospectively investigated, including healthy controls (HCs) and patients with iRBD or PD (Table 1). All subjects underwent MRI, including a whole-brain 3D T1-weighted MP2RAGE/MPRAGE acquisition for anatomical reference and a T1-weighted 2D turbo spin-echo protocol for NM-MRI4 (Table 1).Motor disability was evaluated using the Movement Disorder Society (MDS) Unified Parkinson’s Disease Rating Scale (UPDRS)5 part III (cohort 1) or the UPDRS6 part III (cohort 2) >12h after dopaminergic treatment withdrawal. Global cognition was assessed using the Mattis Dementia Rating Scale (DRS)7,8. Behaviour and mood were assessed using the Ardouin Scale of Behavior in PD (ASBPD)9,10. In cohort 1, cognitive impairment was also assessed using the Montréal Cognitive Assessment (MoCA) score11. These scores are reported in Table 2.
For each subject, an SN and a background ROI (for reference in the SNR calculations) were drawn on the NM-MRI image as previously described12. For each subject, the NM-MRI image and the two ROIs were affinely aligned to the MP2RAGE/MPRAGE image using NiftyReg13. A template of the average brain was calculated using NiftyReg (5 affine13 plus 10 nonlinear registration steps14) and the skull stripped MP2RAGE/MPRAGE images of 36 HCs, 36 iRBD patients and 36 PD patients in cohort 1 at baseline (V1). For all the other subjects, the MP2RAGE/MPRAGE image was aligned to the brain template using an affine13 plus nonlinear registration14. All individual ROIs were also aligned to the template.
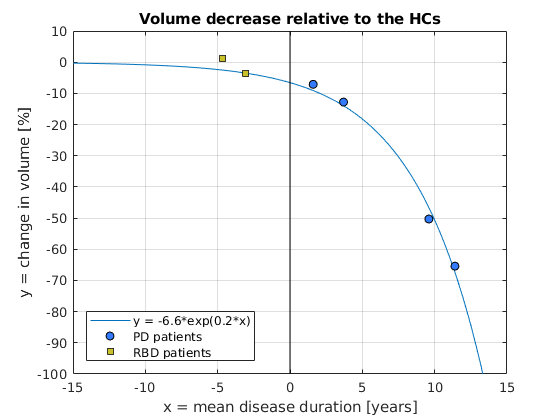
For each group of subjects, the average SN ROI, i.e. the probability map of each voxel belonging to the SN, was calculated. The volume of the average SN (threshold=0.3) and the percentage change in SN volume in patients relative to the HCs were also calculated. In PD, the percentage change in SN volume was modelled against the mean disease duration. In the iRBD patients, the average SN volume was temporally placed based on the knowledge of the fitting function and the time between the two visits.
For all patients at V1 and each voxel in the SN ROI of the HCs (threshold=0.3), Pearson’s correlation with p-value adjustment for multiple comparisons15 was calculated between the NM SNR and the MDS-UPDRS-III and MoCA scores (cohort 1 only), and the Mattis DRS and ASBPD scores (both cohorts).
Results and Discussion
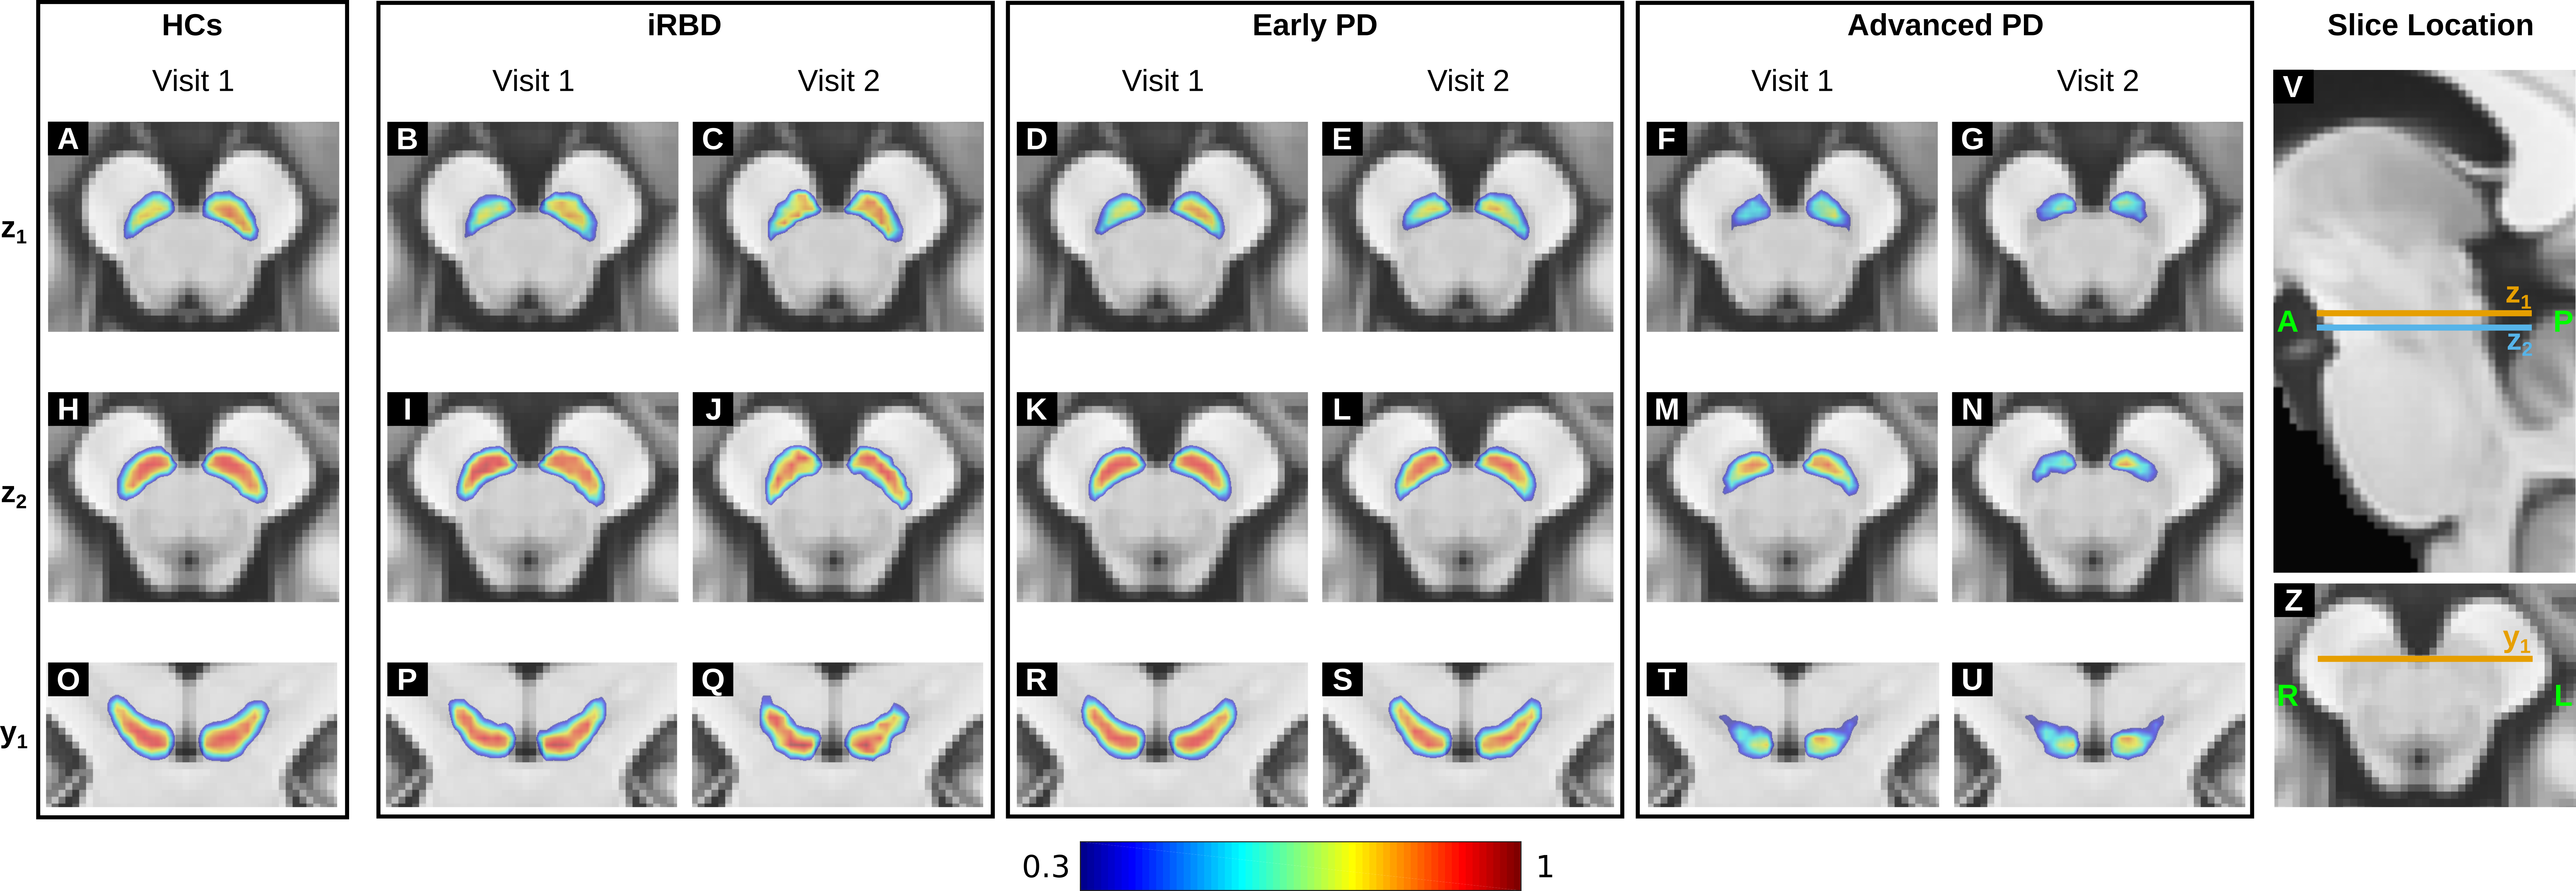
In the PD patients, the probability of a voxel belonging to the SN took values across a smaller range than in the HCs with clusters of low probability localised in the dorsolateral SN (Figure 1). Neurodegeneration started in the dorsolateral SN and progressed to more ventral and medial areas of the SN. In both iRBD and PD patients, the SN probabilities took values in a range smaller than in the HCs (Figure 1), indicating that in patients the ventral and medial SN were less consistently segmented than in the HCs.Starting from iRBD at follow up (V2) the SN volume monotonically decreased compared to the HCs (Figure 2). In PD, the average change in SN volume relative to the HCs was best fitted by a mono-exponential decay. Based on this model, the average change in SN volume in iRBD was estimated to occur 3.1 (V2) and 5.2 years (V1) before the onset of PD as previously reported16.
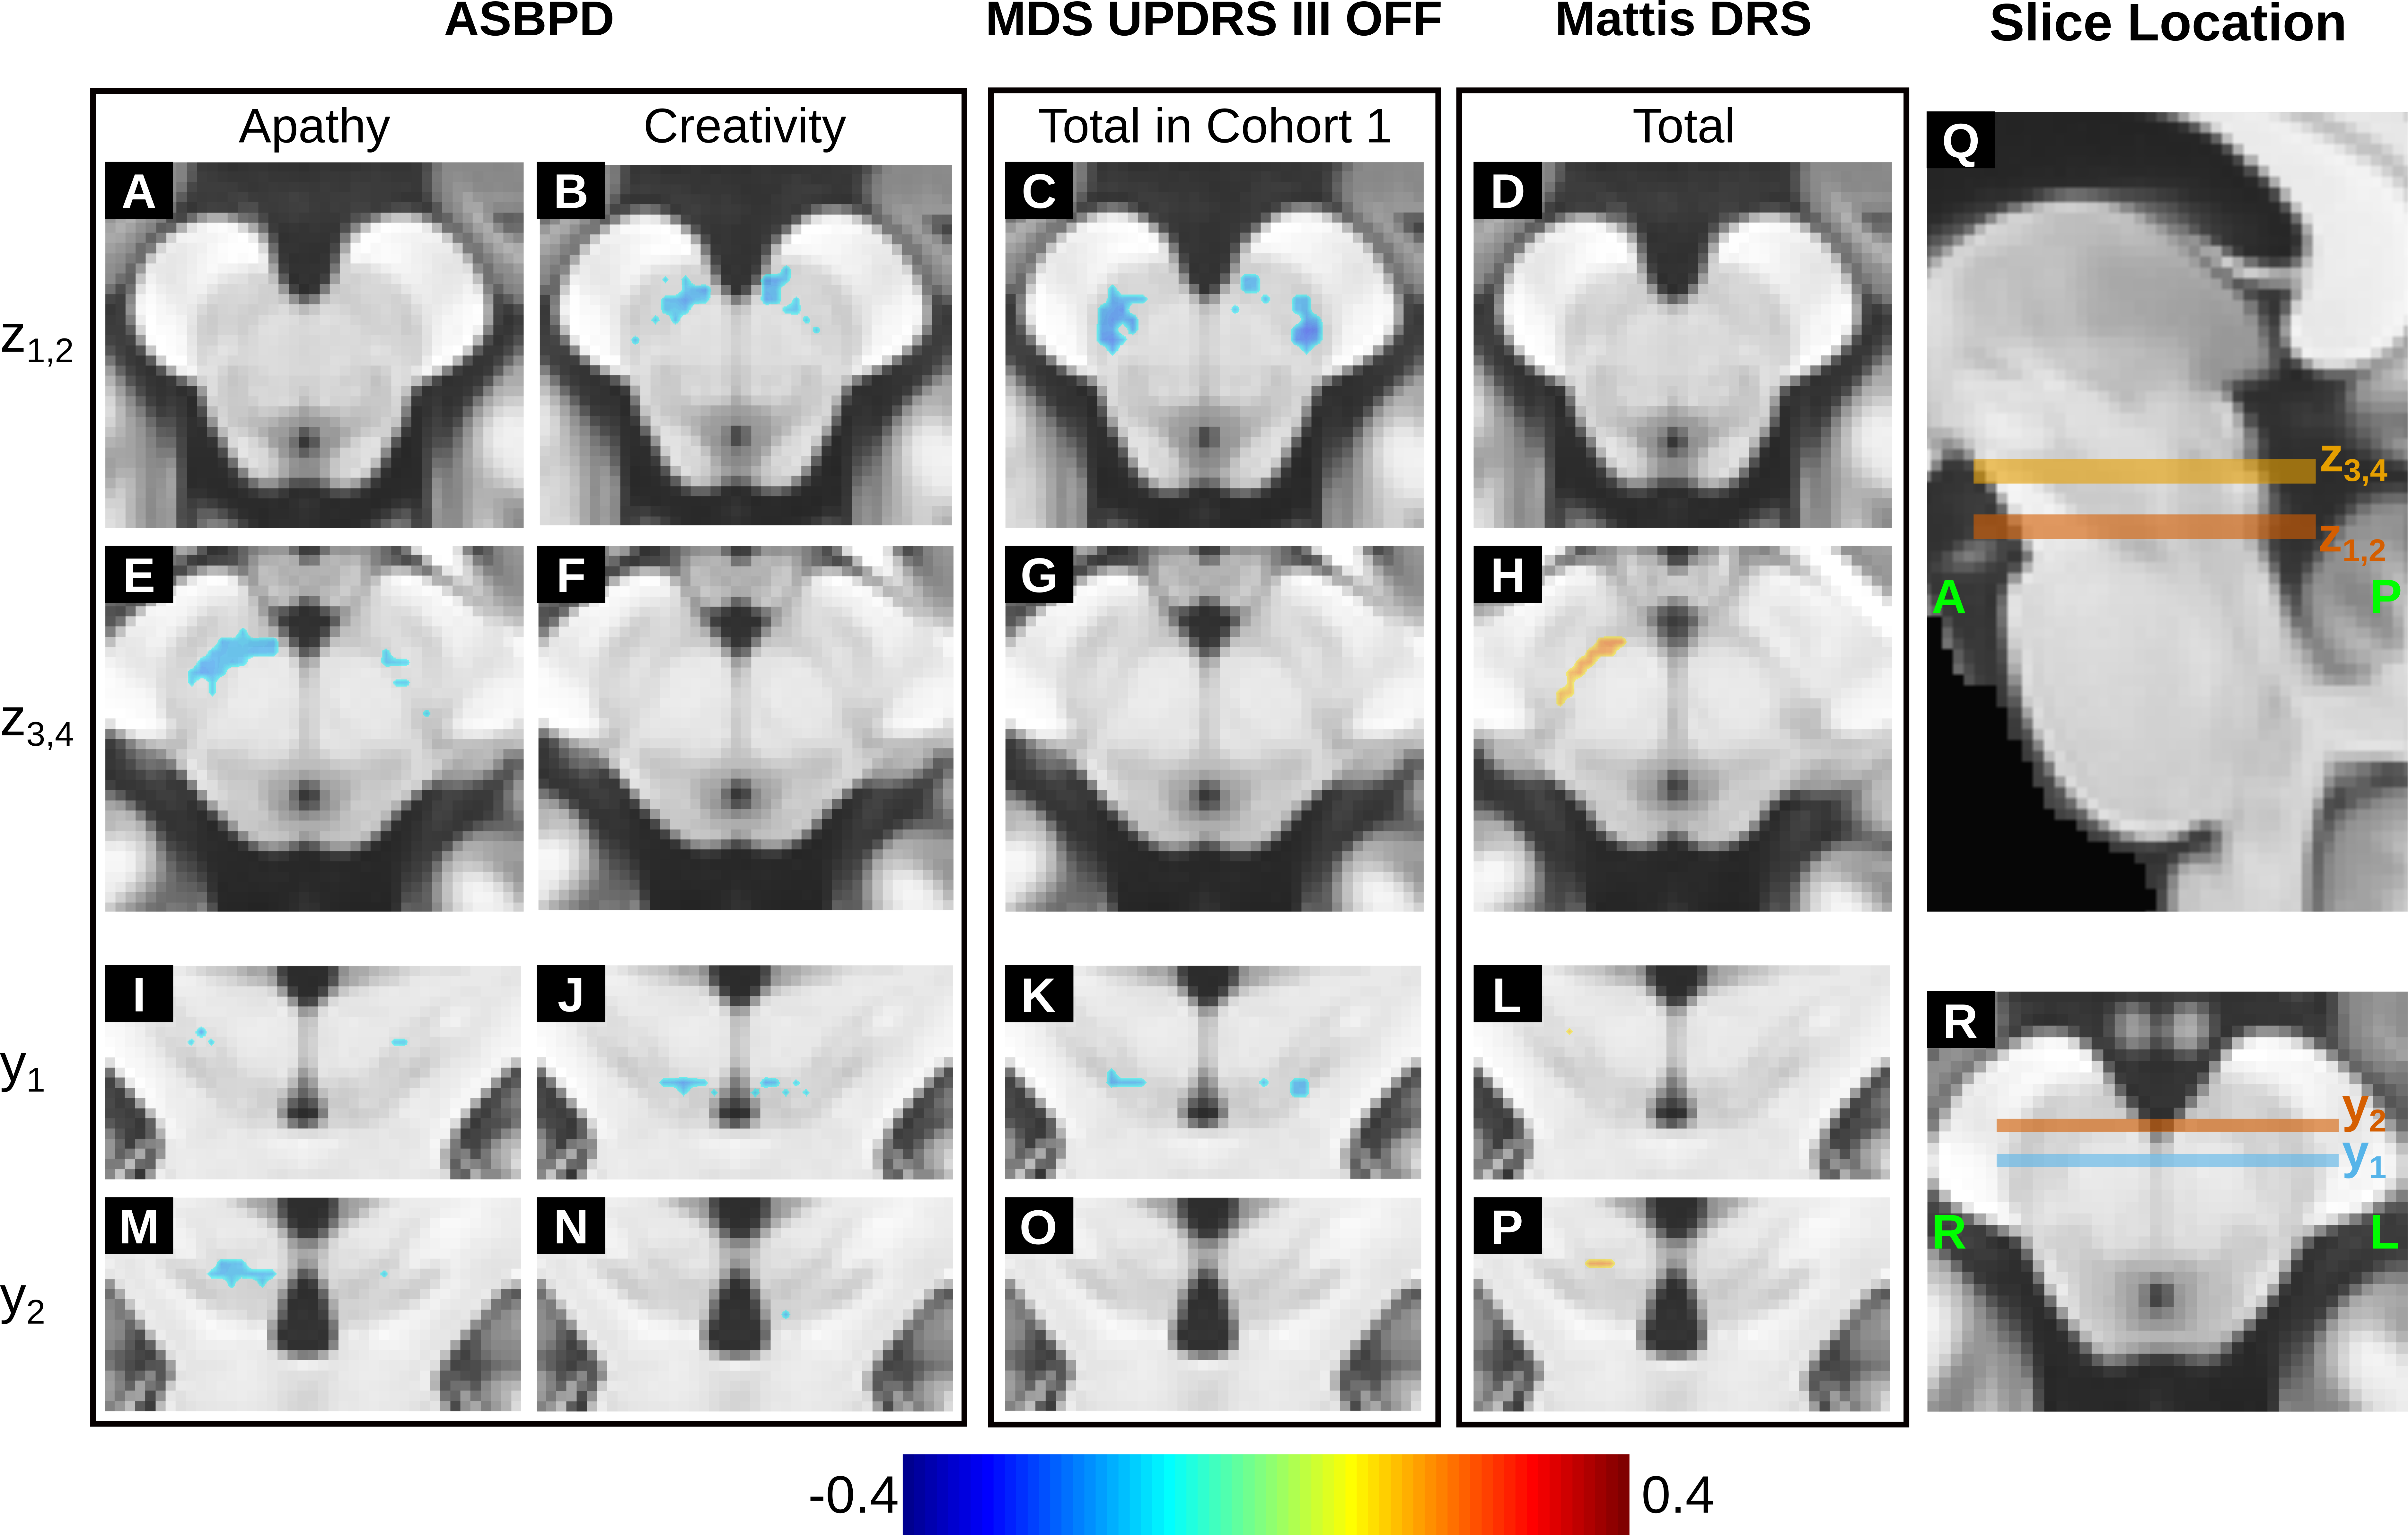
In cohort 1, the MDS-UPDRS-III OFF score was negatively correlated with the NM SNR in the bilateral dorsolateral area of the SN (Figures 3C and K) in line with the pattern of volume loss previously observed in PD4. In cohort 1, the MoCA score did not correlate with the NM SNR. When considering both cohorts, the total Mattis DRS score was positively correlated with the SNR in the medial right SN (Figures 3H and P) and the ASBPD was negatively correlated with the SNR in the medial anterior SN (example subscores are shown in Figures 3A-B, E-F, I-J, M-N).
Conclusions
Using a study-specific brain template, we have shown the spatiotemporal pattern of SN loss in patients with iRBD and PD and, based on the SN volume decrease over time, estimated that, at their baseline visit, iRBD patients were at ~5 years before the onset of PD. We have also shown that the voxel-wise correlation between the SNR of NM-MRI and distinct clinical scores was localised in distinct areas of the SN, possibly reflecting the functional organisation of the nigrostriatal system3.Acknowledgements
This study was funded by grants from ANR Nucleipark, DHOS-Inserm, France Parkinson, École des NeuroSciences de Paris (ENP), Fondation pour la Recherche Médicale (FRM), and the Investissements d'Avenir, IAIHU-06 (Paris Institute of Neurosciences – IHU), ANR-11-INBS-0006, Fondation d’Entreprise EDF, Biogen Inc., Fondation Thérèse and René Planiol, Unrestricted support for Research on Parkinson’s disease from Energipole (M. Mallart) and Société Française de Médecine Esthétique (M. Legrand). The authors would like to thank all the subjects who participated in this study.References
1. Greffard S, Verny M, Bonnet AM, et al. Motor score of the Unified Parkinson Disease Rating Scale as a good predictor of Lewy body-associated neuronal loss in the substantia nigra. Arch Neurol 2006;63:584-588.
2. Cheng HC, Ulane CM, Burke RE. Clinical progression in Parkinson disease and the neurobiology of axons. Ann Neurol 2010;67:715-725.
3. Haber, S.N., 2014. The place of dopamine in the cortico-basal ganglia circuit. Neuroscience 282, 248–257.
4. Sulzer D, Cassidy C, Horga G, et al. Neuromelanin detection by magnetic resonance imaging (MRI) and its promise as a biomarker for Parkinson's disease. NPJ Parkinsons Dis 2018;4:11.
5. Goetz CG, Tilley BC, Shaftman SR, et al. Movement Disorder Society-sponsored revision of the Unified Parkinson's Disease Rating Scale (MDS-UPDRS): scale presentation and clinimetric testing results. Mov Disord 2008;23:2129-2170.
6. Fahn S, Elton R, Members of the UPDRS Development Committee. Recent Developments in Parkinson's Disease. Florham Park, NJ: Macmillan Health Care Information, 1987.
7. Mattis S, Bellak L, Karasu TB. Mental Status Examination for Organic Mental Syndrome in the Elderly Patient. Geriatric Psychiatry A Handbook for Psychiatrists and Primary Care Physicians. New York: Grune & Stratton, 1976.
8. Mattis S. Dementia Rating Scale. Professional manual.: Florida: Psychological Assessment Resources, 1988.
9. Ardouin C, Chereau I, Llorca PM, et al. [Assessment of hyper- and hypodopaminergic behaviors in Parkinson's disease]. Rev Neurol (Paris) 2009;165:845-856.
10. Rieu I, Martinez-Martin P, Pereira B, et al. International validation of a behavioral scale in Parkinson's disease without dementia. Mov Disord 2015;30:705-713.
11. Nasreddine ZS, Phillips NA, Bedirian V, et al. The Montreal Cognitive Assessment, MoCA: a brief screening tool for mild cognitive impairment. J Am Geriatr Soc 2005;53:695-699.
12. Pyatigorskaya N, Gaurav R, Arnaldi D, et al. Magnetic Resonance Imaging Biomarkers to Assess Substantia Nigra Damage in Idiopathic Rapid Eye Movement Sleep Behavior Disorder. Sleep 2017;40.
13. Ourselin S, Roche A, Subsol G, Pennec X, Ayache N. Reconstructing a 3D structure from serial histological sections. Image and Vision Computing 2001;19:25-31.
14. Modat M, Ridgway GR, Taylor ZA, et al. Fast free-form deformation using graphics processing units. Comput Methods Programs Biomed 2010;98:278-284.
15. Nichols TE, Holmes AP. Nonparametric permutation tests for functional neuroimaging: a primer with examples. Hum Brain Mapp 2002;15:1-25.
16. Postuma, R.B., Iranzo, A., Hu, M., et al., 2019. Risk and predictors of dementia and parkinsonism in idiopathic REM sleep behaviour disorder: a multicentre study. Brain 142, 744–759.
Figures
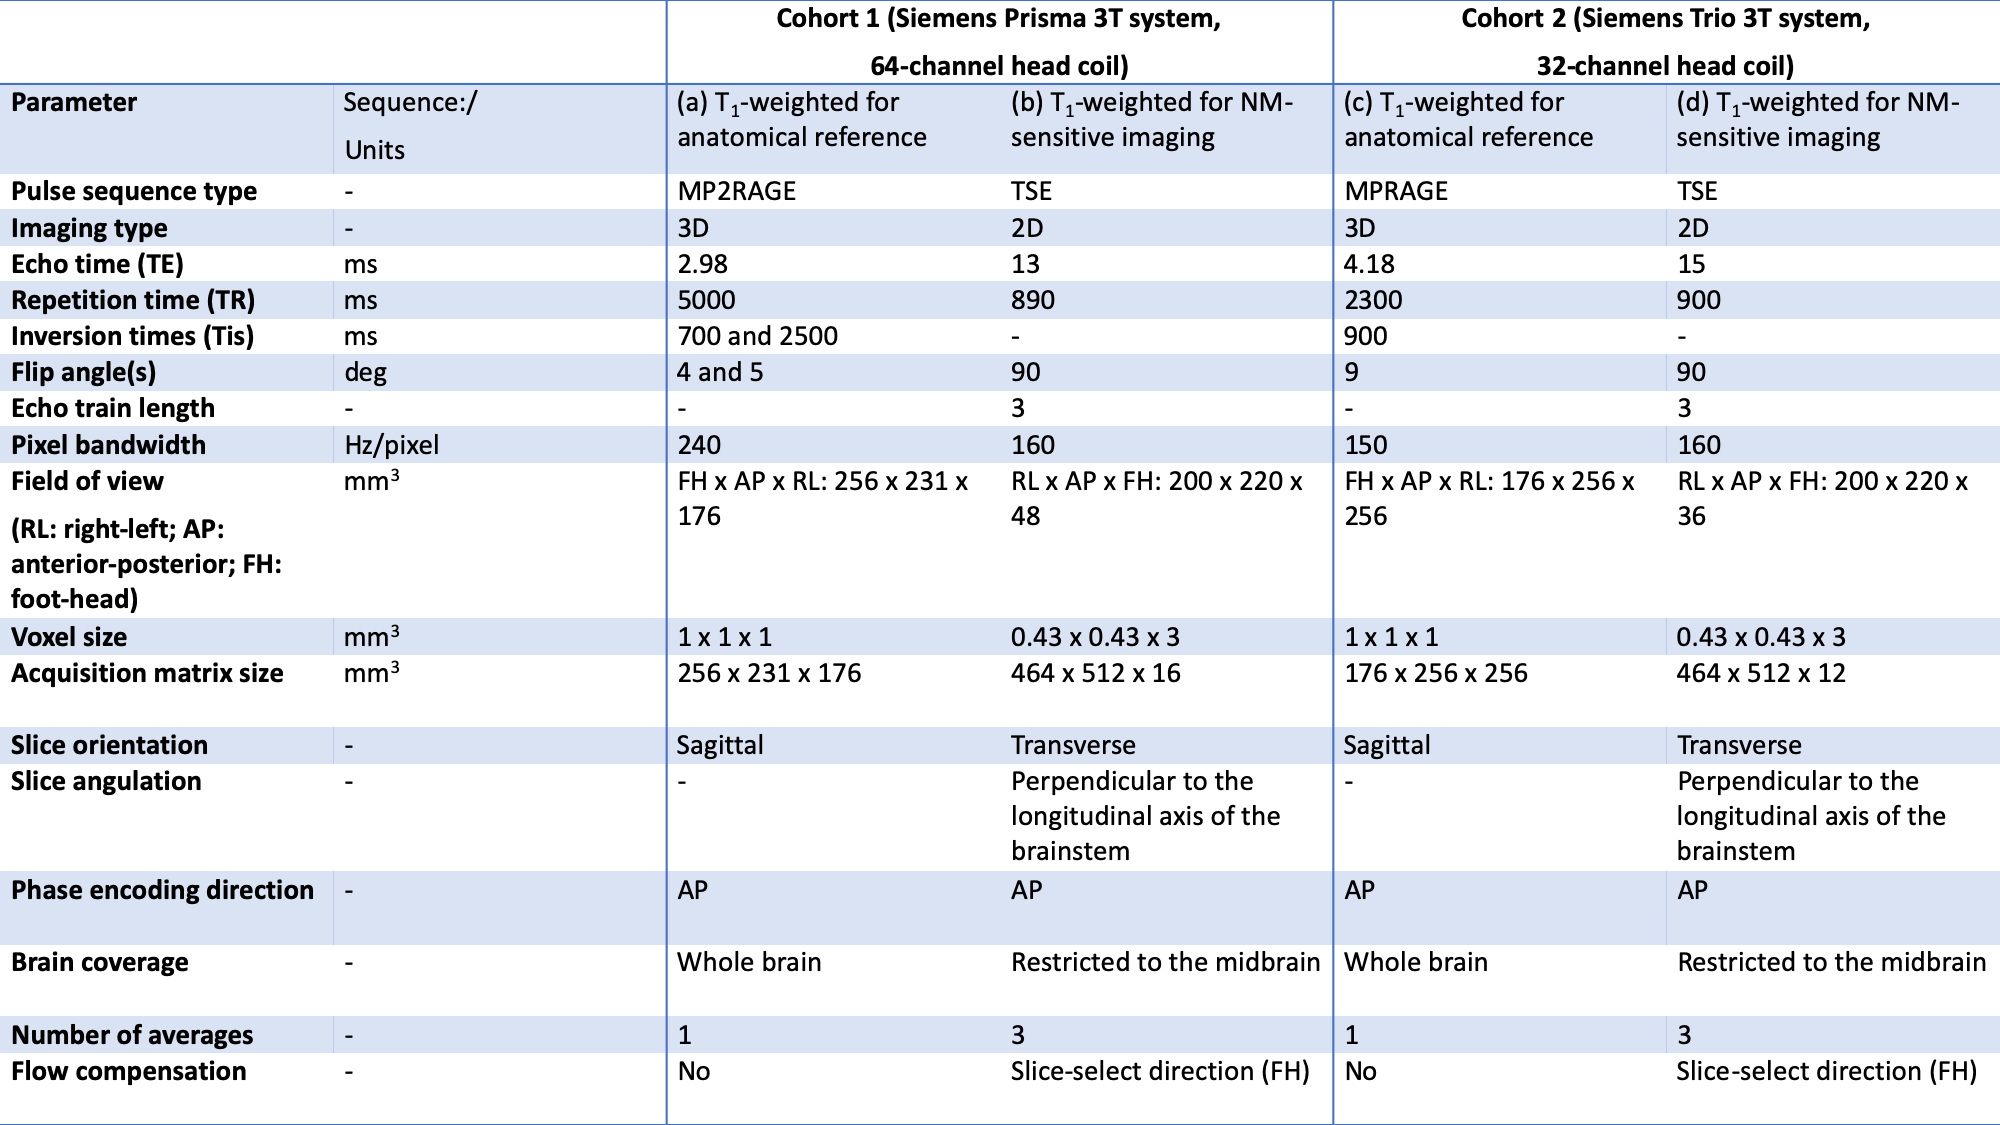
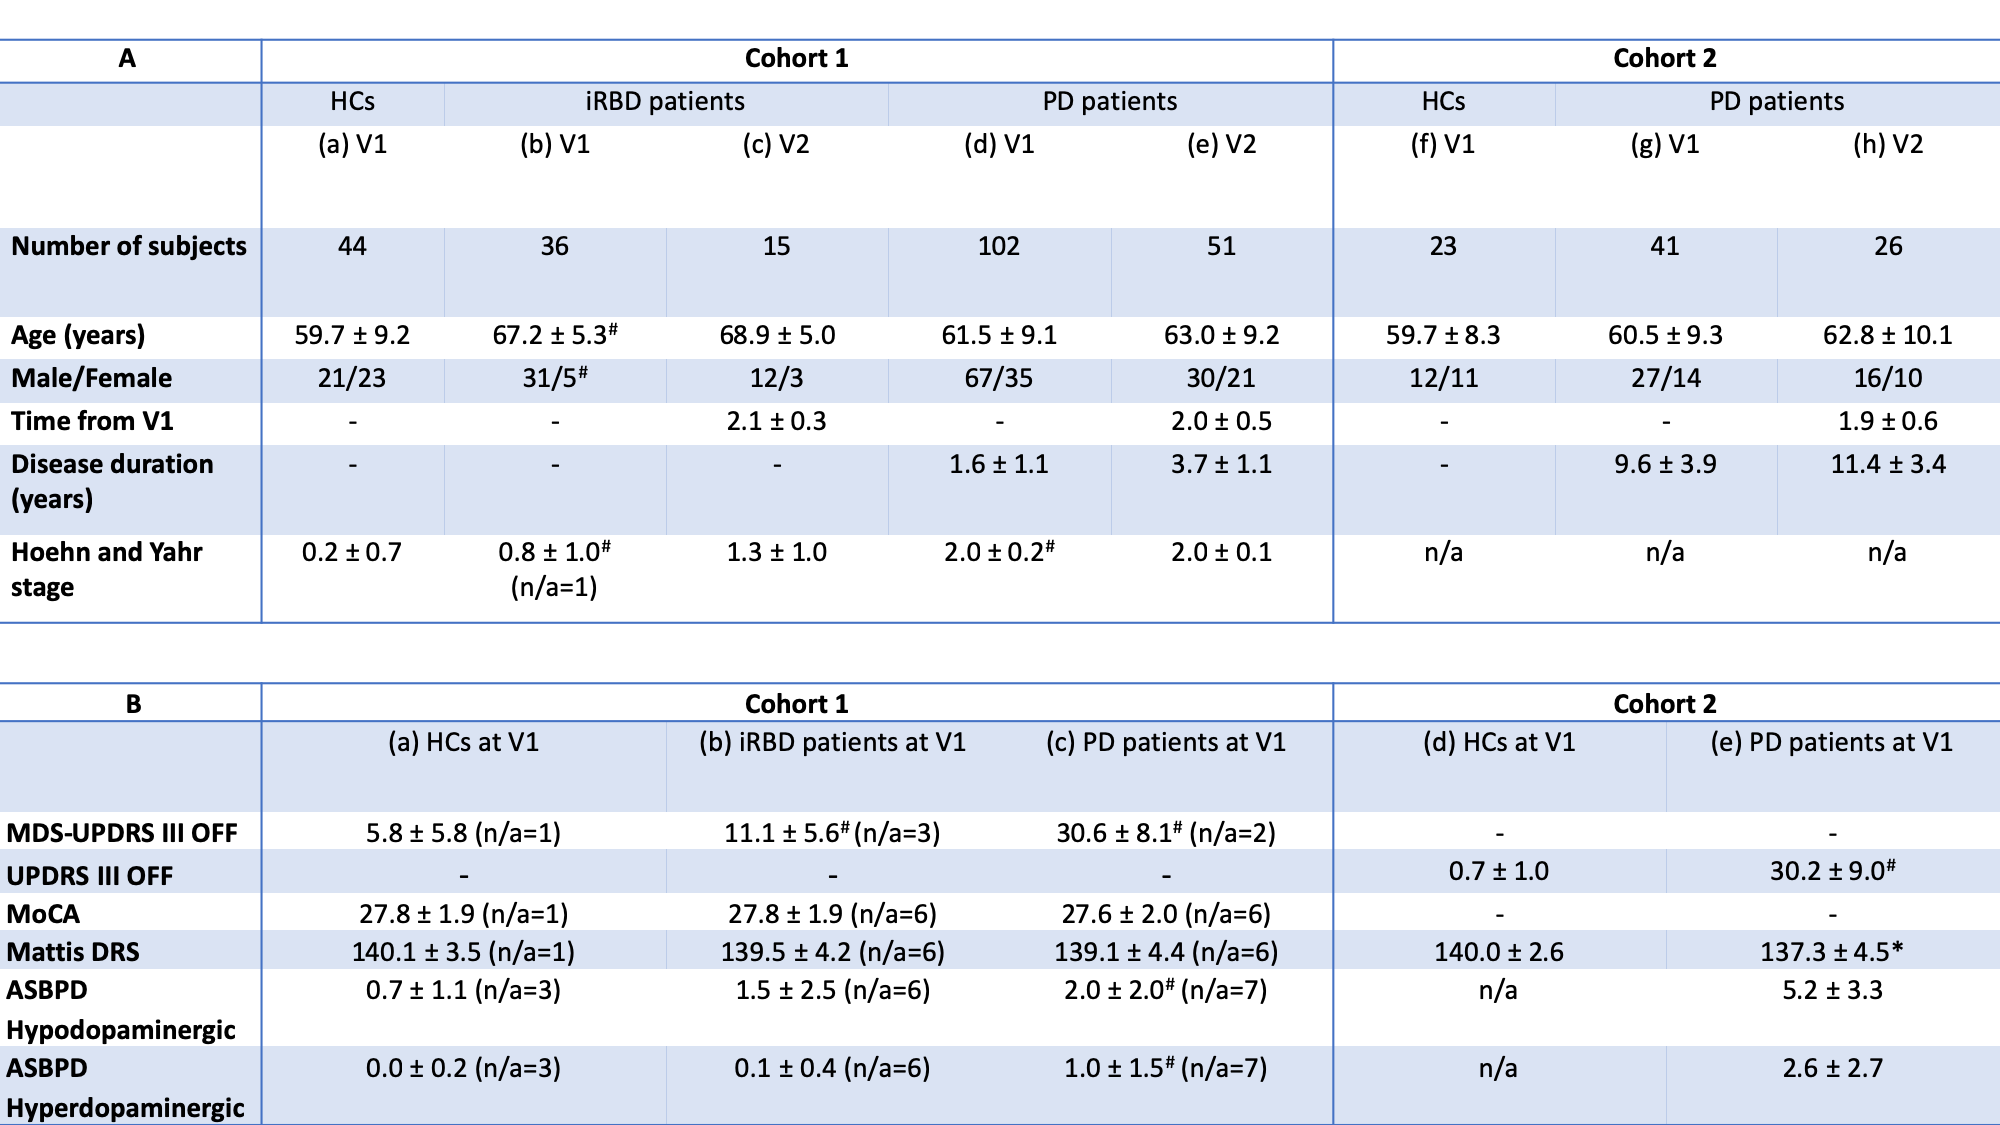
Table 2. Demographic and clinical characteristics of the cohorts being studied. The top table (A) shows the average demographical characteristics for each group of subjects at the baseline (V1) and follow-up visits (V2). The bottom table (B) shows the mean and standard deviation of the clinical characteristics at baseline.
In both tables, the ‘n/a’ denotes the number of subjects for which the information was not available.
Significant differences between iRBD or PD patients at V1 and the corresponding HCs at V1 are indicated using the * (p-value < 0.05) and # (p-value < 0.001) symbols.