0200
A multi-center study to investigate the relationship between iron content in deep gray matter nuclei and age1Department of Radiology, Ruijin Hospital, Shanghai Jiao Tong University School of Medicine, Shanghai, China, 2The MRI Institute for Biomedical Research, Magnetic Resonance Innovations, Inc., Detroit, MI, United States, 3Department of Radiology, Wayne State University, Detroit, MI, United States, 4Human Phenome Institute, Fudan University, Shanghai, China, 5Philips Healthcare, Shanghai, China
Synopsis
To investigate the correlation of iron content in deep gray matter nuclei as a function of age by reconstructed quantitative susceptibility mapping (QSM) using both whole-structural and regional perspectives from three different MRI sites and three different scanners to show that QSM is a robust technology across manufacturers and resolution.
Introduction
Iron is the most abundant transition metal in the brain, and plays a key role in a number of brain cellular processes including oxygen transport, electron transfer, neurotransmitter synthesis, myelin production, and mitochondrial function1, 2. A variety of magnetic resonance imaging (MRI) methods have been used to quantify the concentration of brain iron over the years including R2, R2*, phase, and quantitative susceptibility mapping (QSM)1. In theory, as a quantitative reconstruction method, QSM is independent of echo time, flip angle and field strength and ideally of the implementation of gradient echo imaging by manufactural vendors, but there is still a lack of large-scale data verification. This study investigated the correlation between iron content and age of healthy volunteers by reconstructing QSM using STrategically Acquired Gradient Echo (STAGE)3 data from different sites. The consistency of QSM quantification in multicenter was also evaluated for the 569 healthy adults.Methods
Data acquisition: A total of 569 healthy adults (mean age: 56.65± 12.63 years) were included from three sites: Dalian, Ruijin, and Zhengzhou, equipped with GE HDX 1.5T (173 cases), Philips Ingenia 3.0T (300 cases), and Siemens Prisma 3.0T (96 cases) scanners. Data were acquired using the following parameters: voxel sizes= 0.6x0.75x3 (=1.35mm³)/ 0.67x1.34x2(=1.80mm³)/ 0.67x1.34x2(=1.80 mm³) and TRs= 53/20/20 ms TEs= 40/17.5/17.5 ms for each scanner, respectively.Quantitative analysis: The susceptibility maps were generated using the following steps: the brain extraction tool (BET) was used to isolate the brain tissue (threshold = 0.2, erode = 4 and island = 2000) using the first echo where the signal intensity is highest; a 3D phase unwrapping algorithm (3DSRNCP) to unwrap the original phase data; sophisticated harmonic artifact reduction (SHARP) to remove unwanted background fields (threshold = 0.05 and deconvolution kernel size = 6); and, finally, a truncated k-space division (TKD) based inverse filtering technique (threshold = 0.1) with an iterative approach (iteration threshold = 0.1 and number of iterations = 4) to reconstruct the susceptibility maps4.
Seven subcortical gray matter nuclei (GMN), caudate nucleus (CN), globus pallidus (GP), putamen (PUT), thalamus (THA), pulvinar thalamus (PT), red nucleus (RN) and substantia nigra (SN), were segmented manually based on their anatomical features in the susceptibility maps, and the susceptibility values in the regions of interest (ROIs) were assessed.
The 3D whole-structural measurements were used to determine age-related thresholds, which were applied to calculate the local iron deposition (RII: portion of the structure that contains iron concentration larger than three standard deviations above the mean, correcting for age). Age-susceptibility correlation was determined for each measured structure for both the whole-region and the high iron content region RII.
Statistical analysis: The statistical analysis was performed using MatLab R2013a (MathWorks, Natick, MA). P < 0.05 was considered significant. Pearson correlation analysis was applied to investigate the relation between susceptibility and age in each structure. R2 larger than 0.25 was considered a strong relationship. Linear regression models were used to fit the data.
Results
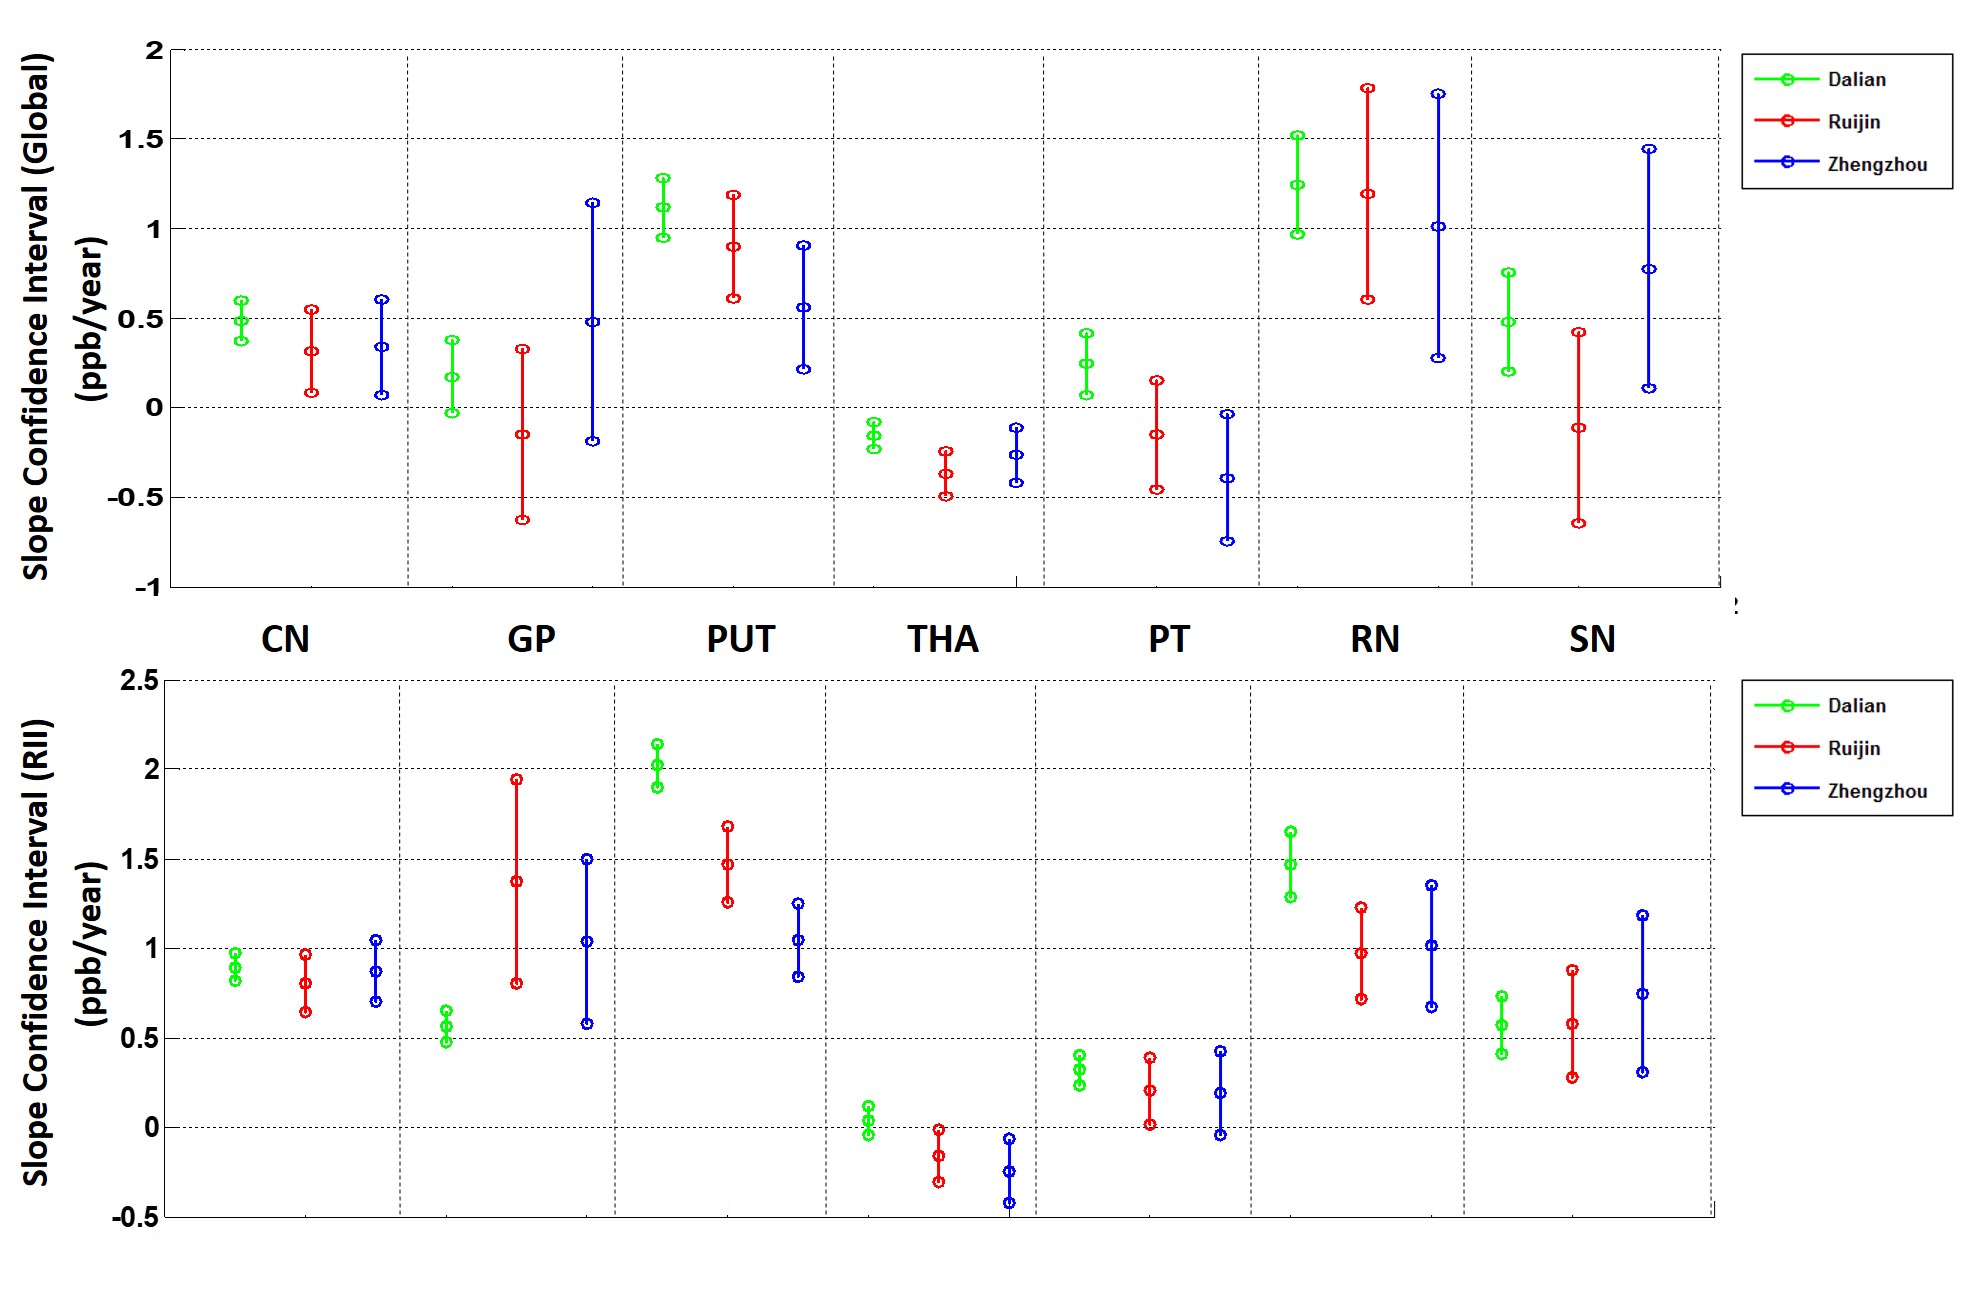
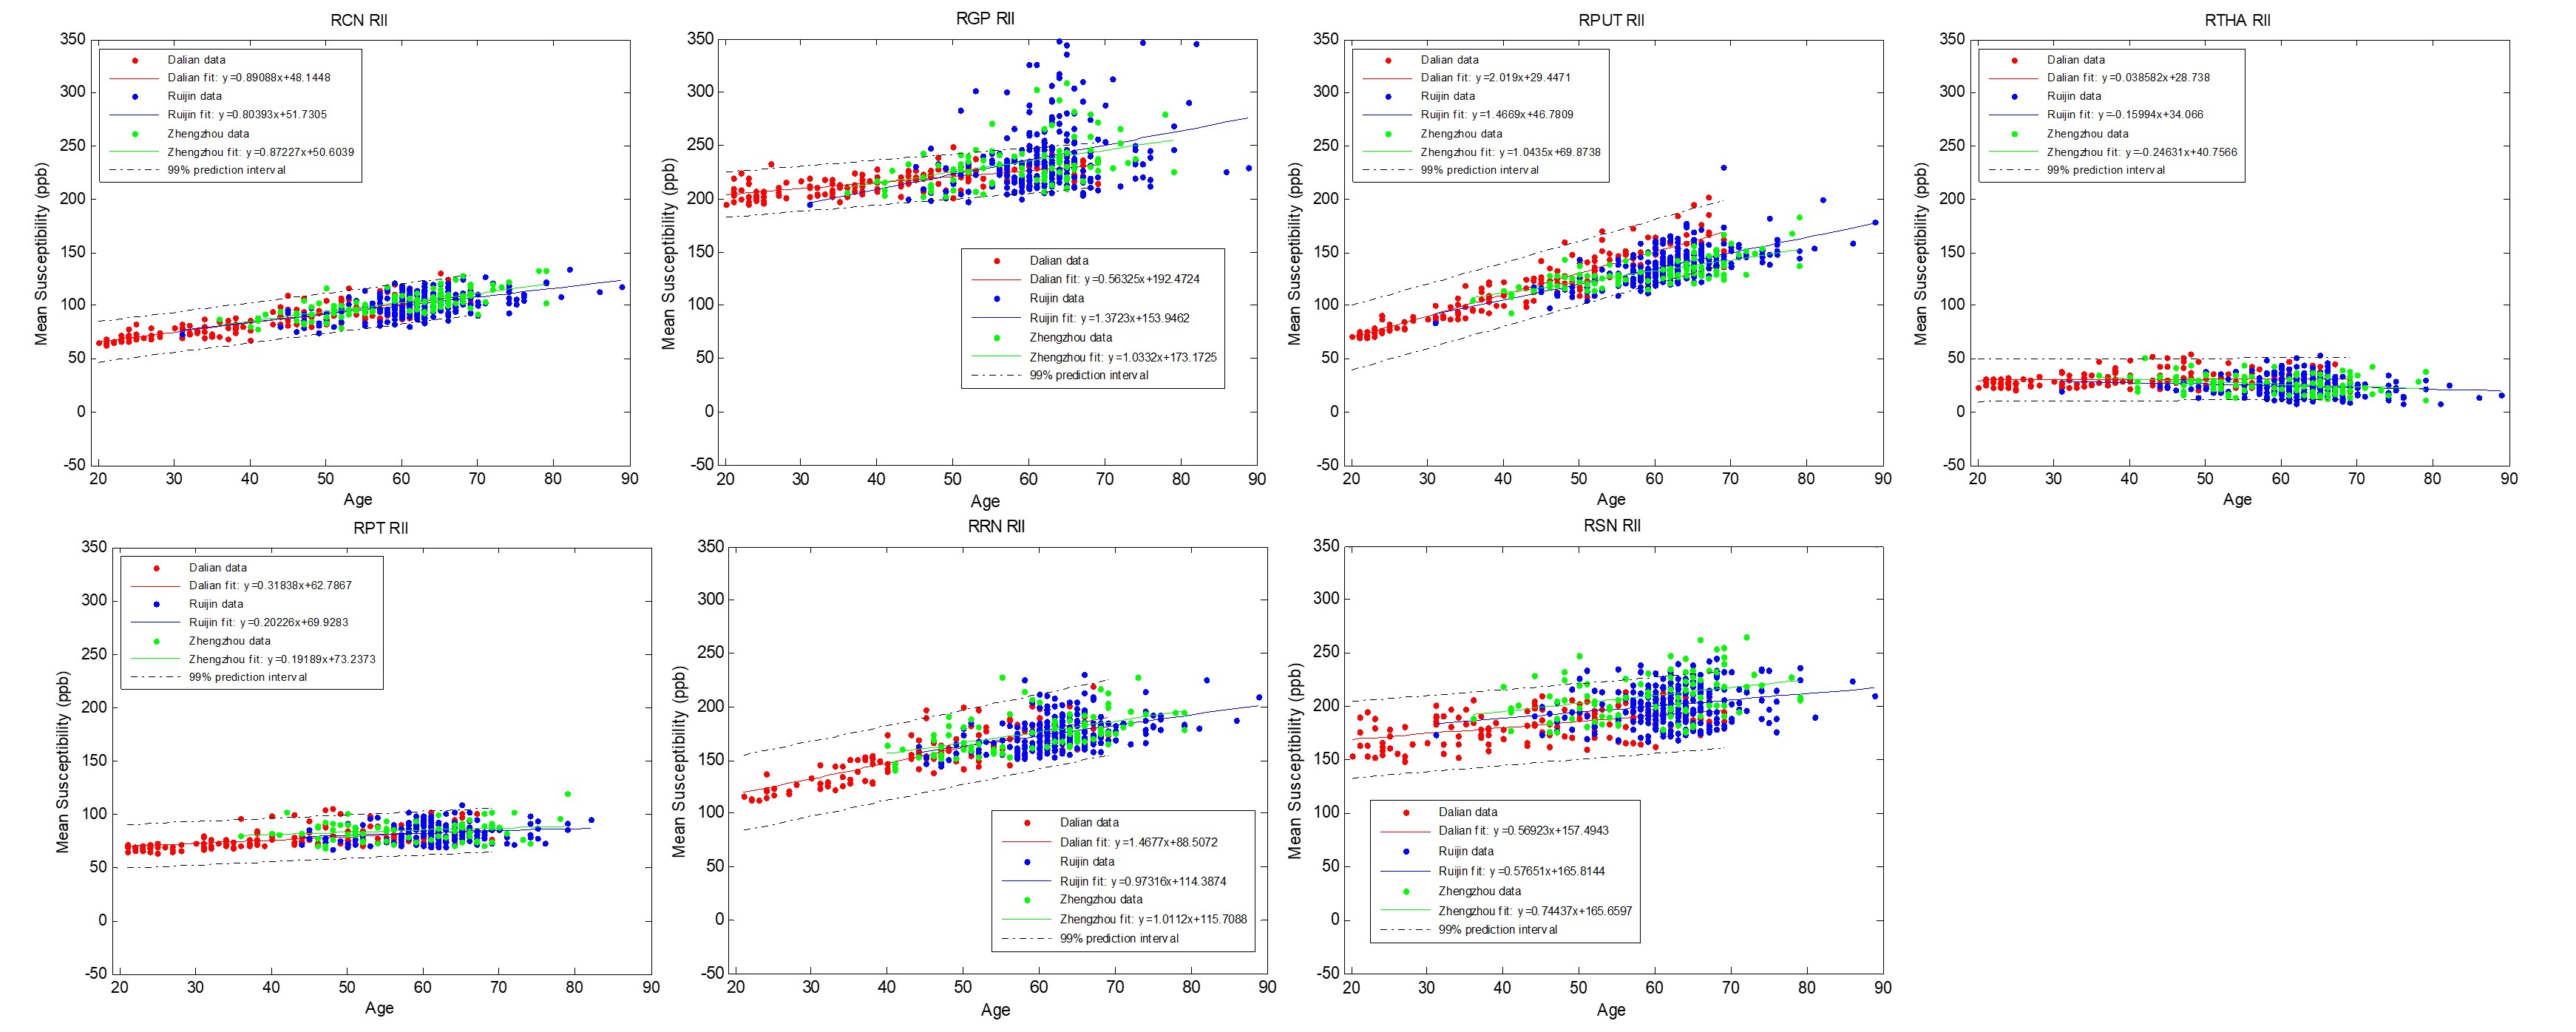
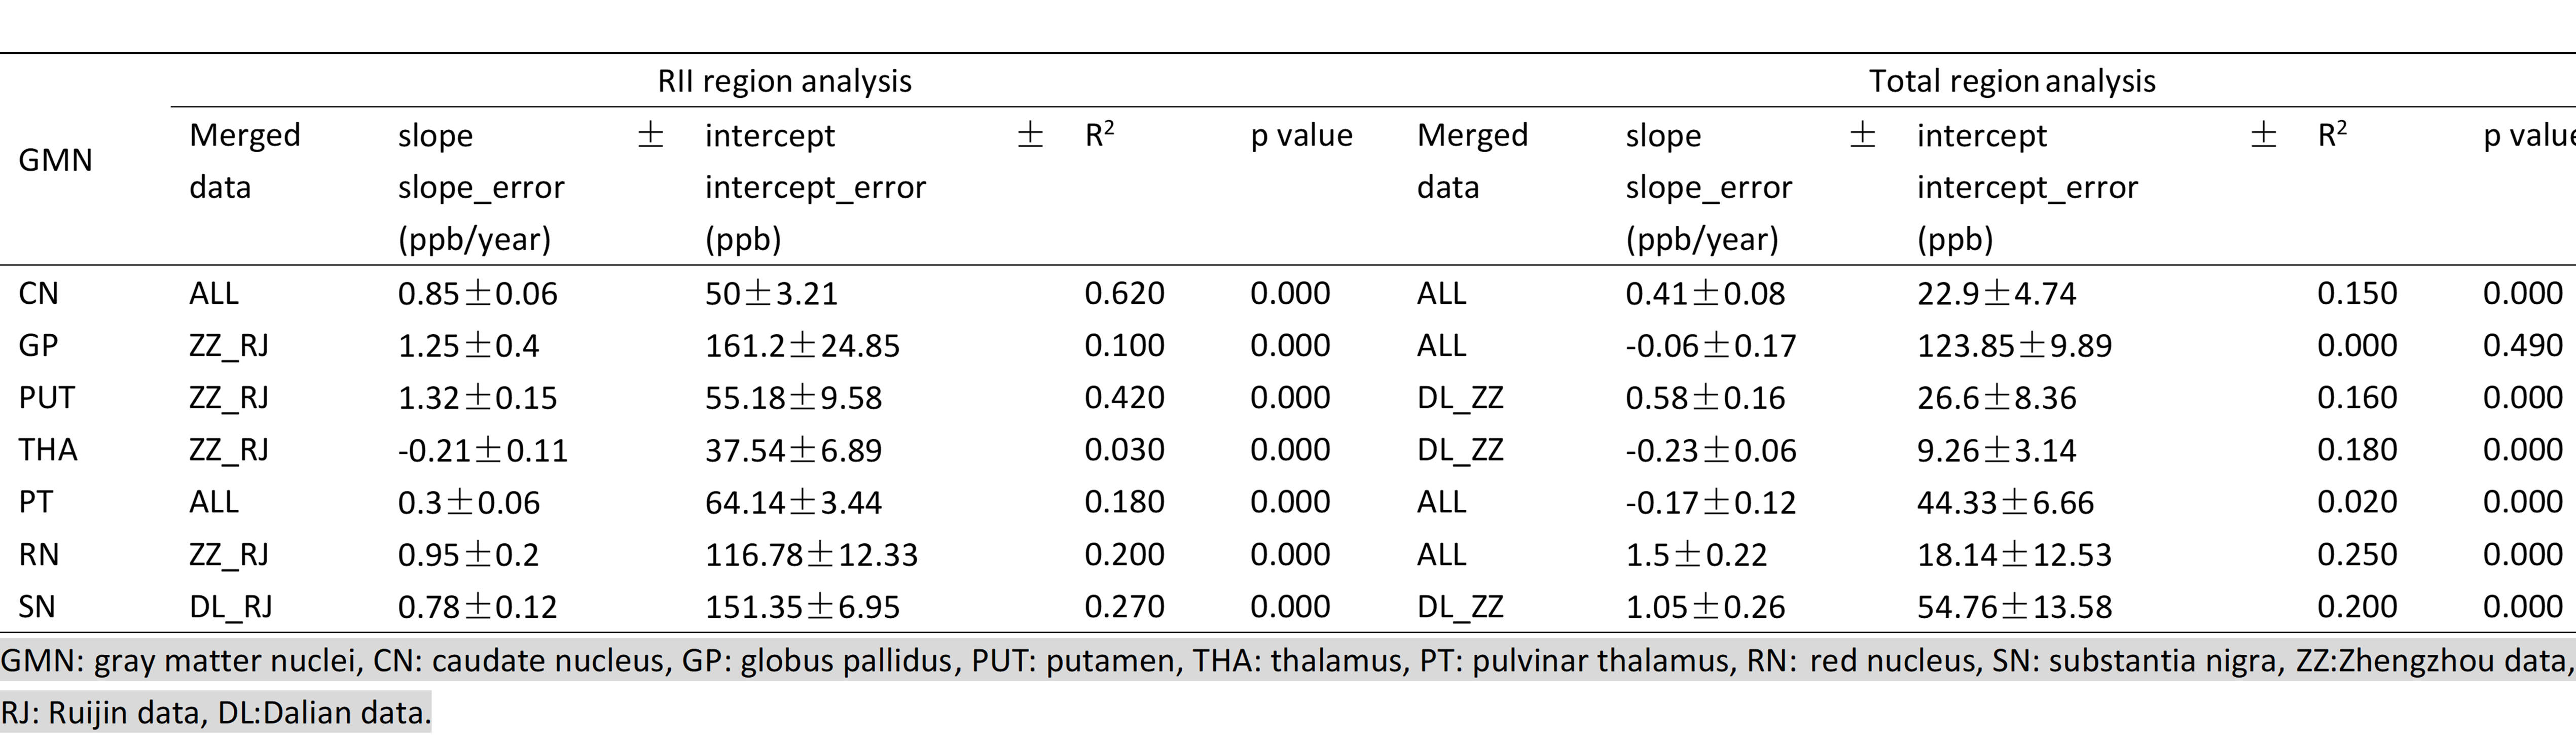
All sites showed a strong linear increase in iron over age for all structures except the THA. The slopes (ppb/year) between the sites overlapped for all structures except the PUT and PT for the total iron content and PUT for the RII analysis (see Figure 1). For region II analysis, the CN showed the strongest overlap in slopes (see Figure 2). Merging the data into a single large group led to the linear relationships shown in Table 1. Overall, for each structure analyzed in this study, the regional analysis showed a higher correlation coefficient and higher slope compared to the whole-region analysis.Discussion and Conclusions
Results show that the age-susceptibility correlation can serve as a quantitative magnetic susceptibility baseline as a function of age for monitoring abnormal global and regional iron deposition, which agrees with other studies4, 5. A regional analysis shows a tighter age-related behavior, providing a reliable and sensitive reference for what can be considered normal iron content for studies of neurodegenerative diseases. Some structures behaved identically between scanners while others had some variations in slope as a function of age. However, some of this variation may be due to the region of interest drawings and the populations chosen. The GP RII analysis shows many more high iron points in the Ruijin and Zhengzhou data, possibly caused by including the lower GP slices. Also, variation can occur as subjects get older, the calcification and mineralization may severely affect the QSM results. This study shows that although QSM has the potential to be a robust technology, great care must be taken in both assessing given structures and training those drawing the regions. Ideally, an automated means to assess the structures may improve the agreement between all structures.Acknowledgements
No acknowledgement found.References
1.Stankiewicz J, Panter S,Neema M et al. Iron in chronic brain disorders: imaging and neurotherapeutic implications.[J] .Neurotherapeutics, 2007, 4: 371-86.
2.Hare D, Ayton S, Bush A et al. A delicate balance: Iron metabolism and diseases of the brain.[J] .Front Aging Neurosci, 2013, 5: 34.
3.Chen Y, Liu S, Wang Y et al. STrategically Acquired Gradient Echo (STAGE) imaging, part I: Creating enhanced T1 contrast and standardized susceptibility weighted imaging and quantitative susceptibility mapping.[J] .Magn Reson Imaging, 2018, 46: 130-139.
4.Liu M, Liu S, Ghassaban Ket al. Assessing global and regional iron content in deep gray matter as a function of age using susceptibility mapping.[J] .J Magn Reson Imaging, 2016, 44: 59-71.
5.Aquino D, Bizzi A, Grisoli M et al. Age-related iron deposition in the basal ganglia: quantitative analysis in healthy subjects.[J] .Radiology, 2009, 252: 165-72.
Figures