0199
Diffusion measures and Connectometry in the Human Hippocampal-Subfields Using Super-Resolution HYDI.1Department of Radiology and Imaging Sciences, Indiana University, Indianapolis, IN, United States, 2Indiana Alzheimer Disease Center, Indiana University, Indianapolis, IN, United States, 3LaBRI, UMR 5800, University of Bordeaux, Talence, France, 4LaBRI, UMR 5800, PICTURA, F-33400, CNRS, Talence, France
Synopsis
The aging process is known to cause morphological and structural alterations in the human brain. Using a sub-millimeter super-resolution hybrid diffusion imaging (HYDI), we studied the effects of aging on the structural connectivity between the hippocampal subfields as well as between the hippocampus and the cerebral cortex.
Introduction
The recent advancements in high-resolution anatomical magnetic resonance imaging (MRI) such as T1-weighted (T1W) or T2-weighted (T2W) imaging have enabled the feasibility of submillimeter in-plane resolution of the hippocampus, which has allowed the automatic segmentation of the hippocampal subfields1,2. Using anatomical MRI, most of the previous studies focused on the volumetric changes in the hippocampal subfields3,4. However, changes in specific hippocampal fiber pathways within the brain’s structural networks have not been closely investigated, largely due to the limited spatial resolution in diffusion MRI (dMRI). With an adequate spatial resolution, dMRI could provide microstructural measurements and the associated tractography for the in-vivo human hippocampal subfields. In this study, we used super-resolution hybrid diffusion imaging (HYDI) to study the effects of aging on diffusion metrics in the hippocampal subfields and on structural connectivity between the subfields.Methods
Patients: Twelve healthy participants were recruited from the Indiana Alzheimer Disease Center and communities. There were five participants with an age larger than 65 years old (73 +/- 9.9 years) and the remaining seven participants with an age less than 35 years old (28.6 +/- 4.2 years). Each group had two male participants. Imaging: MRI scans were performed on the participants in a Siemens MAGNETOM Prisma 3.0 T scanner. High-resolution T1W images were acquired with an MPRAGE sequence at 0.8 x 0.8 x 0.8 mm3 resolution, TR=2400 ms, TE=2.22 ms, TI=1000 ms, flip-angle=8°, 256 mm field-of-view, 208 slices, and GRAPPA acceleration iPAT= 2. A high-resolution Turbo-Spin-Echo T2W images were acquired with a high in-plane resolution of 0.4 x 0.4 mm in an oblique plane perpendicular to the main axis of the hippocampus, a slice thickness of 2 mm, TR=8310 ms, TE=50 ms, flip-angle=122°, 175 mm field-of-view, 32 slices, and GRAPPA acceleration iPAT=2. HYDI5,6 was performed with a single-shot spin-echo EPI sequence, a multiband factor of 3, TE=74.2 ms, and TR=4164 ms, 220 mm field of view, 114 slices, isotropic resolution of 1.25mm, and 10:51 (min: sec) acquisition time. The diffusion scheme included four shells of b-values 500, 800, 1600, 2600 s/mm2, a total of 134 diffusion-directions, and 8 non-diffusion weighted volumes. Two sets of data were acquired with reversed phase-encode blips. Preprocessing: All the DW-images were denoised from Rician noise using overcomplete local-Principal-Component-Analysis as proposed in7. FSL-topup and FSL-eddy8, part of the FSL package version 6.0.0 (FMRIB, Oxford, UK), were used to correct motion, susceptibility, and eddy current distortions. To achieve super-resolution, a collaborative-patch-based-method9 was then used to bring the 1.25 mm3 resolution HYDI data to a submillimeter resolution of 0.625 mm3. This submillimeter diffusion data was then used to compute diffusion tensor imaging (DTI) metrics and neurite density and orientation dispersion imaging (NODDI) metrics10. Post-processing: Figure 1 shows the workflow of the postprocessing. The high-resolution T1W and T2W images were used for segmenting the hippocampal subfields with the Automatic Segmentation of Hippocampal Subfields (ASHS) method2. The hippocampal subfields were transformed from the T2W image space to the super-resolution diffusion space using ANTs11. In parallel, the HYDI multi-shell data was processed for tractography with generalized q-sampling imaging (GQI) approach12 and the hippocampal subfields as seed regions-of-interest (ROIs). Connectivity matrices (i.e., connectomes) were computed between the subfields and between the hippocampus and the cerebral cortices as in normalized streamline counts. Connectometry statistical analysis: To study the effect of aging on the hippocampus-cortex streamline connections, a group-wise connectometry analysis was used13,14. In this analysis, the diffusion data were reconstructed in the MNI space using q-space diffeomorphic reconstruction15 to obtain the spin distribution function12. The output resolution of the resampling to the MNI space is 1mm-isotropic. The quantitative anisotropy (QA)12 was extracted as the local connectome fingerprint14 and used in the connectometry analysis. The analysis used the MNI-space hippocampal regions16 as ROIs.Results
Figure 2 shows the diffusion metrics of each of the hippocampal subfields, including the Cornu-Ammonis subfields (CA1-3), dentate gyrus (DG), entorhinal cortex (ERC) and subiculum (SUB). The older participants had significantly lower DTI fractional anisotropy in the CA1, DG and CA3 (i.e., Welch two-sample t-test p-value < 0.05, without multiple-comparison correction). While not significant, a trend of lower NODDI intracellular volume fraction (ICVF) was observed in older participants. Figure 3a shows the connectivity matrices computed using the number of streamlines normalized by the volume of the subfields involved in each connection. Connectivity matrices were computed in the left and right hippocampal subfields in the older and younger groups; Figure 3b shows the non-zero connectivity vectors from the left and right hippocampi to cortical regions for both age groups. Figures 3,4 show a significantly weaker connection in the older participants, especially in the left hippocampus. The connectometry analysis depicted by Figure 5, shows that the QA was negatively correlated with the subjects’ age in each of the MNI-hippocampal ROIs with a false discovery rate (FDR) that ranged between 0.0075 and 0.01.Discussion and Conclusion
Our study suggests that age decreases the structural organization inside the hippocampal subfields as well as along the fiber tracks between the hippocampal subfields and the cerebral cortices with decreased FA and QA. This method holds promise for providing information regarding hippocampal integrity in Alzheimer’s disease.Acknowledgements
This work is supported by grant NIH NIA R01 AG053993.References
1. Van Leemput, K. et al., Automated segmentation of hippocampal subfields from ultra‐high resolution in vivo MRI. Hippocampus 19, 549-557 (2009).
2. Yushkevich, P. et al., Automated volumetry and regional thickness analysis of hippocampal subfields and medial temporal cortical structures in mild cognitive impairment. Hum Brain Mapp. 36, 258-287 (2015).
3. Malykhin, N., Huang, Y., Hrybouski, S. & Olsen, F., Differential vulnerability of hippocampal subfields and anteroposterior hippocampal subregions in healthy cognitive aging. Neurobiology of Aging 59, 121-134 (2017).
4. Daugherty, A., Bender, A., Raz, N. & Ofen, N., Age Differences in Hippocampal Subfield Volumes from Childhood to Late Adulthood. Hippocampus 220-228 (2), 26 (2016).
5. Wu, Y.-C. & Alexander, A. L., Hybrid diffusion imaging. NeuroImage 36, 617-629 (2007).
6. Wu, Y.-C., Field, A. S. & Alexander, A. L., Computation of diffusion function measures in q-space using magnetic resonance hybrid diffusion imaging. IEEE Trans Med Imaging 27 (6), 858-865 (2008).
7. Manjón, J., Coupé, P., Concha, L., Buades, A. & Collins, D., Diffusion weighted image denoising using overcomplete local PCA. PLoS ONE 8 (9) (2013).
8. Andersson, J., Graham, M., Zsoldos, E. & Sotiropoulos, S., Incorporating outlier detection and replacement into a non-parametric framework for movement and distortion correction of diffusion MR images. NeuroImage 141, 556-572 (2016).
9. Coupé, P., Manjón, J., Chamberland, M., Descoteaux, M. & Hiba, B., Collaborative patch-based super-resolution for diffusion-weighted images. NeuroImage 83, 245-261 (2013).
10. Lampinen, B. et al., Neurite density imaging versus imaging of microscopic anisotropy in diffusion MRI: A model comparison using spherical tensor encoding. NeuroImage 147, 517-531 (2017).
11. Avants, B. et al., A reproducible evaluation of ANTs similarity metric performance in brain image registration. Neuroimage 54, 2033-44 (2011).
12. Yeh, F., Wedeen, V. & Tseng, W., Generalized q-sampling imaging. IEEE Trans Med Imaging 29, 1626-1635 (2010).
13. http://dsi-studio.labsolver.org.
14. Yeh, F.-C. et al., Quantifying Differences and Similarities in Whole-Brain White Matter Architecture Using Local Connectome Fingerprints. PLoS Comput Biol 12 (11), e1005203 (2016).
15. Yeh, F. & Tseng, W., NTU-90: a high angular resolution brain atlas constructed by q-space diffeomorphic reconstruction. Neuroimage 58 (1), 91-99 (2011).
16. Kulaga-Yoskovitz, J. et al., Multi-contrast submillimetric 3 Tesla hippocampal subfield segmentation protocol and dataset. Scientific Data 10 (2), 150059 (2015).
Figures
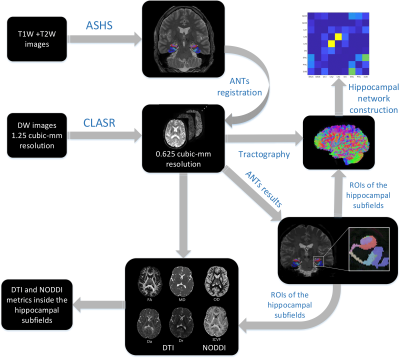
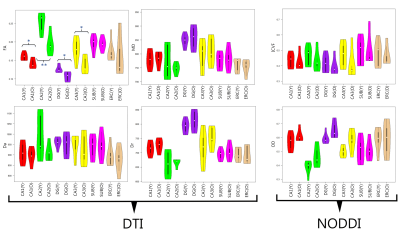
Figure 2. Violin plots showing diffusion metrics (i.e. DTI: FA, mean diffusivity (MD), axial diffusivity (Da), and radial diffusivity (Dr); and NODDI: orientation dispersion (OD) and intra-cellular volume fraction (ICVF)) between the older and younger groups in the left hippocampal subfields. Welch two sample t-test was applied to compare the groups, significant differences between older and younger groups were found in the FA values of CA1, CA2, DG and CA3 (* p-value , 0.05, ** p-value , 0.01). There were no significant differences between the two groups in other diffusion metrics.
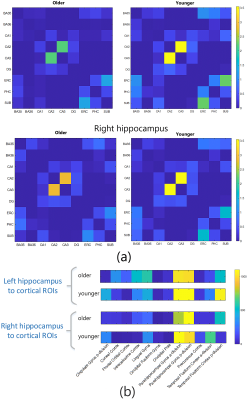
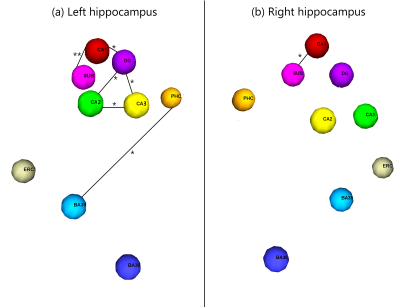
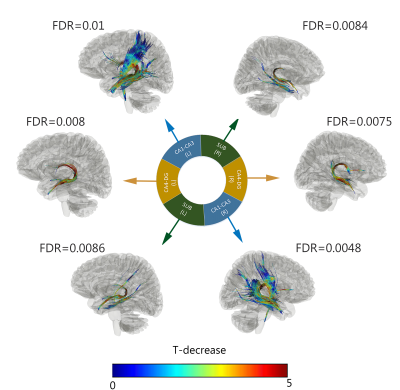
Figure 5. Connectometry analysis showing that the quantitative anisotropy (QA)12 was negatively correlated with the subjects’ age in each of the MNI-hippocampal ROIs with an FDR that ranges between (0.0075 and 0.01). These tracks included corpus callosum, left and right corticospinal tracts left and right corticothalamic pathway, left and right cingulum, left and right fornix, left and right optic nerves, left and right inferior longitudinal fasciculus, left and right trochlear. The tracks are color-coded with T statistics related to a negative correlation with QA.