0197
Measuring Biological Gradients along the Human Dorsal Striatum in vivo using Quantitative MRI1The Edmond and Lily Safra Center for Brain Sciences, The Hebrew University of Jerusalem, Jerusalem, Israel
Synopsis
To date there are no in vivo tools for quantifying spatial changes in the microstructure of subcortical gray-matter nuclei. We have developed a quantitative MRI tool, with which we measured variations along the human dorsal striatum, using quantitative T1. We found monotonic gradients along the main axes, consistent with known biological gradients of the striatum. In addition, we found effects of laterality, as well as aging effects. Our method can prove useful for detection and quantification of microstructural irregularities in the striatum in patients suffering from basal ganglia disorders, such as Parkinson’s disease and ADHD.
Introduction
The dorsal striatum is the main input structure of the basal ganglia and is critically involved in motor control and goal-directed behaviors 1. It is composed of the putamen and the caudate nucleus, which are heterogeneously organized, with structural and functional gradients along the anterior-posterior and medial-lateral axes 2-4. Irregularity in the organization of the striatum is linked to diseases of the basal ganglia and to age-related declines 5,6. Therefore, developing in vivo tools for measurement and quantification of the structural heterogeneity in the human striatum has great clinical importance. Quantitative magnetic resonance imaging (qMRI) parameters (e.g. T1) are sensitive to the micro-environment of brain tissue, allowing for “in vivo histology” of the human brain 7. There are several tools for measuring changes in qMRI parameters along white-matter tracts and across cortical layers 8,9. However, thus far there are no in vivo tools for quantifying variations in the microstructure of subcortical gray-matter nuclei. Here, we used qMRI to measure structural variations along the main axes of the human dorsal striatum in vivo, and to study their relation to aging.Methods
MRI acquisition - MRI measurements were performed on 20 young adults (aged 27 ± 2 years, 10 females) and 18 older adults (aged 67 ± 6 years, 5 females). The data were collected using a 3 T Siemens MAGNETOM Skyra scanner at the ELSC neuroimaging unit at the Hebrew University of Jerusalem. Data for quantitative T1 mapping were acquired using Siemens FLASH sequence, with SEIR data for B1+ bias correction. T1 maps were computed using mrQ 10.Brain segmentation - Segmentation of subcortical gray-matter structures was performed using FSL’s FIRST tool 11.
Gradients calculation - We have developed a tool for measuring and quantifying structural variations along the main axes of subcortical structures. In each region of interest, we measured the mean T1 in 7 segments along the three main axes of the structure. The axes were computed using singular value decomposition (SVD) of the voxels’ 3D position, and correspond to the anterior-to-posterior (a-p), ventral-to-dorsal (v-d) and medial-to-lateral (m-l) axes of each structure.
Results
In both the left putamen and left caudate, we found gradients of monotonic decrease in mean T1 along the a-p, v-d and m-l axes (Fig. 1). These gradients showed high reliability across subjects, and were evident in both younger and older adults. Repeated measures ANOVA revealed large effects of spatial heterogeneity in mean T1 along the a-p, v-d and m-l axes of the left putamen (𝜂2 effect sizes of .81, .63 and .76, respectively, with p-values <.001), and along the a-p and m-l axes of the left caudate (𝜂2=.4, p<.005 and 𝜂2=.75, p<.001).In the putamen we found high inter-hemispheric agreement, with mean absolute errors (MAE) smaller than 10 milliseconds in each axis. In contrast, the caudate showed clear asymmetry between hemispheres (MAE = 31.1, 11.3 and 40.4 milliseconds in a-p, v-d and m-l axes, respectively; Fig. 2).
Mixed-design ANOVA revealed group differences between younger and older adults (Fig. 3). First, T1 values were generally higher in older adults. In addition, we found interaction effects between age group and segment along the v-d (F(6) = 5.5, p<.05) and m-l (F(6) = 5.7, p<.05) axes of the putamen. These results were validated and proved reliable on additional datasets.
Discussion
We have measured and quantified gradients of T1 along the main spatial axes of the putamen and the caudate nucleus in a group of 38 subjects. This is the first in vivo evidence for the gradual change in structure along the human dorsal striatum, using qMRI measures. Irregularities in the biological variation of the striatum were linked to disease of the basal ganglia and to aging-related declines 5,6. Our novel findings of interaction between age group and the T1 variation along the different segments suggest inhomogeneous manifestation of aging-related changes in the dorsal striatum.In addition, we found laterality effects of T1 gradients in the caudate nucleus. Studies suggest that structural asymmetries of the caudate relate to symptoms of attention deficit-hyperactivity disorder (ADHD) and to attentional problems in healthy individuals 12,13. Thus, the degree of asymmetry in the T1 gradients may have behavioral implications.
Conclusions
We have developed a tool and used it to measure structural gradients along the main axes of the human dorsal striatum in vivo using qMRI. The proposed qMRI measurement has great clinical importance. Evidently, we found that deviations from the typical gradients, as measured in healthy young adults, occur in normal aging. We expect that our tool will prove useful for other clinical populations, as well as for measurements other than T1, in additional subcortical regions. Future work will investigate irregularities of T1 gradients in patients suffering from movement and cognitive disorders of the basal ganglia, such as Parkinson’s disease and ADHD.Acknowledgements
No acknowledgement found.References
- Kravitz AV, Kreitzer AC. Striatal mechanisms underlying movement, reinforcement, and punishment. Physiology. 2012 Jun;27(3):167-77.
- Haber SN. Corticostriatal circuitry. Neuroscience in the 21st Century. 2016:1-21.
- Graybiel AM, Ragsdale CW. Histochemically distinct compartments in the striatum of human, monkeys, and cat demonstrated by acetylthiocholinesterase staining. Proceedings of the National Academy of Sciences. 1978 Nov 1;75(11):5723-6.
- Mestres-Missé A, Turner R, Friederici AD. An anterior–posterior gradient of cognitive control within the dorsomedial striatum. NeuroImage. 2012 Aug 1;62(1):41-7.
- Crittenden JR, Graybiel AM. Basal Ganglia disorders associated with imbalances in the striatal striosome and matrix compartments. Frontiers in neuroanatomy. 2011 Sep 7;5:59.
- Umegaki H, Roth GS, Ingram DK. Aging of the striatum: mechanisms and interventions. Age. 2008 Dec 1;30(4):251-61.
- Filo S, Shtangel O, Salamon N, Kol A, Weisinger B, Shifman S, Mezer AA. Disentangling molecular alterations from water-content changes in the aging human brain using quantitative MRI. Nature communications. 2019 Jul 30;10(1):3403.
- Yeatman JD, Dougherty RF, Myall NJ, Wandell BA, Feldman HM. Tract profiles of white matter properties: automating fiber-tract quantification. PloS one. 2012 Nov 14;7(11):e49790.
- Fukunaga M, Li TQ, van Gelderen P, de Zwart JA, Shmueli K, Yao B, Lee J, Maric D, Aronova MA, Zhang G, Leapman RD. Layer-specific variation of iron content in cerebral cortex as a source of MRI contrast. Proceedings of the National Academy of Sciences. 2010 Feb 23;107(8):3834-9.
- Mezer A, Yeatman JD, Stikov N, et al. Quantifying the local tissue volume and composition in individual brains with magnetic resonance imaging. Nature medicine. 2013 Dec;19(12):1667.
- Patenaude B, Smith SM, Kennedy DN, Jenkinson M. A Bayesian model of shape and appearance for subcortical brain segmentation. Neuroimage. 2011 Jun 1;56(3):907-22.
- Hynd GW, Hern KL, Novey ES, et al. Attention deficit-hyperactivity disorder and asymmetry of the caudate nucleus. Journal of Child Neurology. 1993 Oct;8(4):339-47.
- Dang LC, Samanez-Larkin GR, Young JS, et al. Caudate asymmetry is related to attentional impulsivity and an objective measure of ADHD-like attentional problems in healthy adults. Brain Structure and Function. 2016 Jan 1;221(1):277-86.
Figures
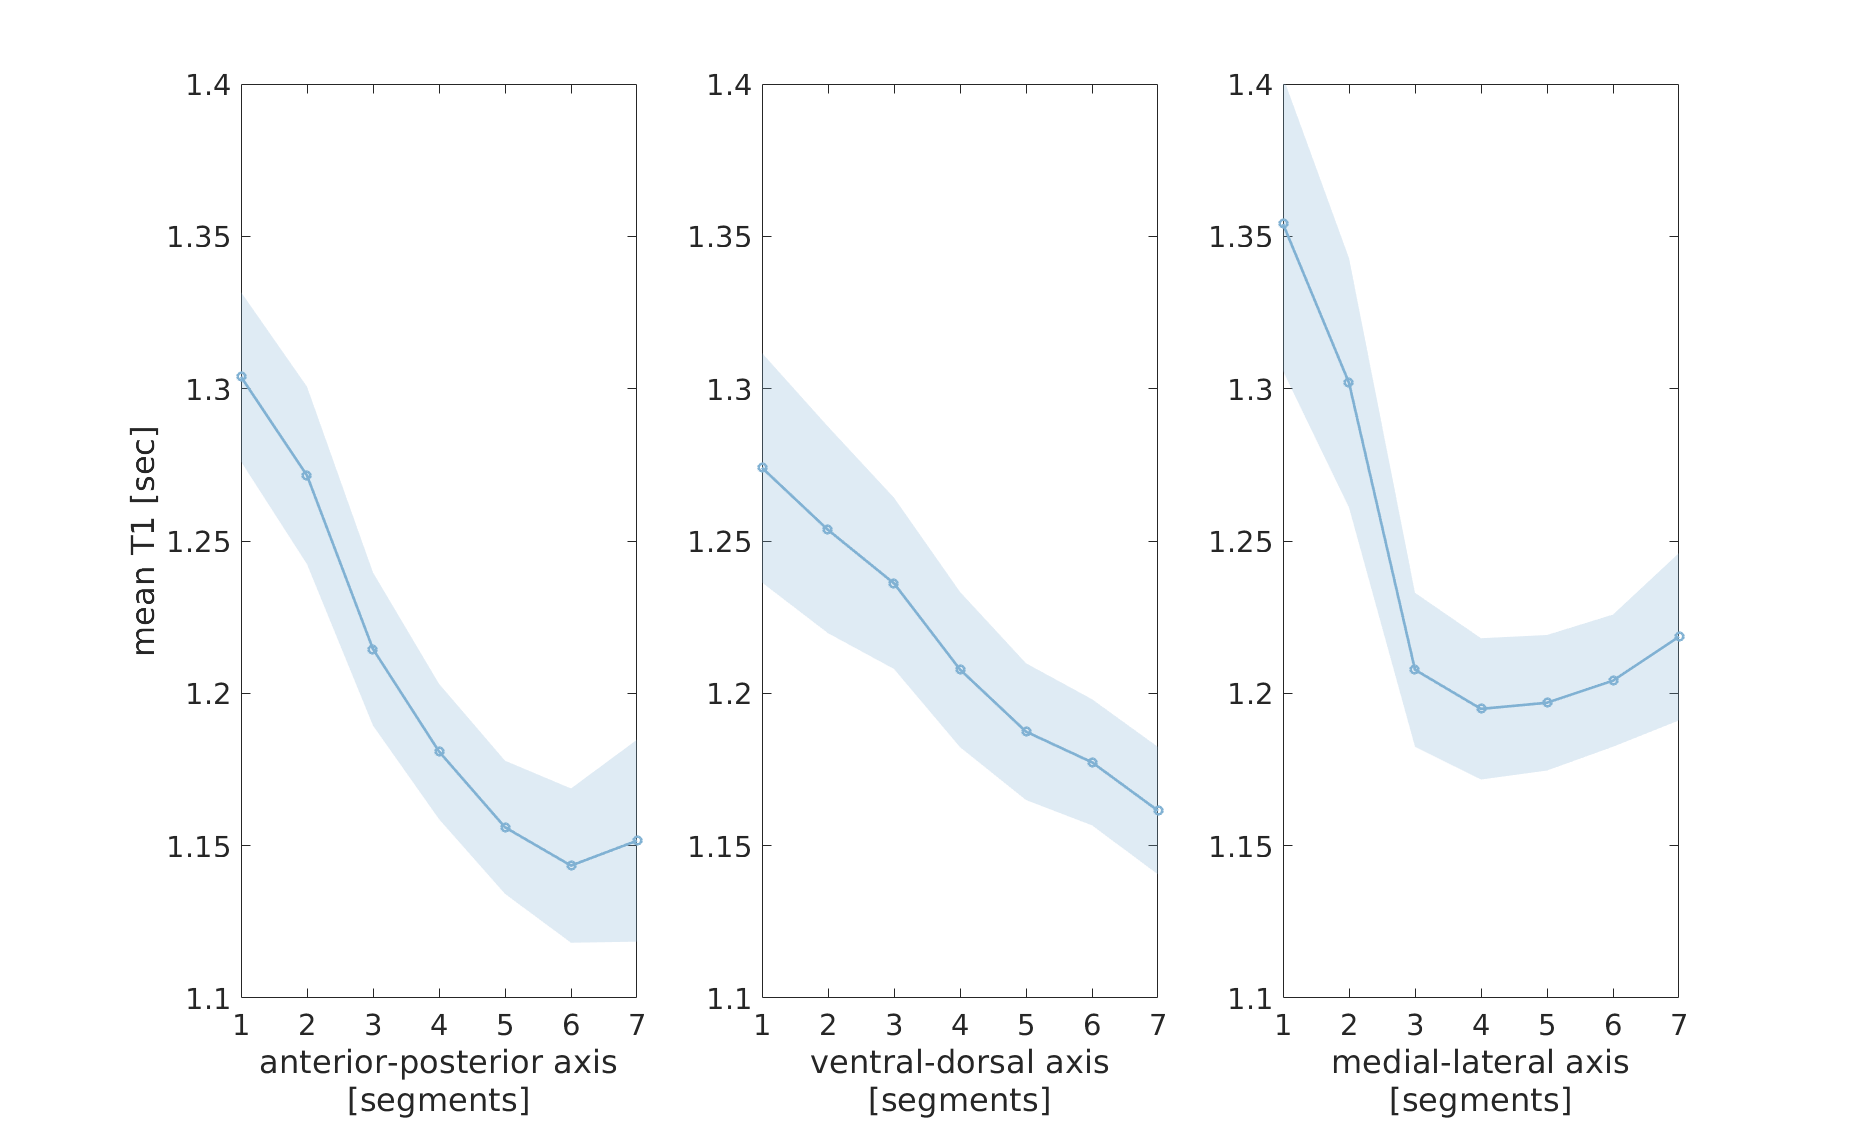
Figure 1 - T1 gradients along the main axes of the putamen
Mean T1 in segments along the anterior-posterior (left), the ventral-dorsal (middle) and the medial-lateral (right) axes of the left putamen, averaged across 18 healthy young adults. Shaded regions indicate ±1 standard deviation.
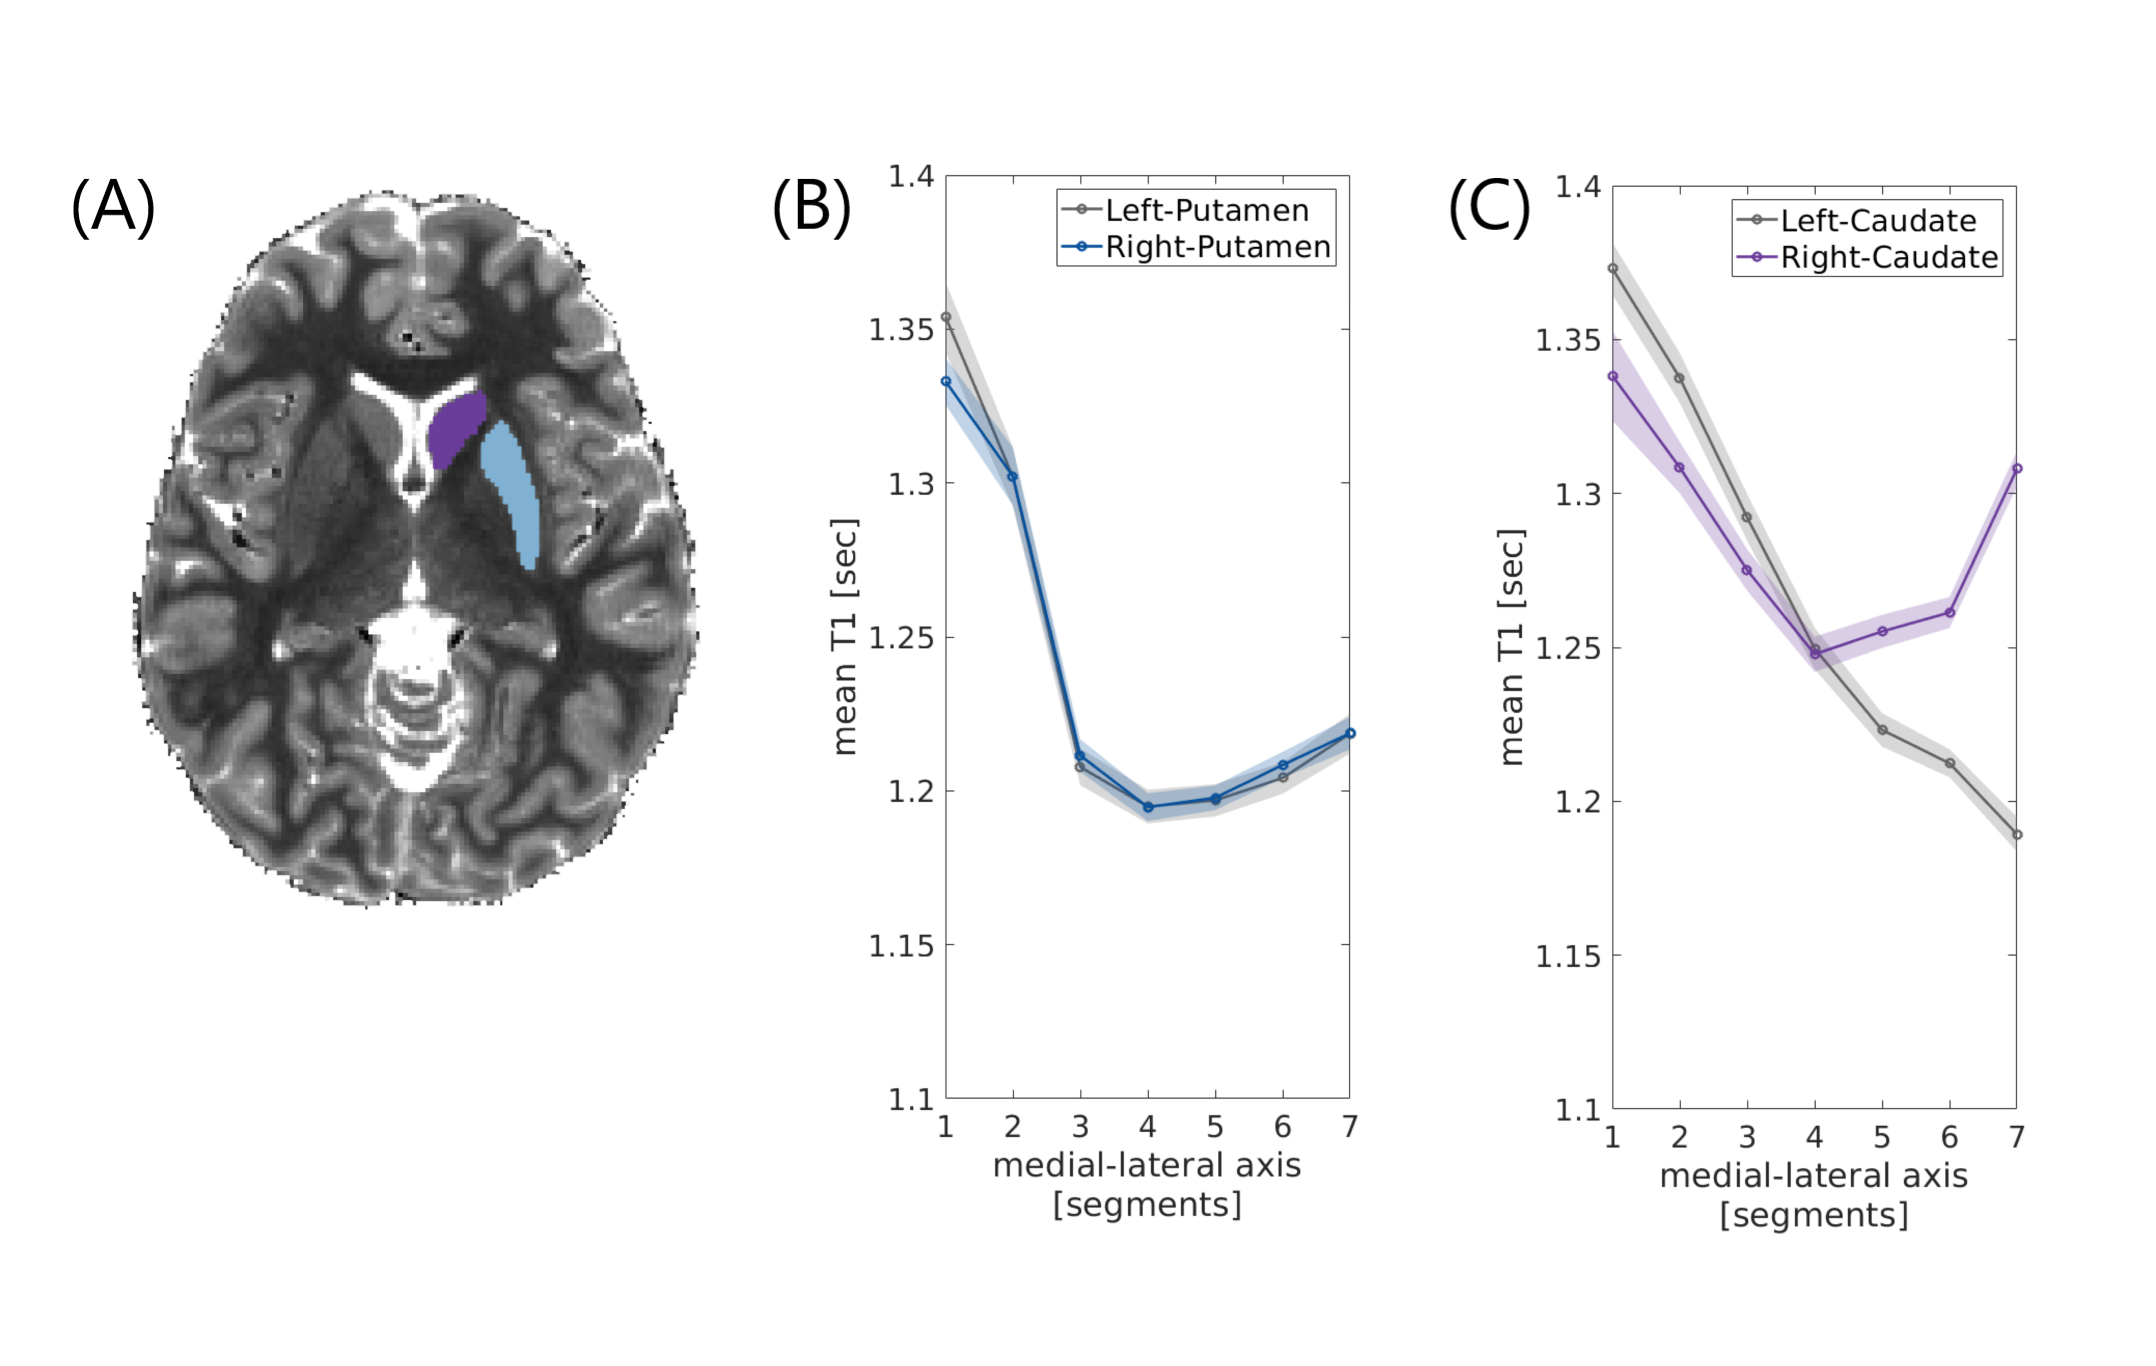
Figure 2 - Inter-hemispheric asymmetry in the caudate nucleus
(a) An axial slice of a T1 map of a representative subject, with masking of the right putamen (blue) and caudate (purple). (b, c) Mean T1 gradients along the medial-lateral axes of left and right putamen (a) and of left and right caudate (b) averaged across young adults (n=18; shaded regions indicate ±1 standard error of the mean). In the putamen, the mean absolute error (MAE) is 4.3 ms, while in the caudate the MAE is 40.4 ms.
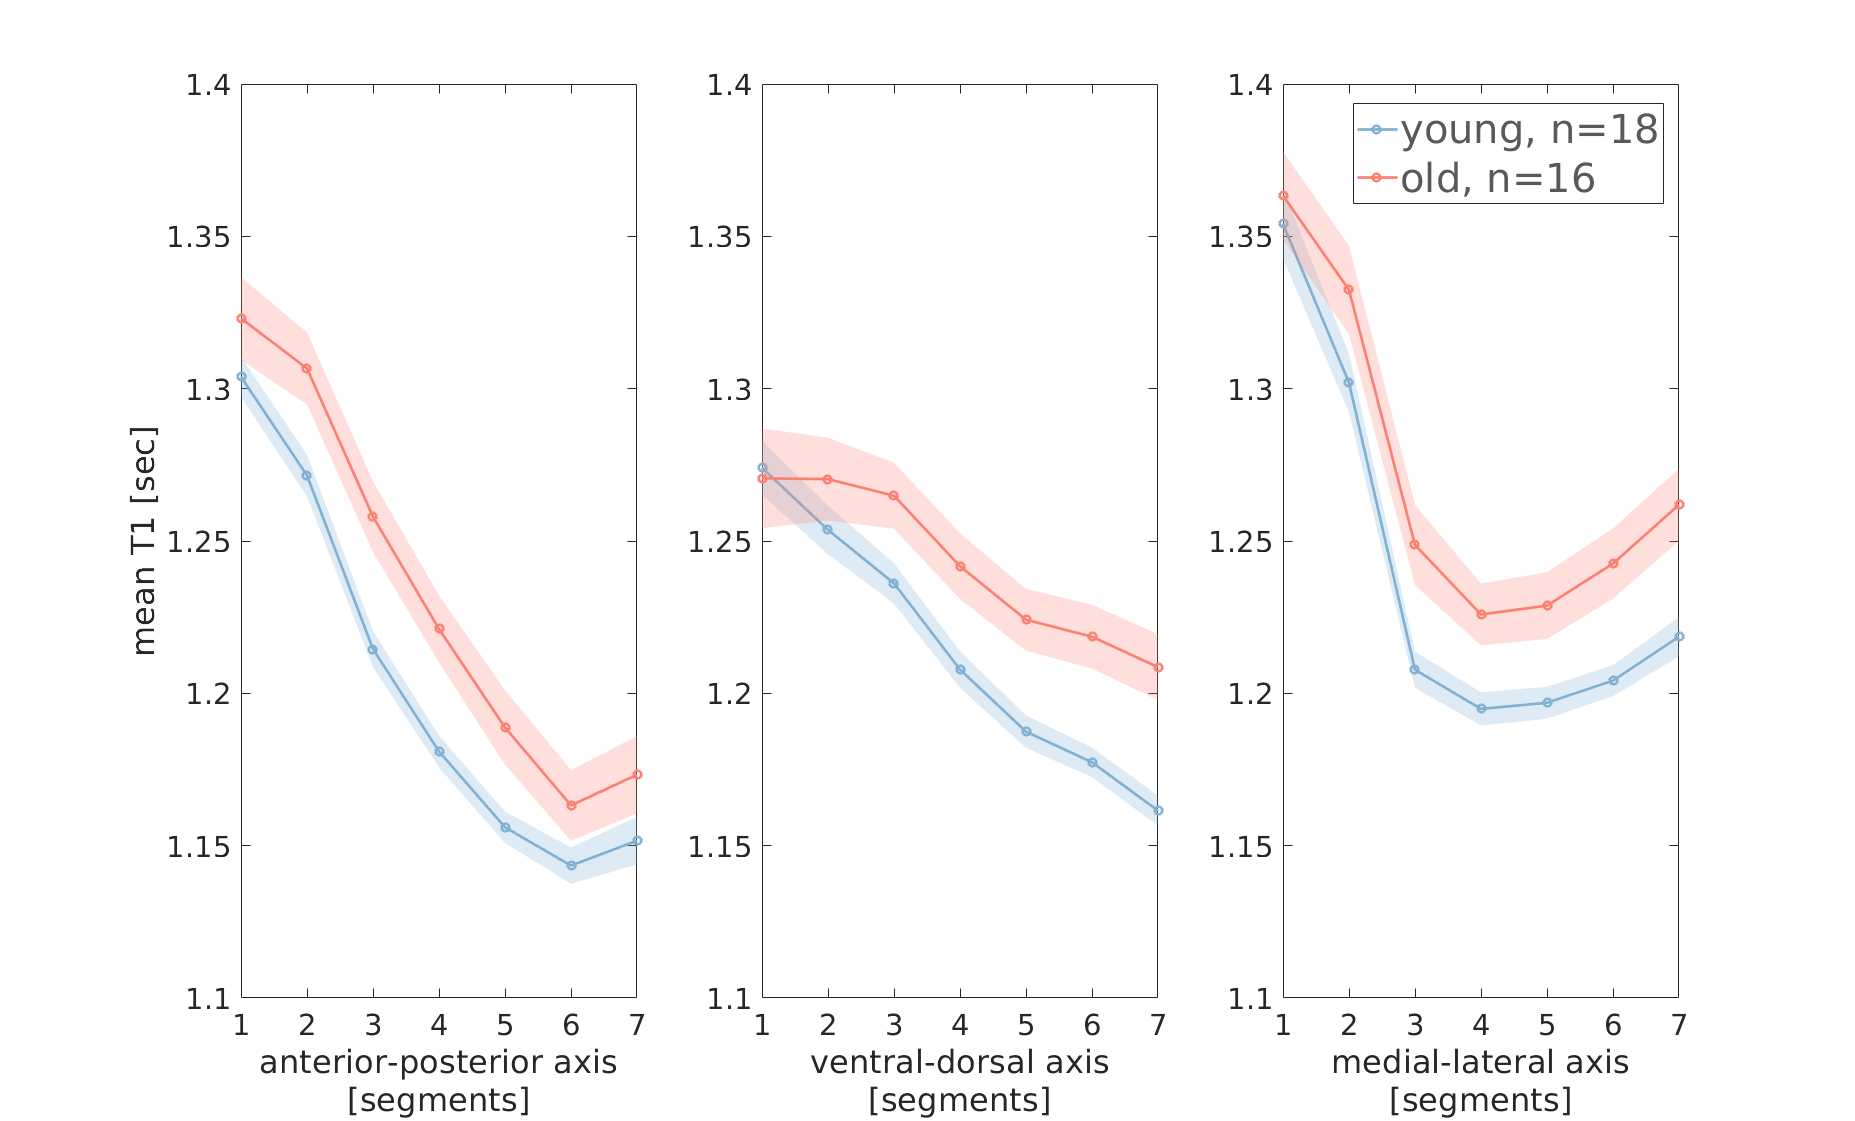
Figure 3 - Age group comparison of T1 gradients in the putamen
Mean T1 gradients in the left putamen are shown in young adults (blue) and older adults (red). shaded regions indicate ±1 standard error of the mean. Mean T1 values are higher in older adults. In the ventral-dorsal and medial-lateral axes, the T1 difference depends on the location along the axis, indicating an interaction effect between age group and the location of microstructural changes.