0195
Return-to-origin probability from single-shell and multi-shell diffusion MRI data correlates with normal aging1Martinos Center for Biomedical Imaging, Massachusetts General Hospital, Charlestown, MA, United States, 2Department of Radiology, Harvard Medical School, Boston, MA, United States, 3Department of Radiology, Stanford University, Stanford, CA, United States
Synopsis
Return-to-origin probability (RTOP) measures the overall restriction of the microstructural environment and has been used to map microstructural changes related to age and pathology. However, measurement of RTOP requires either specialized acquisition (Cartesian q-space sampling) or processing (q-space gridding or modelling). We show that RTOP from multi-shell data is a weighted summation of the spherical mean signal of each individual shell. We apply our method to a multi-shell dataset of 40 subjects with b-values up to 17,800 s/mm2 and a dataset of 160 subjects from Lifespan Human Connectome Project in Aging and demonstrate its utility in mapping age-related microstructural change.
Introduction
Healthy aging is associated with alterations in axonal integrity and myelination in cerebral white matter that likely contribute to changes in function throughout the lifespan. Diffusion tensor imaging (DTI) metrics have been studied extensively as measures of white matter integrity in normal aging1 but lack microstructural specificity. Q-space diffusion MRI (dMRI) offers a non-parametric approach to study microstructural changes in white matter using the Fourier relationship between the diffusion-weighted q-space signal and the diffusion displacement propagator. The return-to-origin probability (RTOP) measured by q-space dMRI quantifies the probability of water molecules undergoing zero net displacement within the diffusion time2, reflecting the overall restriction of the microstructural environment.RTOP has been used to study tissue restriction and cellularity in cerebral white matter maturation3 and degeneration in small- to moderate-sized cohorts of young, middle-aged and older adults4,5. RTOP can be calculated in a model-free fashion by summing the q-space signals acquired on a Cartesian grid such as those from diffusion spectrum imaging (DSI)6. However, single- and multi-shell data are more commonly acquired, which poses a barrier to directly calculating RTOP. Existing techniques for calculating RTOP from single-shell7 and multi-shell8-12 dMRI data impose a q-space signal model, relinquishing the benefits of model-free estimation and computational simplicity. In this study, we propose a model-free approach to calculate RTOP from single- and multi-shell dMRI data and apply this approach to study age-related changes in corpus callosum (CC) microstructure in a large-scale dataset from the Lifespan Human Connectome Project in Aging (HCP-A)13-15.
Methods
MGH-40 Data. 40 healthy adults (aged 22-72, 24F) underwent multi-shell dMRI on the MGH/USC 3T MRI scanner (Magnetom Skyra Connectom, Siemens). Whole-brain dMRI data were acquired at 2-mm isotropic resolution using a 2D DW-PGSE-EPI sequence (TR/TE=4000/77 ms, SMS=2, GRAPPA=2, 32 or 64 uniform diffusion-encoding directions with 7 b-values ranging from 950 to 17,800 s/mm2, 24 interspersed b=0 volumes and 5 reverse phase-encoding b=0 volumes16. T1-weighted images were acquired at 1-mm isotropic resolution using a multi-echo MPRAGE sequence.HCP-A Data. 100 healthy adults with normal cognition (aged 36-108, 81F) were scanned at MGH on a 3T MRI scanner (Magnetom Prisma, Siemens) as part of the HCP-A study13,14. Whole-brain dMRI data were acquired at 1.5-mm isotropic resolution using a 2D DW-PGSE-EPI sequence (TR/TE=3230/89.2 ms, SMS=4, uniform diffusion-encoding directions with 93×b=1,500, 92×b=3,000 s/mm2 and 14 interspersed b=0 volumes, each acquired with reversed phase-encoding direction). T1-weighted images were acquired using a multi-echo MPRAGE sequence.
Data Processing. dMRI data were corrected for susceptibility and eddy current-induced distortions. Fractional anisotropy (FA) and mean diffusivity (MD) maps were generated by DTI fitting performed on the b=950 s/mm2 data for the MGH-40 data and b=1,500 s/mm2 data for the HCP-A data. CC segmentation obtained from FreeSurfer was re-sampled to dMRI space using boundary-based registration. Voxels in the CC mask with FA<0.5 and MD<0.2 mm2/s were excluded to avoid partial-volume effects with CSF. Correlation analyses were performed between the ROI-averaged dMRI metrics and age.
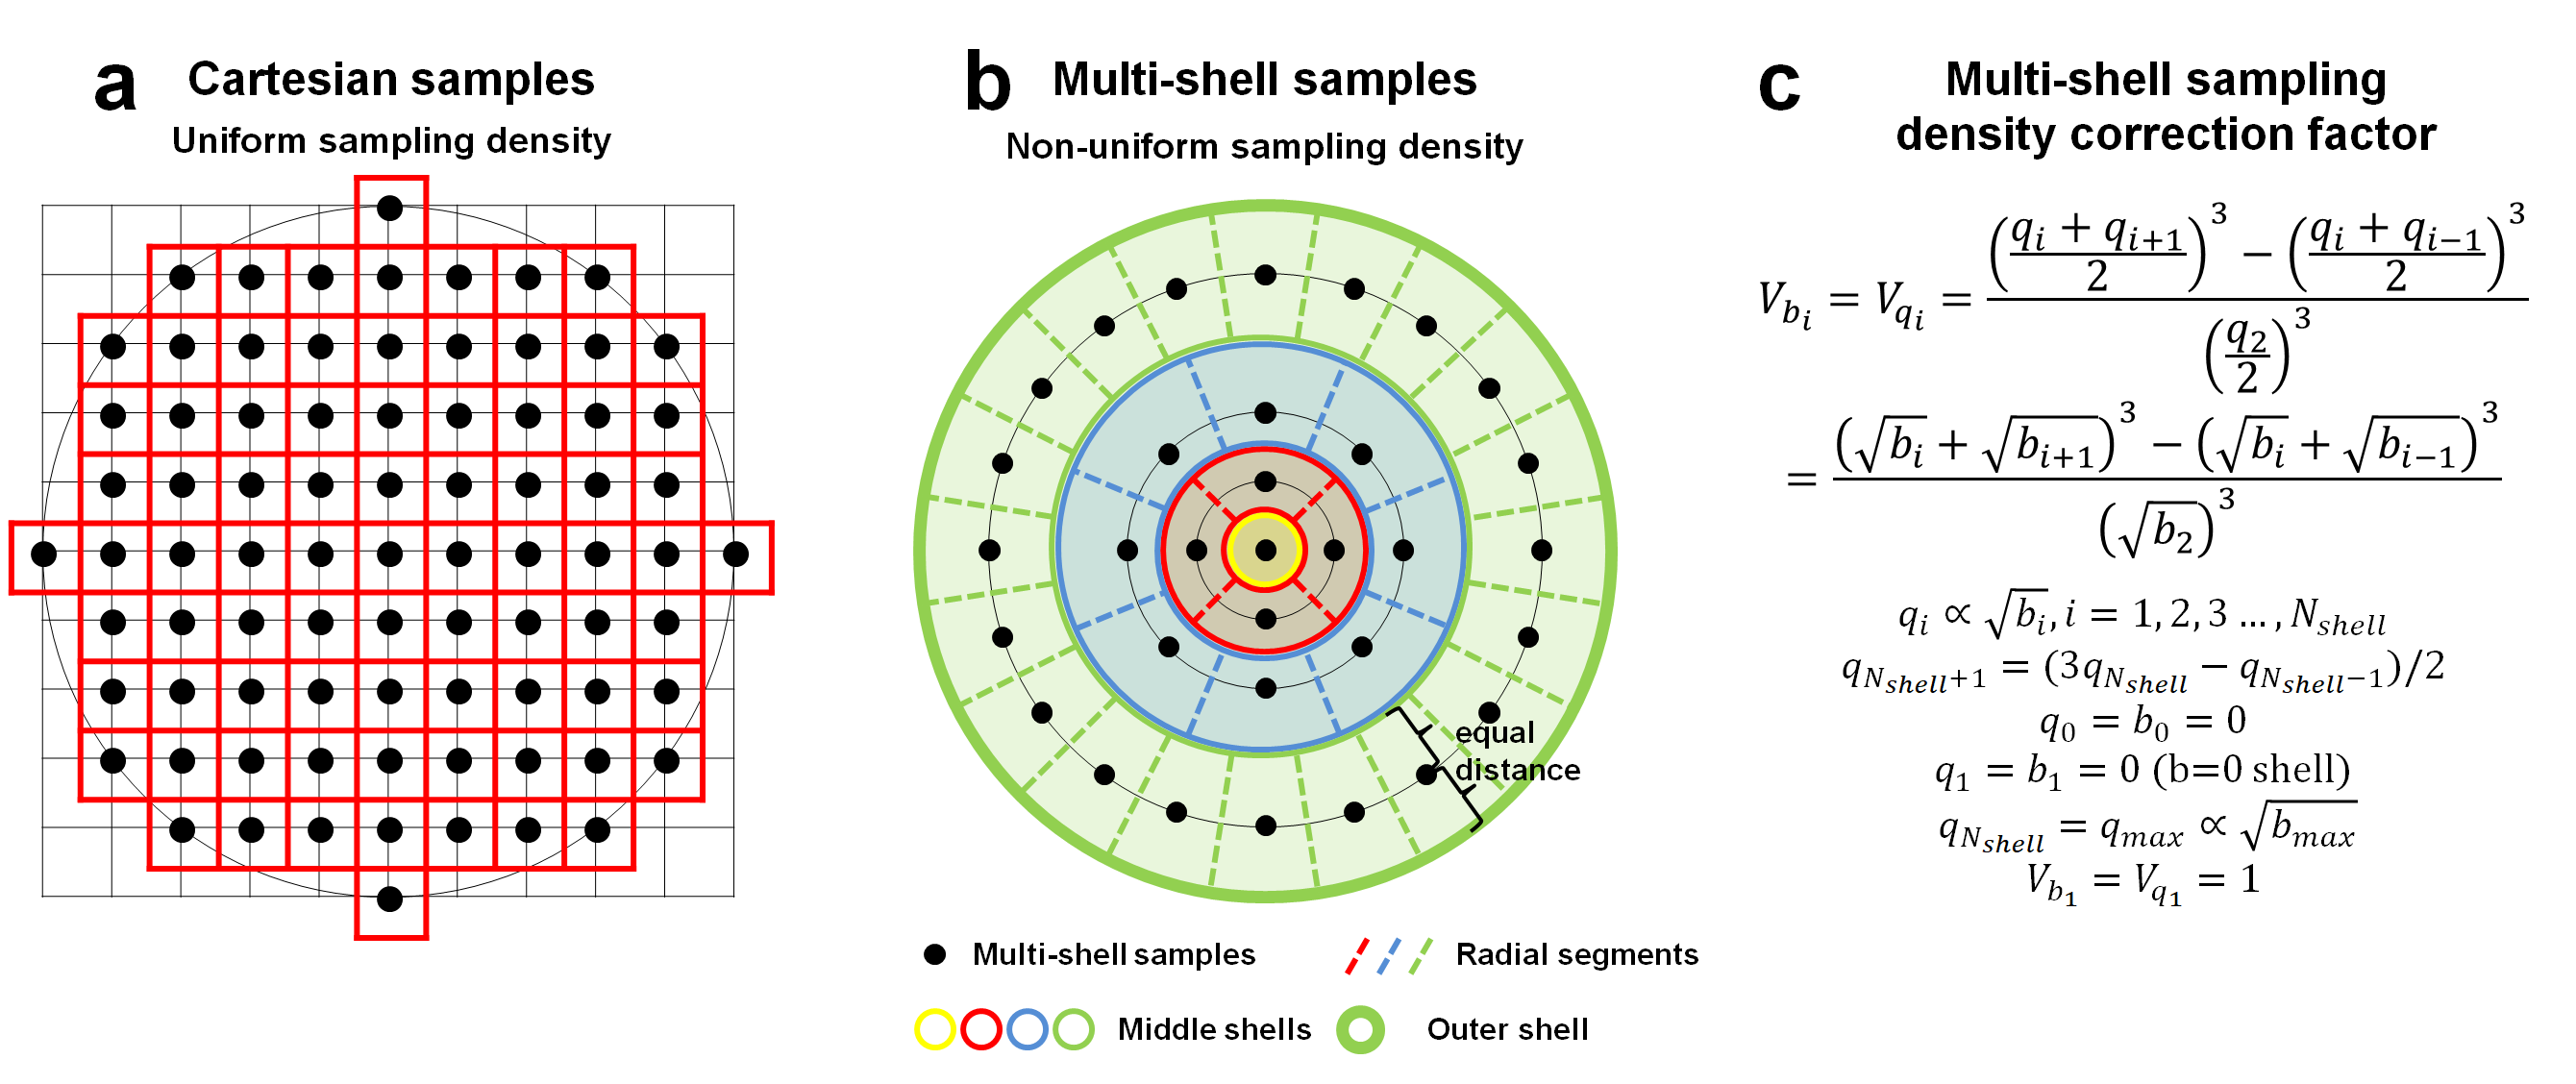
RTOP Calculation. RTOP is calculated as the weighted summation of all q-space signals S(q). For multi-shell data, q-space samples (qij) on the ith shell can be grouped as:
$$RTOP=\sum_{i=1}^{N_{shell}}[\sum_{j=1}^{N^i_{direction}}S(\textbf{q}_{ij}){\Delta}\textbf{q}_{ij}]$$
Since diffusion-encoding directions are uniform, Δqij is identical on the same shell and equal to the volume associated with the space between the inner and outer contours of a shell (Vqi) divided by the number of samples on the ith shell ($$$N^i_{direction}$$$)17 (Fig.1b).
$$RTOP=\sum_{i=1}^{N_{shell}}[\sum_{j=1}^{N^i_{direction}}S(\textbf{q}_{ij})\frac{V_{q_i}}{N^i_{direction}}]=\sum_{i=1}^{N_{shell}}V_{q_i}\frac{\sum_{j=1}^{N^i_{direction}}S(\textbf{q}_{ij})}{N^i_{direction}}=\sum_{i=1}^{N_{shell}}V_{q_i}\overline{S}(\textbf{q}_{i})=\sum_{i=1}^{N_{shell}}V_{q_i}RTOP_{q_i}$$
,where $$$\overline{S}(\textbf{q}_{i})$$$ is the spherical mean signal of the ith shell.
Results
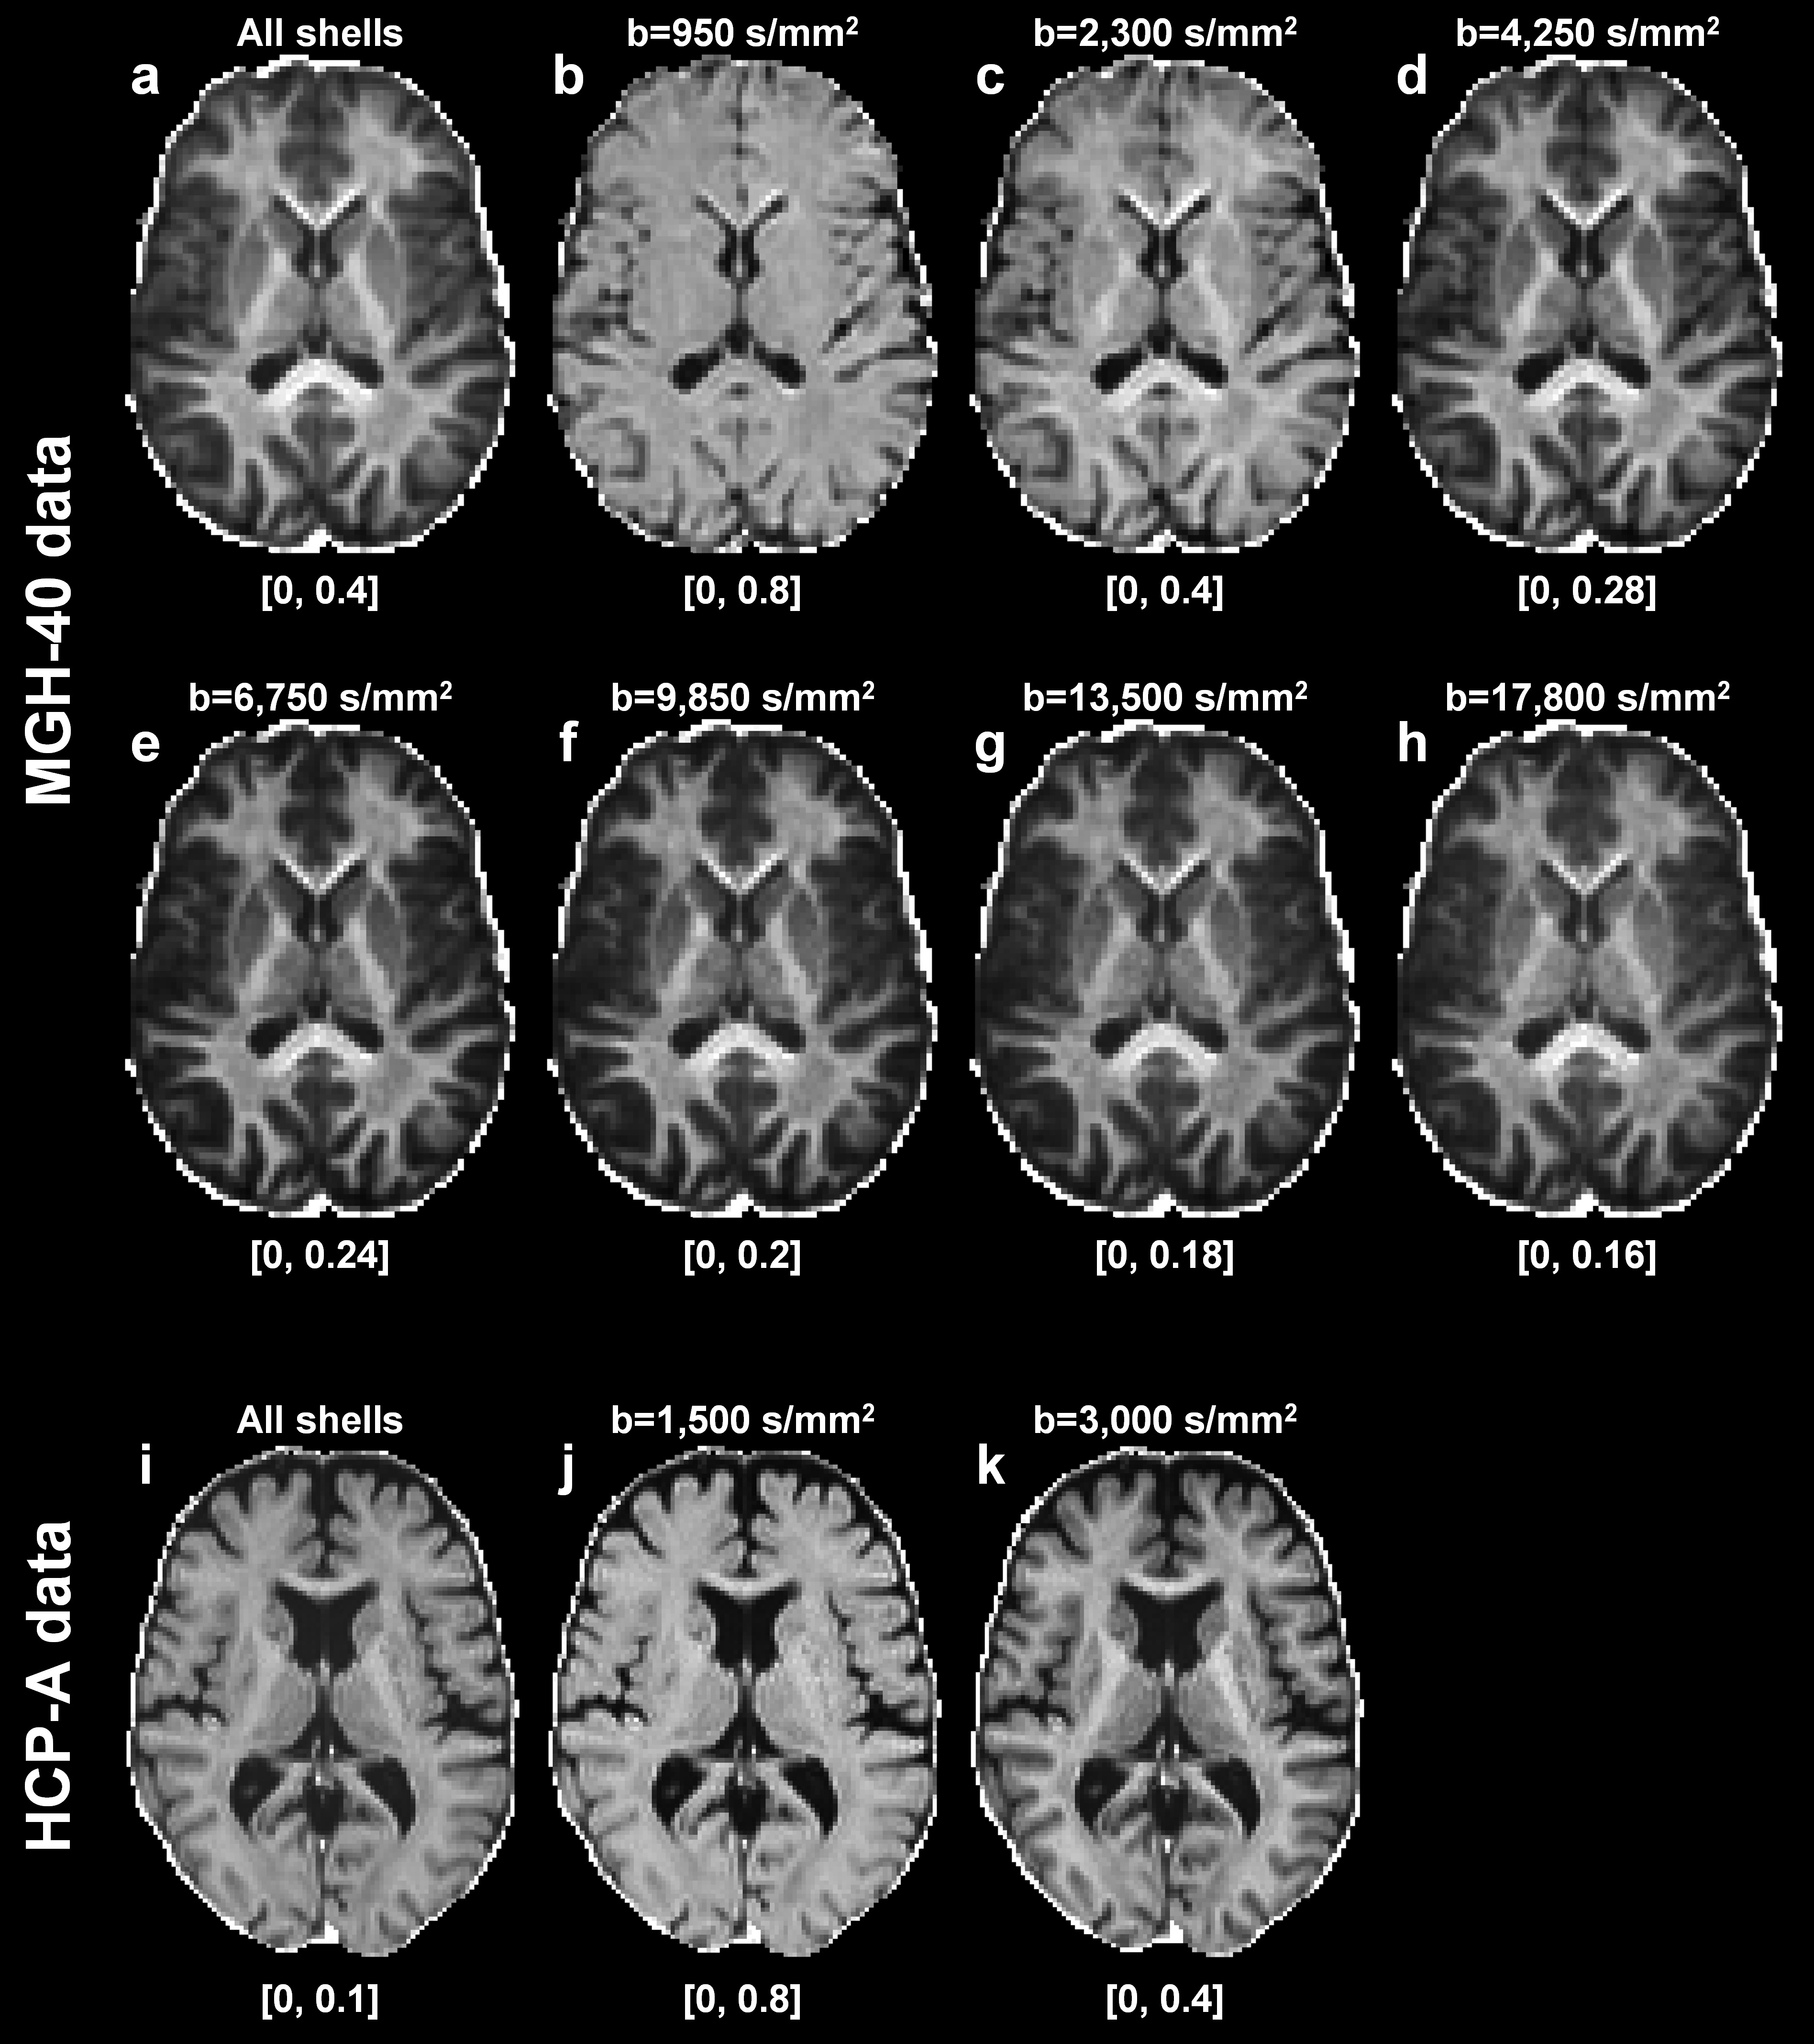
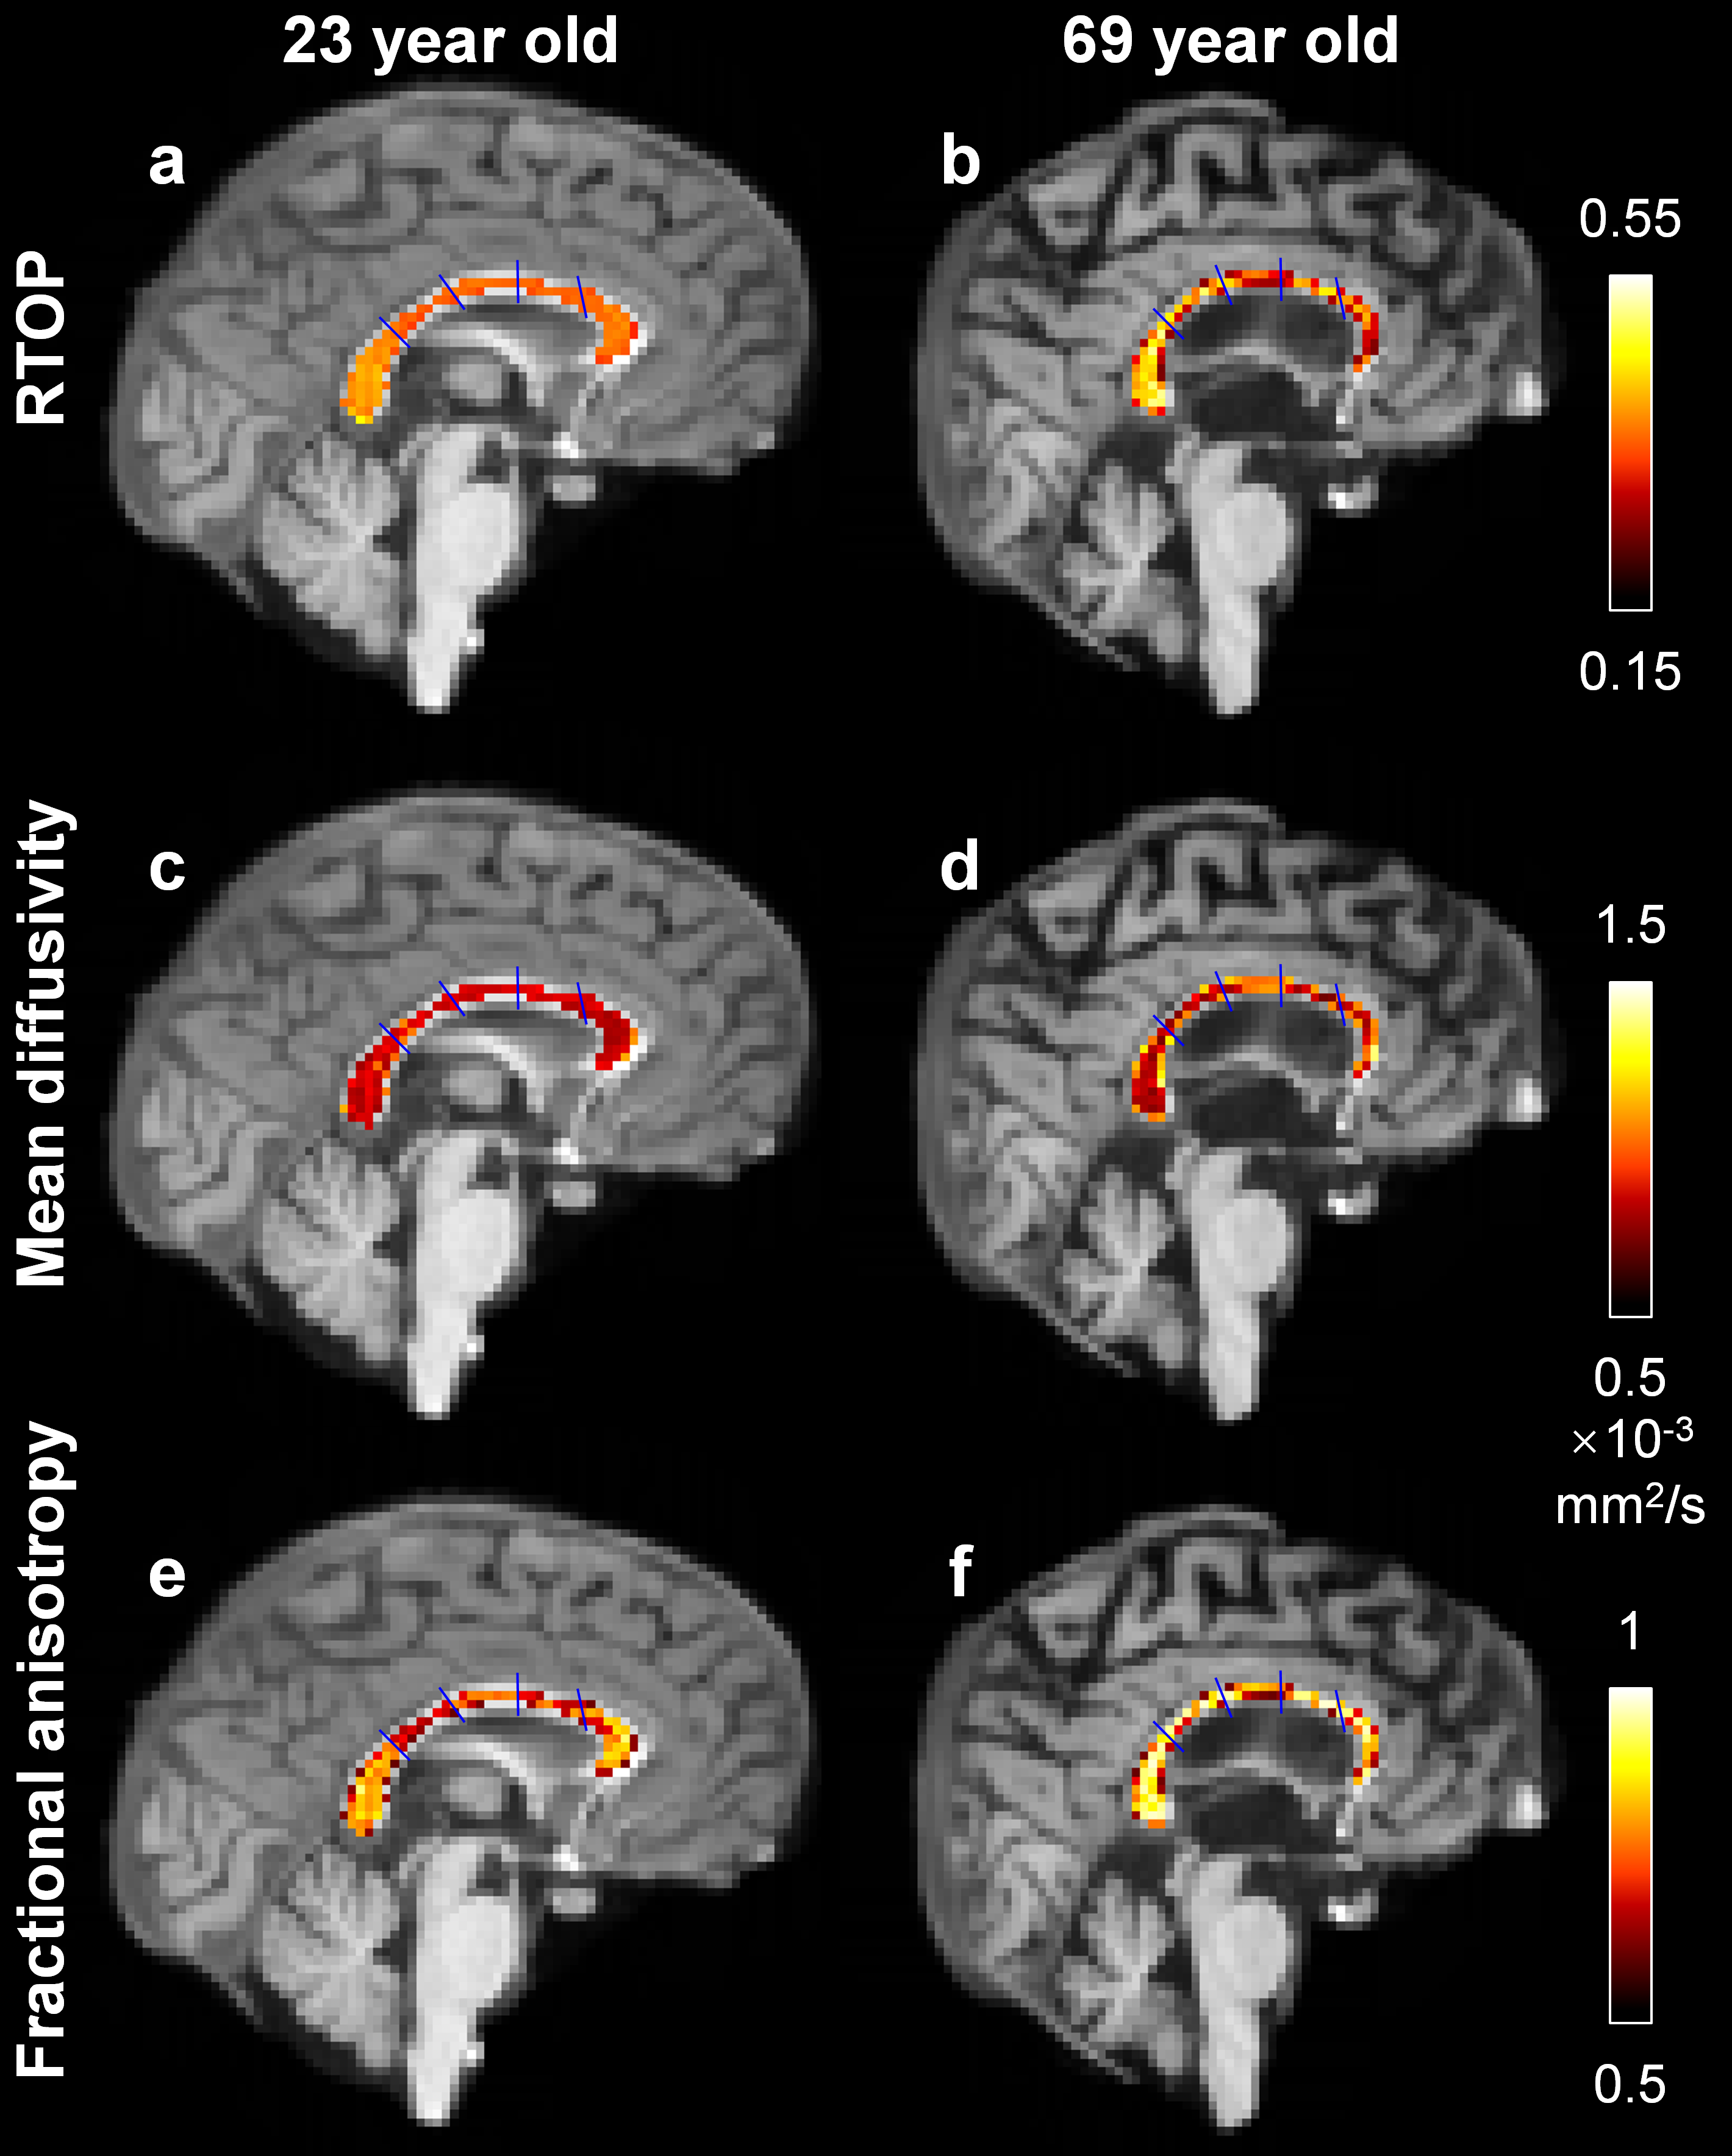
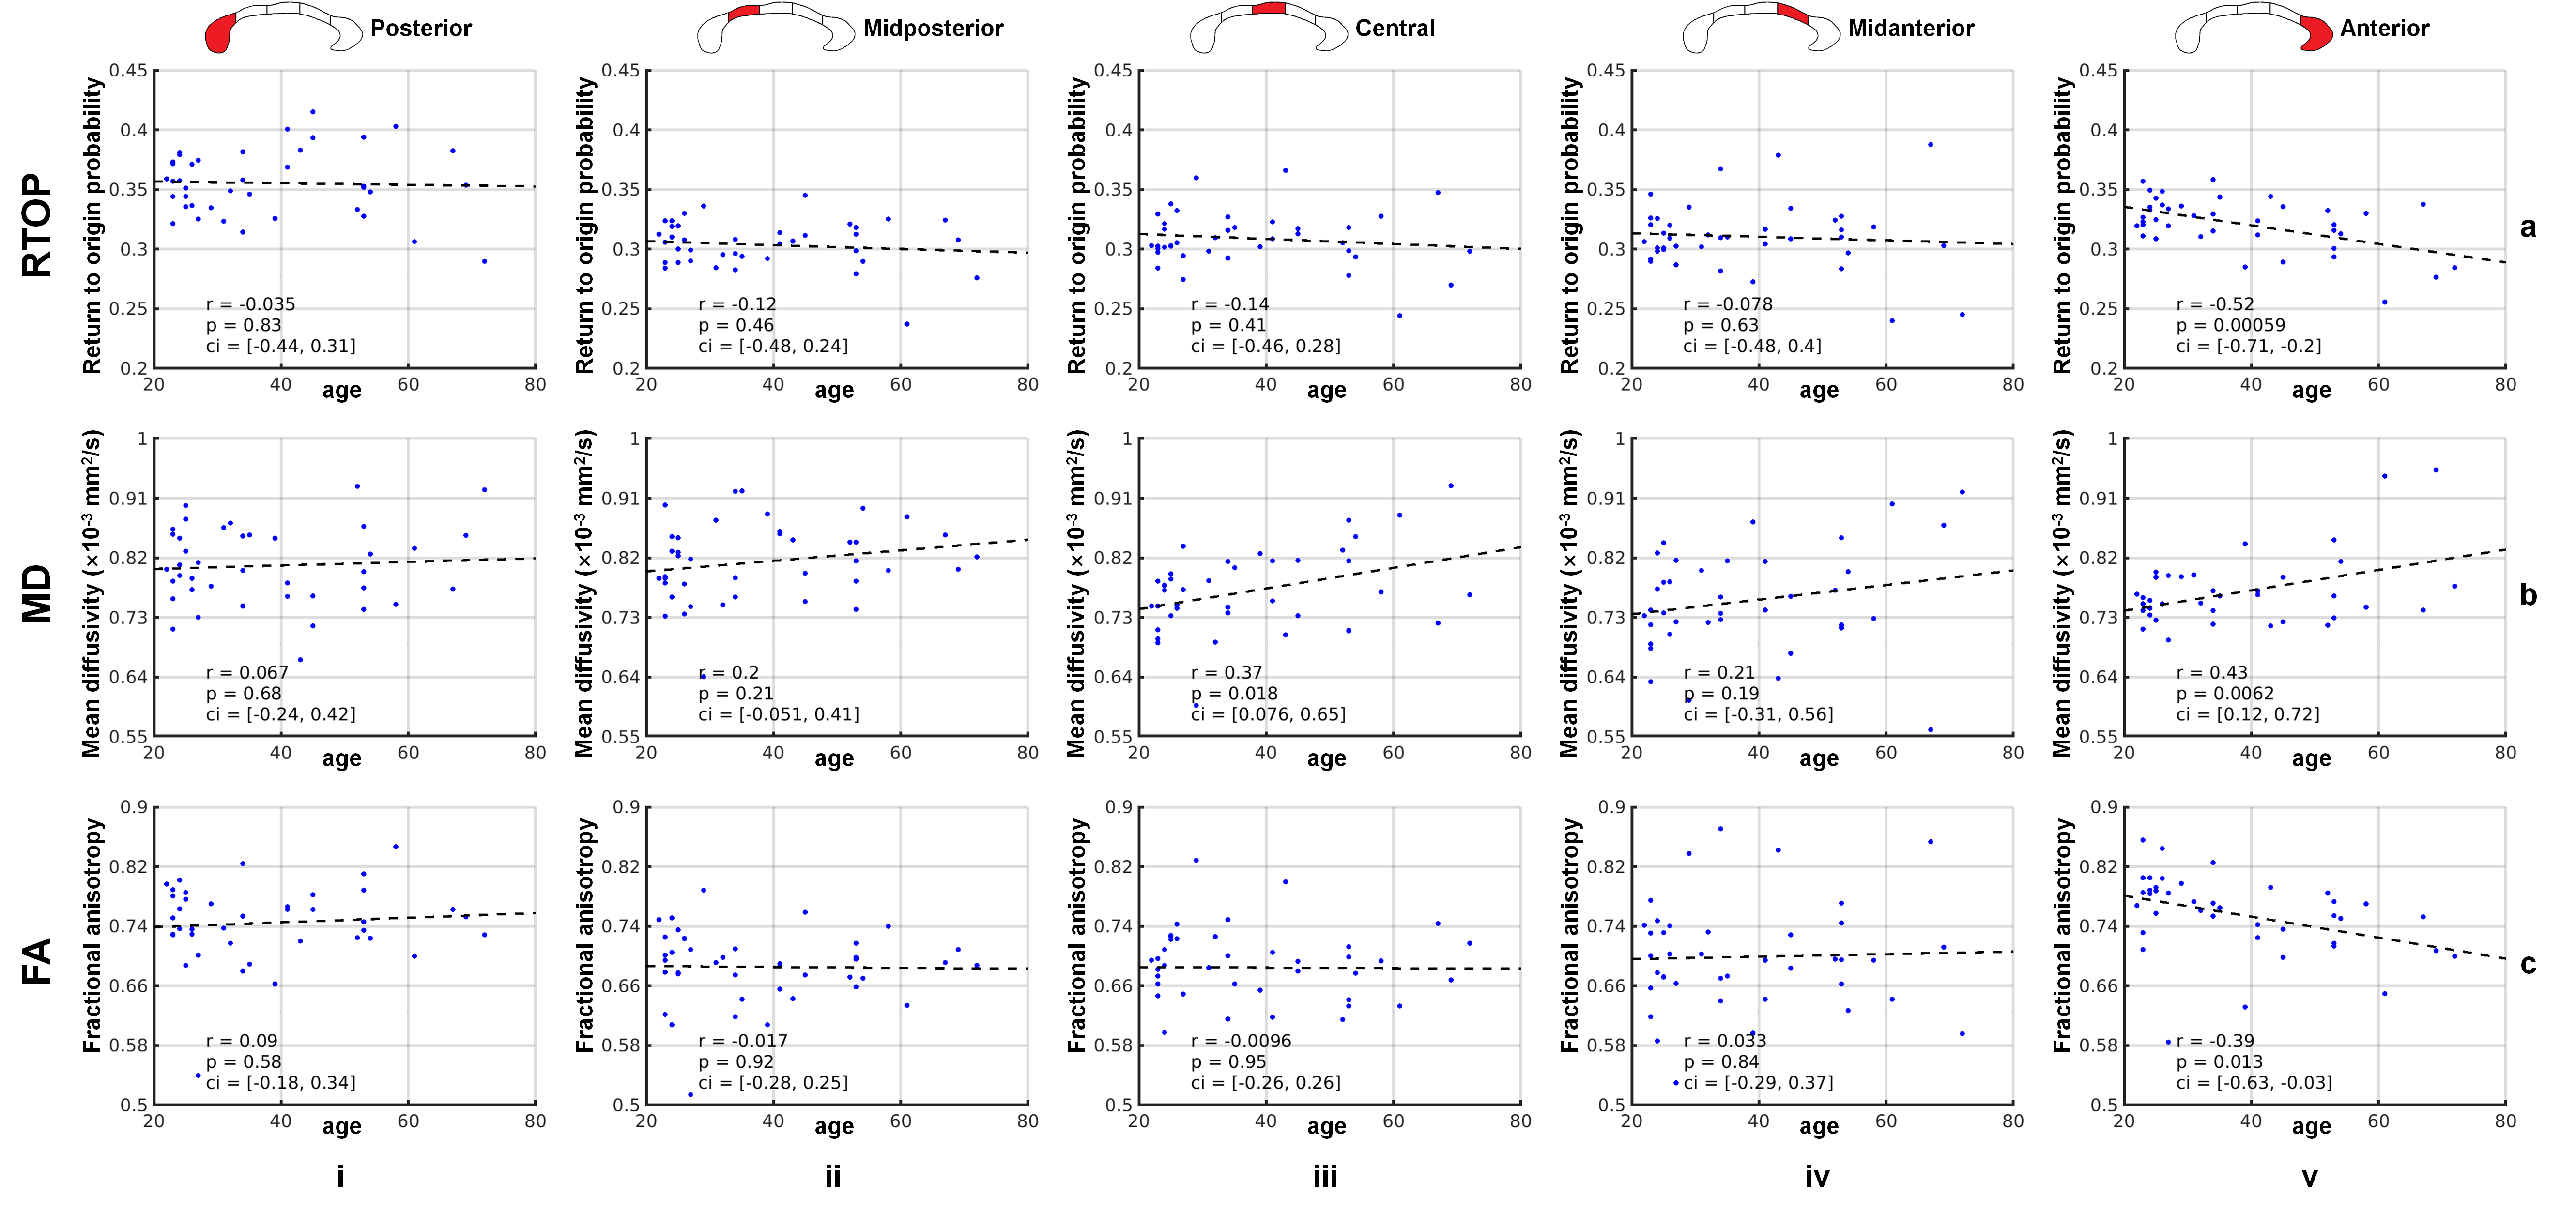
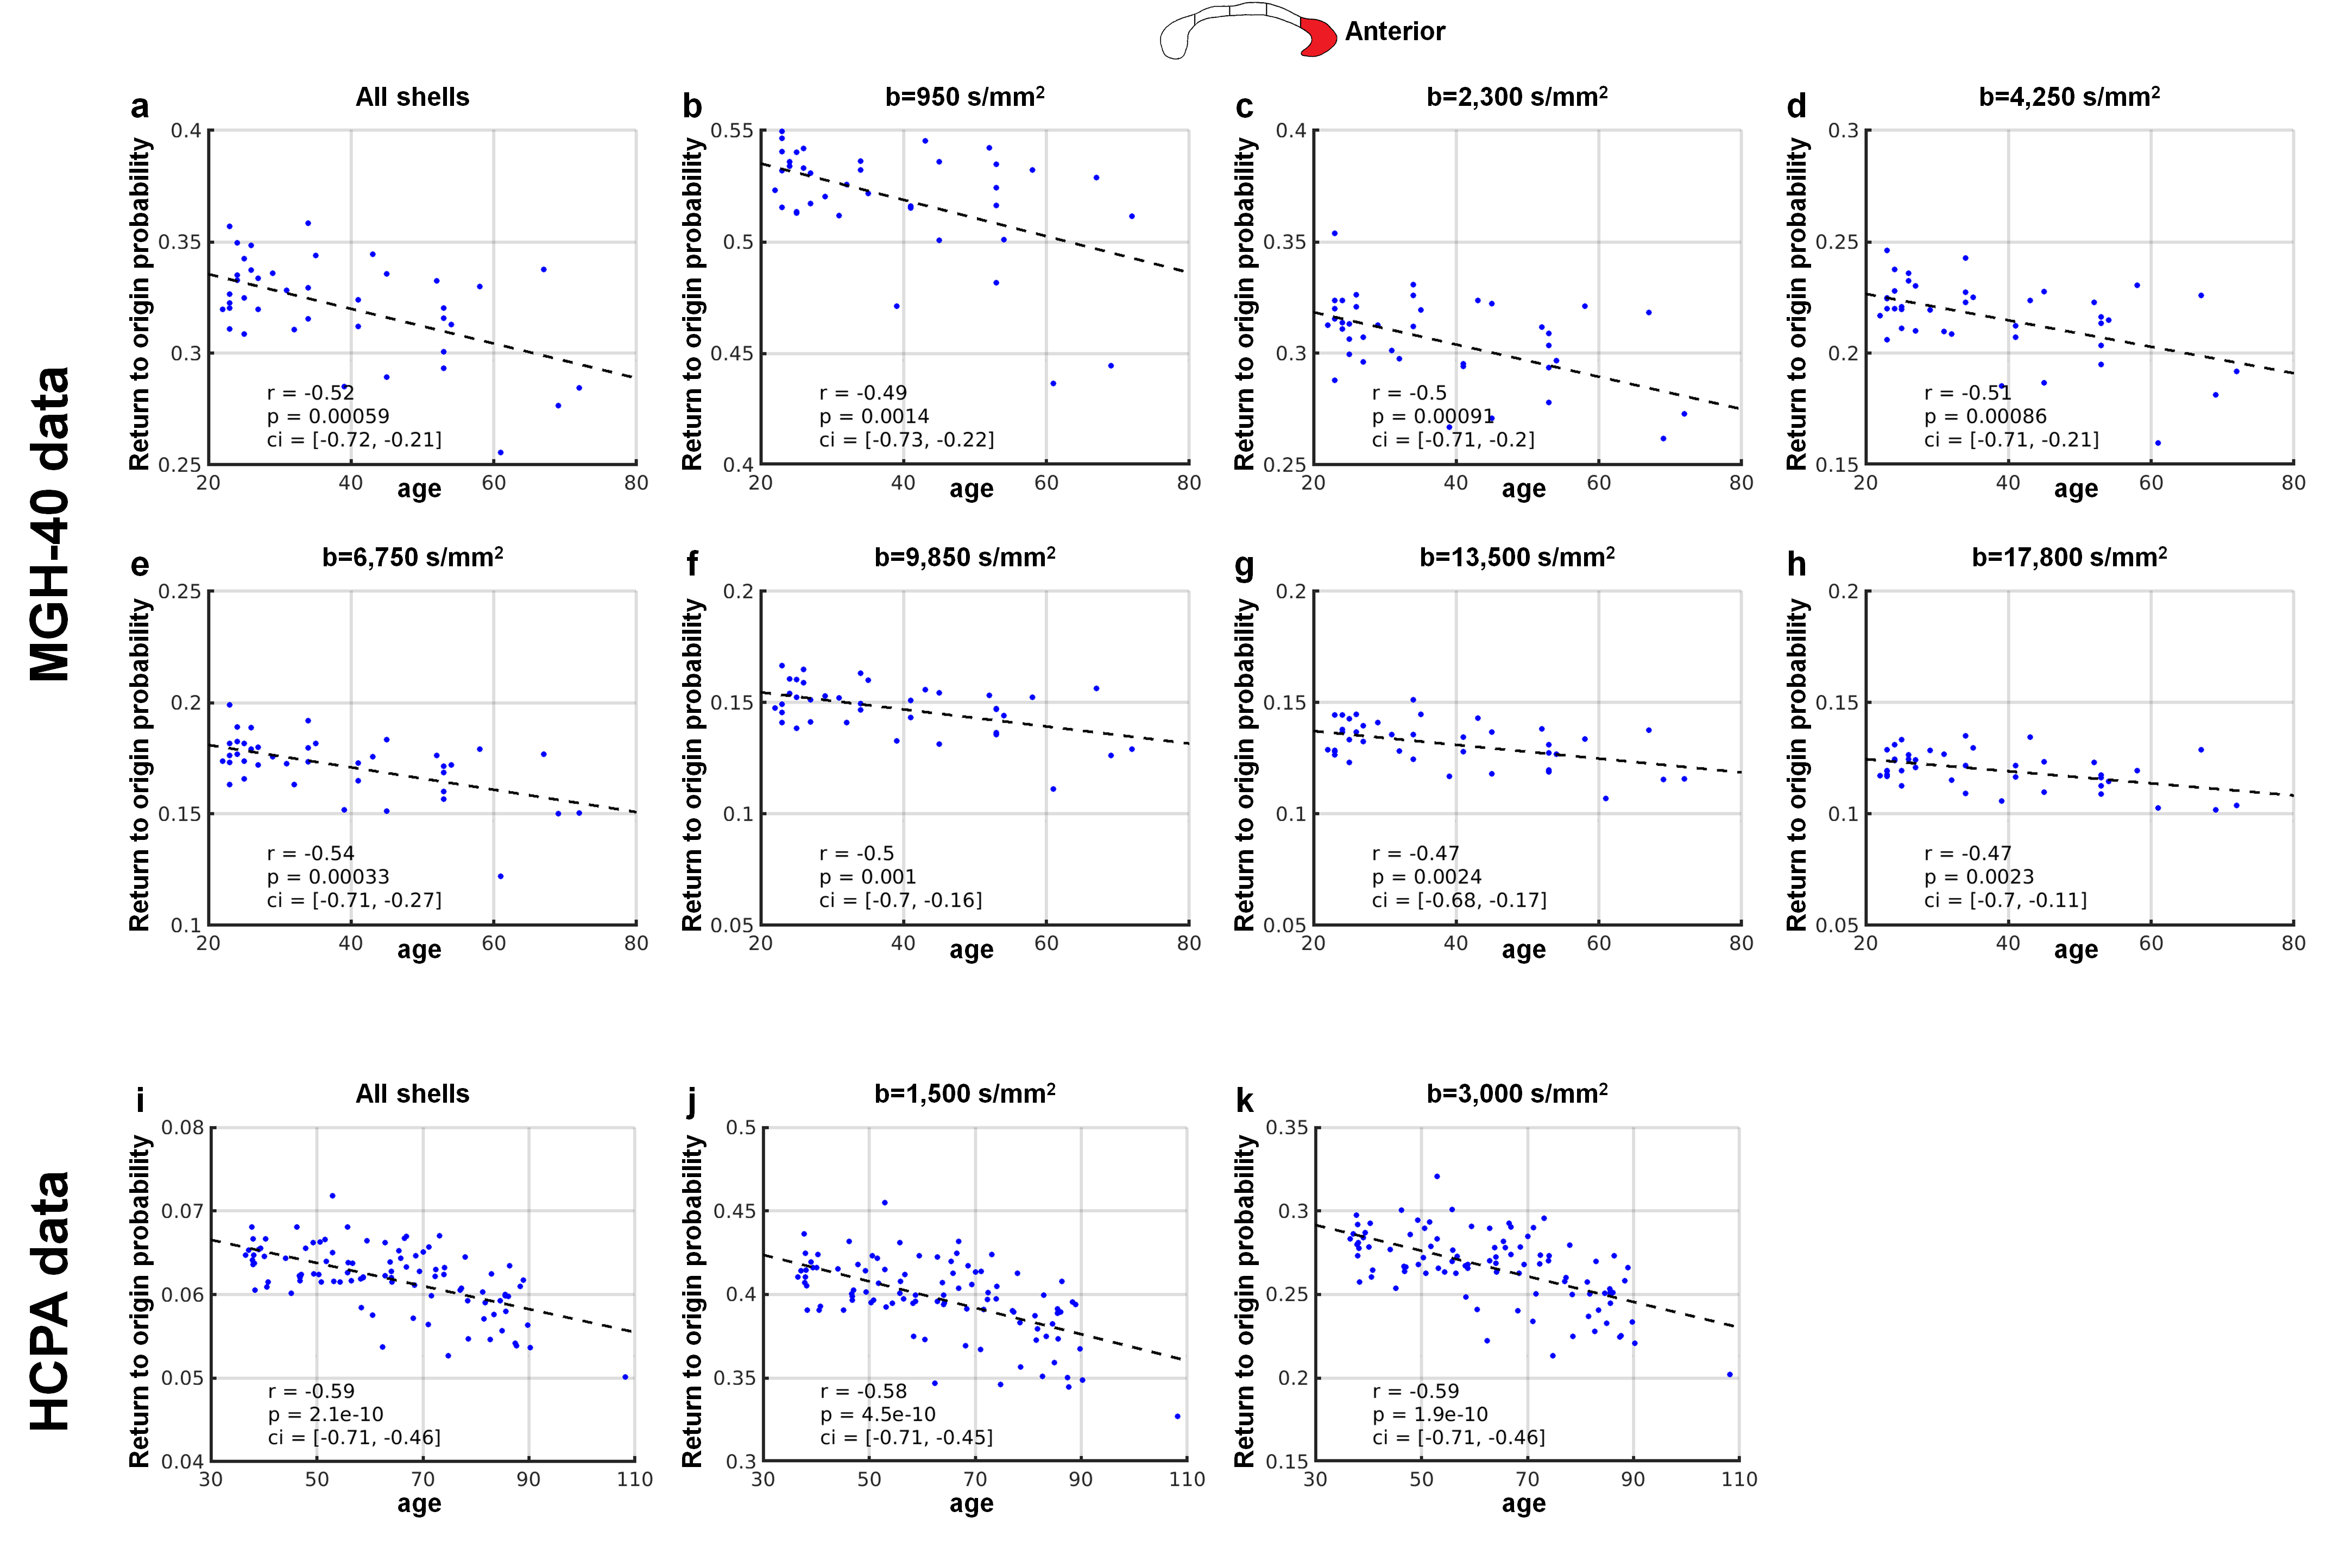
RTOP in white matter was higher than in gray matter and CSF, reflecting differential diffusion restriction in different tissue types (Fig.2). The tissue contrast in the RTOP maps increased with increasing b-value. For the MGH-40 data, the tissue contrast visually remained the same at b-values higher than b=6750 s/mm2.Figures 3 and 4 show the relationship between the RTOP, FA and MD in the CC and age. The mean RTOP in the anterior CC significantly decreased with increasing age (r=-0.52, p=0.00059) (Fig.4a). The correlation of RTOP in the anterior CC with age was slightly higher than for MD (r=-0.43, p=0.0062) (Fig.4b) and FA (r=-0.39, p=0.013) (Fig.4c).
Figure 5 shows that the mean RTOP calculated from all multi-shell dMRI data as well as from each individual shell correlated with age in the anterior CC (r=-0.47 to -0.59, p<0.01). The correlation increased with increasing b-value and plateaued for b-values higher than b=6,750 s/mm2.
Discussion and Conclusion
We demonstrate that RTOP can be derived from a weighted summation of RTOP from each individual shell. This decomposition is useful for elucidating the sensitivity of RTOP at different b-values to the underlying tissue microstructure and provides a simple, fast method to compute RTOP from single-shell data. Our method significantly reduces the data requirement and computational complexity to derive RTOP for practical use. Using this method, we found significantly decreased RTOP with increasing age, suggesting age-related alterations in tissue microstructure, in agreement with prior studies using other advanced dMRI compartment models18. The correlation of RTOP with age was higher than MD and FA from DTI. Our method can be applied to other large-scale datasets to study tissue microstructure in a variety of neurological and psychiatric disorders.Acknowledgements
This work was supported by the NIH and NIA (grants U01AG052564, U01EB026996, and K23NS096056) and an MGH Claflin Distinguished Scholar Award.References
[1] Salat, D. et al. Age‐related changes in prefrontal white matter measured by diffusion tensor imaging. Annals of the New York Academy of Sciences 1064, 37-49 (2005).
[2] Mitra, P. P., Latour, L., Kleinberg, R. L. & Sotak, C. H. Pulsed-field-gradient NMR measurements of restricted diffusion and the return-to-the-origin probability. Journal of Magnetic Resonance, Series A 114, 47-58 (1995).
[3] Pines, A. R. et al. Advantages of Multi-shell Diffusion Models for Studies of Brain Development in Youth. bioRxiv, 611590 (2019).
[4] Kodiweera, C., Alexander, A. L., Harezlak, J., McAllister, T. W. & Wu, Y.-C. Age effects and sex differences in human brain white matter of young to middle-aged adults: a DTI, NODDI, and q-space study. NeuroImage 128, 180-192 (2016).
[5] Wu, Y.-C., Field, A. S., Whalen, P. J. & Alexander, A. L. Age-and gender-related changes in the normal human brain using hybrid diffusion imaging (HYDI). NeuroImage 54, 1840-1853 (2011).
[6] Wedeen, V. J., Hagmann, P., Tseng, W. Y. I., Reese, T. G. & Weisskoff, R. M. Mapping complex tissue architecture with diffusion spectrum magnetic resonance imaging. Magnetic Resonance in Medicine 54, 1377-1386 (2005).
[7] Aja-Fernandez, S., Tristan-Vega, A., Molendowska, M., Pieciak, T. & de Luis-Garcia, R. Return-to-the-origin probability calculation in single shell acquisitions. In Proceedings of the 26th Annual Meeting of the International Society for Magnetic Resonance in Medicine (ISMRM), Paris, France, 1607 (2018).
[8] Özarslan, E. et al. Mean apparent propagator (MAP) MRI: a novel diffusion imaging method for mapping tissue microstructure. NeuroImage 78, 16-32 (2013).
[9] Wu, Y.-C. & Alexander, A. L. Hybrid diffusion imaging. NeuroImage 36, 617-629 (2007).
[10] Descoteaux, M., Deriche, R., Le Bihan, D., Mangin, J.-F. & Poupon, C. Multiple q-shell diffusion propagator imaging. Medical image analysis 15, 603-621 (2011).
[11] Hosseinbor, A. P., Chung, M. K., Wu, Y.-C. & Alexander, A. L. Bessel fourier orientation reconstruction (bfor): An analytical diffusion propagator reconstruction for hybrid diffusion imaging and computation of q-space indices. NeuroImage 64, 650-670 (2013).
[12] Fick, R. H., Wassermann, D., Caruyer, E. & Deriche, R. MAPL: Tissue microstructure estimation using Laplacian-regularized MAP-MRI and its application to HCP data. NeuroImage 134, 365-385 (2016).
[13] Bookheimer, S. Y. et al. The Lifespan Human Connectome Project in Aging: An overview. NeuroImage 185, 335-348 (2019).
[14] Harms, M. P. et al. Extending the Human Connectome Project across ages: Imaging protocols for the Lifespan Development and Aging projects. NeuroImage 183, 972-984 (2018).
[15] Somerville, L. H. et al. The Lifespan Human Connectome Project in Development: A large-scale study of brain connectivity development in 5–21 year olds. NeuroImage 183, 456-468 (2018).
[16] Huang, S. Y. et al. High-gradient diffusion MRI reveals distinct estimates of axon diameter index within different white matter tracts in the in vivo human brain. Brain Structure and Function, 1-15.
[17] Tian, Q. et al. Generalized diffusion spectrum magnetic resonance imaging (GDSI) for model-free reconstruction of the ensemble average propagator. NeuroImage (2019).
[18] Fan, Q. et al. Age-related alterations in axonal microstructure in the corpus callosum measured by high-gradient diffusion MRI. NeuroImage 191, 325-336 (2019).
Figures