0194
Effects of Arterial Stiffness on Cerebral White Matter Integrity in the Elderly1Department of Radiology, Juntendo University, Tokyo, Japan, 2Department of Cardiovascular Medicine, Juntendo University, Tokyo, Japan, 3Department of Metabolism & Endocrinology, Juntendo University, Tokyo, Japan, 4Sportology Center, Juntendo University, Tokyo, Japan, 5Department of Radiological Sciences, Tokyo Metropolitan University, Tokyo, Japan
Synopsis
Arterial stiffness has been shown to be associated with structural and functional abnormalities in the brain; however, white matter pathology related to arterial stiffness is poorly understood. In this study, we used white matter (WM) sensitive techniques (diffusion tensor imaging, neurite orientation dispersion and density imaging, free-water imaging, and magnetization transfer-saturation imaging) to better understand the impact of arterial stiffness on the WM microstructure in healthy elderly individuals. Our results suggest that arterial stiffness largely affects the content of cerebral myelin, as reflected by the myelin volume fraction.
Introduction
Arterial stiffness is associated with an elevated risk of structural and functional abnormalities in the brain.1 In particular, white matter (WM) lesions (WMLs) have consistently been shown to be associated with central artery stiffness.2 However, it has been shown that WMLs are preceded by microstructural changes,3 which can be detected using advanced magnetic resonance imaging (MRI) techniques, such as diffusion tensor imaging (DTI)4, 5 and magnetization transfer-saturation (MT-sat) imaging. The present study aimed to use WM-sensitive techniques (DTI, neurite orientation dispersion and density imaging [NODDI], free-water imaging [FWI], and MT-sat imaging) to better understand the impact of arterial stiffness on the WM microstructure in healthy elderly individuals.Methods
Study participantsThe study included 155 healthy elderly individuals from the Bunkyo health study cohort.6 Demographic characteristics are summarized in Fig. 1.
Arteriosclerosis
Arteriosclerosis was estimated using the cardio-ankle vascular index (CAVI) determined using an automatic waveform analyzer (Vascular Screening System VaSera VS-1500, Fukuda Denshi, Tokyo, Japan).7
MRI
All subjects were scanned using a 3-T MRI unit (Magnetom Prisma, Siemens Healthcare, Erlangen, Germany). Diffusion-weighted imaging (DWI) was performed at b-values of 1000 and 2000 s/mm2in 64 directions using a simultaneous multi-slice echo-planar imaging sequence. MT-sat indices were obtained using three-dimensional multi-echo fast low-angle shot sequences with predominant T1-, proton density-, and MT-weighting. Additionally, fluid-attenuated inversion recovery (FLAIR) images were obtained.
Diffusion MRI: DWI data were fitted to the NODDI model,8 and the NODDI MATLAB Toolbox was used to generate maps of intracellular volume fractions (ICVFs) and orientation dispersion (OD) indices. Fractional anisotropy (FA) and mean diffusivity (MD) were then estimated from the DWI data based on b values of 0 and 1000 s/mm2. Furthermore, an in-house MATLAB script was used to fit a regularized bi-tensor model and generate free water (FW)-corrected FA (FAt) and MD (MDt), and fractional volume of FW maps.9
Myelin-sensitive imaging: To calculate the myelin volume fraction (MVF), MT-sat data were analyzed using an in-house MATLAB script as described previously.10
Measurement of total WML volume
The WMLs of each patient were automatically delineated in FLAIR images using a Lesion Segmentation Tool (https://www.applied-statistics.de/lst.html).11
Voxel based analysis and tracts of interest analysis
We used tract-based spatial statistics (TBSS) and tract of interest (TOI) analyses to correlate the diffusion and myelin indices with the CAVI. The TOI analysis was performed using the ICBM-DTI-81 WM atlas.12Four regions described as vulnerable to increased central arterial stiffness in previous literature (corpus callosum [CC], internal capsule [IC], corona radiata [CR], and superior longitudinal fasciculus [SLF]) were selected as TOIs (Fig. 2). Then, the mean value within each region of interest was computed for each WM metric.
Statistical analysis
For TBSS, the Randomize tool was used to examine the relationship between WM metrics and the CAVI with multiple linear regression (MLR) analysis (pFWE < 0.05, adjusting for a set of standard risk factors including age, sex, and antihypertensive therapy use). For TOI analysis, a MLR model was used separately for each WM metric as a dependent variable and the CAVI as an independent variable. To isolate the strength of the association between the CAVI and WM integrity, age, sex, and antihypertensive therapy use were considered as confounding covariates in the models. In addition, Spearman’s correlation between the CAVI and each WM metric was computed for each region of interest. Bonferroni correction was used for multiple comparisons.
Results
TBSSAmong all indices, only MVF was correlated with the CAVI. A lower MVF was associated with a higher CAVI in major WM tracts including the CC, IC, CR, and SLF (Fig. 3).
TOI
The MLR analysis did not reveal that the CAVI was a significant predictor of any indices. However, there were strong associations (not significant) with MD and FW in the CC and with MVF in all analyzed tracts (Fig. 4). Moreover, there were significant correlations between the CAVI and FA in the CC; MD in the CC, IC, CR, and SLF; ICVF in the CR; MDt in the CR and SLF; MVF in the IC, CR, and SLF; and FW in the CC and CR (Fig. 5). Moreover, the CAVI was significantly associated with WML volume.
Discussion
We noted a significant relationship between arterial stiffness and WM integrity in WM regions previously described as vulnerable to arterial stiffness. Voxel-wise TBSS results identified a significant negative correlation between the CAVI and MVF in major WM tracts. MLR analysis in TOI suggested strong associations (not significant) between the CAVI and MD, FW, and MVF and in WM regions previously described as vulnerable to arterial stiffness. Consistent with previous findings,4, 5 our data suggest that arterial stiffness is largely associated with demyelination of the cerebral WM region rather than other WM pathologies, such as axonal degeneration. However, Badji et al. showed that arterial stiffness was associated with axonal degeneration rather than demyelination using DTI and MT.13 These conflicting results might be due to differences in the characteristics of the target cohort, and these differences might have been associated with differences in brain pathology.Conclusion
Arterial stiffness, as measured by the CAVI, affects the content of cerebral myelin.Acknowledgements
This work is supported by the Strategic Research Foundation at Private Universities (S1411006) and KAKENHI (18H03184) from the Ministry of Education, Culture, Sports, Science and Technology of Japan.References
- Rusanen M, Kivipelto M, Levalahti E, et al. Heart diseases and long-term risk of dementia and Alzheimer's disease: a population-based CAIDE study. Journal of Alzheimer's disease : JAD 2014;42:183-912.
- Singer J, Trollor JN, Baune BT, et al. Arterial stiffness, the brain and cognition: a systematic review. Ageing Res Rev 2014;15:16-273.
- Sabayan B, van der Grond J, Westendorp RG, et al. Accelerated progression of white matter hyperintensities and subsequent risk of mortality: a 12-year follow-up study. Neurobiology of aging 2015;36:2130-54.
- Maillard P, Mitchell GF, Himali JJ, et al. Aortic Stiffness, Increased White Matter Free Water, and Altered Microstructural Integrity: A Continuum of Injury. Stroke 2017;48:1567-735.
- Tarumi T, de Jong DL, Zhu DC, et al. Central artery stiffness, baroreflex sensitivity, and brain white matter neuronal fiber integrity in older adults. NeuroImage 2015;110:162-706.
- Someya Y, Tamura Y, Kaga H, et al. Skeletal muscle function and need for long-term care of urban elderly people in Japan (the Bunkyo Health Study): a prospective cohort study. BMJ Open 2019;9:e0315847.
- Shirai K, Utino J, Otsuka K, et al. A novel blood pressure-independent arterial wall stiffness parameter; cardio-ankle vascular index (CAVI). J Atheroscler Thromb 2006;13:101-78.
- Zhang H, Schneider T, Wheeler-Kingshott CA, et al. NODDI: practical in vivo neurite orientation dispersion and density imaging of the human brain. NeuroImage 2012;61:1000-169.
- Pasternak O, Sochen N, Gur Y, et al. Free water elimination and mapping from diffusion MRI. Magn Reson Med 2009;62:717-3010.
- Helms G, Dathe H, Kallenberg K, et al. High-resolution maps of magnetization transfer with inherent correction for RF inhomogeneity and T1 relaxation obtained from 3D FLASH MRI. Magn Reson Med 2008;60:1396-40711.
- Schmidt P, Gaser C, Arsic M, et al. An automated tool for detection of FLAIR-hyperintense white-matter lesions in Multiple Sclerosis. NeuroImage 2012;59:3774-8312.
- Mori S, Oishi K, Jiang H, et al. Stereotaxic white matter atlas based on diffusion tensor imaging in an ICBM template. Neuroimage 2008;40:570-8213.
- Badji A, Noriega de la Colina A, Karakuzu A, et al. Arterial stiffness and white matter integrity in the elderly: A diffusion tensor and magnetization transfer imaging study. NeuroImage 2019;186:577-85
Figures
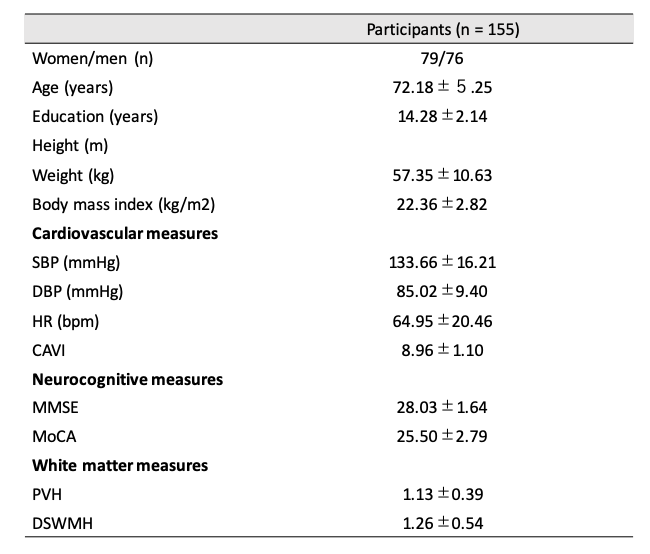
Figure 1: Demographic characteristics of the participants
Data are presented as mean ± standard deviation. CAVI, cardio-ankle vascular index; SBP, systolic blood pressure; DBP, diastolic blood pressure; PVH, periventricular hyperintensity; DSWMH, deep and subcortical white matter hyperintensity
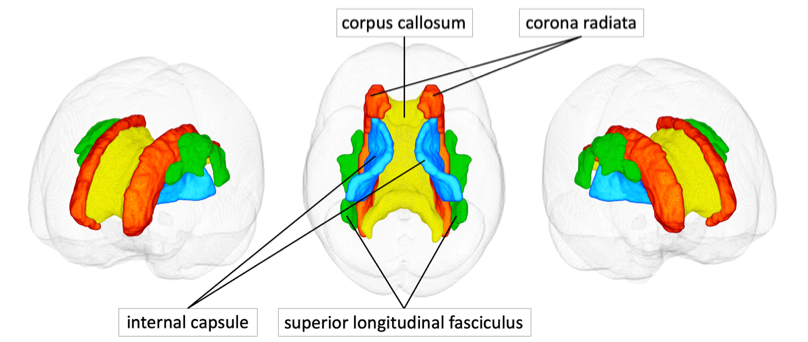
Figure 2. White matter tracts of interest
Four white matter tracts according to the ICBM-DTI-81 atlas are shown in one participant.
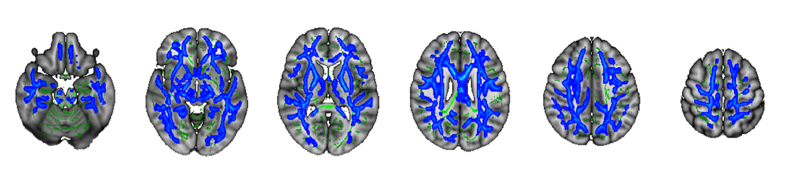
Figure 3. Significant associations between a high cardio-ankle vascular index (CAVI) and low myelin volume fraction (MVF)
Blue–light blue voxels demonstrate a significant negative correlation between the CAVI and MVF. To aid visualization the results (corrected P < 0.05) are thickened using the fill script implemented in FSL.
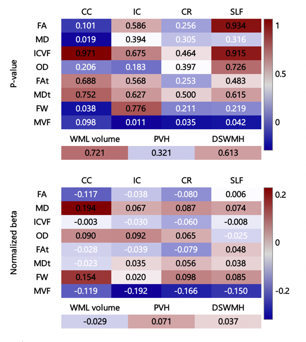
Figure 4. Heat maps for the prediction ability of the cardio-ankle vascular index with regard to estimating each white matter metric along four regions of interest
The corpus callosum (CC), internal capsule (IC), corona radiata (CR), and superior longitudinal fasciculus (SLF) are the regions of interest.
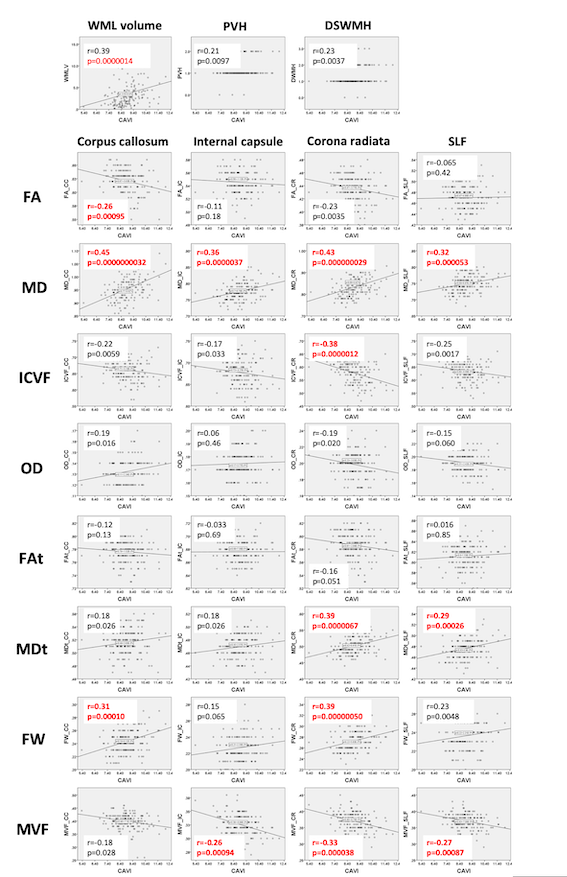
Figure 5. Scatter plots for the correlation of the cardio-ankle vascular index (CAVI) with each white matter metric along four regions of interest
Significant p-values are indicated with bold red font.