0191
Altered lactate dynamics with age in human brain during sleep1Advanced Imaging Research Center, Oregon Health & Science University, Portland, OR, United States, 2Department of Neurology, Oregon Health & Science University, Portland, OR, United States, 3VA Portland Health Care System, Portland, OR, United States, 4Department of Medicine, Division of Pulmonary and Critical Care Medicine, Oregon Health & Science University, Portland, OR, United States, 5Department of Behavioral Neuroscience, Oregon Health & Science University, Portland, OR, United States, 6Oregon Institute of Occupational Health Sciences, Oregon Health & Science University, Portland, OR, United States, 7Department of Neurology, University of Washington, Seattle, WA, United States, 8Department of Anesthesiology and Perioperative Medicine, Oregon Health & Science University, Portland, OR, United States, 9Knight Cardiovascular Institute, Oregon Health & Science University, Portland, OR, United States, 10VISN 20 Mental Illness Research, Education and Clinical Center (MIRECC), VA Puget Sound Health Care System, Seattle, WA, United States, 11Department of Psychiatry and Behavioral Sciences, University of Washington, Seattle, WA, United States
Synopsis
Lactate dynamics during sleep-awake cycle in human brain are studied non-invasively using single voxel diffusion weighted magnetic resonance spectroscopy (MRS) technique with simultaneous polysomnography (PSG) recordings to characterize sleep stages. Awake lactate apparent diffusion coefficients (ADC) values are large compared to other brain metabolites and may support active transport - Astrocyte-Neuron Lactate Shuttle (ANLS) mechanism. Lactate ADC are reduced in deep sleep stage in young subjects but are unchanged in older subjects. These results may reflect different interstitial fluid exchange activity or changed metabolic state with aging and require further research.
Introduction
Lactate is an important metabolic substrate in human brain and can be monitored using magnetic resonance spectgroscopy.1-3 Lactate concentration is also modulated by Astrocyte-Neuron Lactate Shuttle (ANLS). Recent work suggests that brain lactate may be cleared by increased interstitial fluid exchange activity4 during slow wave sleep stages.5 These functions may change with age and impact brain metabolism. Here, we investigate lactate dynamics during sleep-wake cycle in aging human brain using single voxel diffusion weighted spectroscopy.Methods
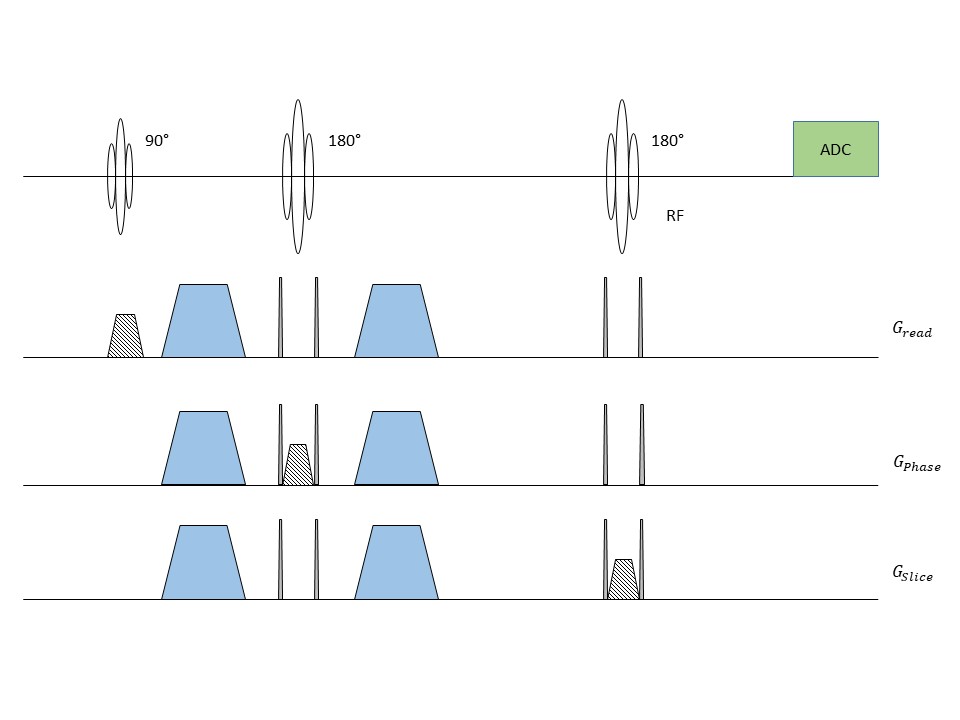
Subject Recruitment: Three young (YS, 25±2 years, 2 female and 1 male) and three old human subjects (OS, 57±3 years, 1 female and 2 males) were recruited and participated under IRB guidelines to study cerebral lactate dynamics under different sleep stage cycles. Subjects were sleep deprived the night before the study and avoided any daytime napping, caffeine and alcohol 24 hours prior to the study.MRS Pulse Sequence and Parameters: A PRESS pulse sequence was modified to turn on and off diffusion sensitizing gradients in all three directions (x, y and z) on alternative scans (Figure 1). A b‑value of 500 s/mm2 (d=25 ms and D=36.6 ms) was used for a voxel placed near parieto-occipital fissure for diffusion weighting. Rest of the sequence parameters were kept the same (TE/TR/np/SW/vol = 270/1875 ms/2048/2600Hz/17.1±2.2 mL).
MRS and polysomnography measurements: Subject were scanned early in the morning at a 3T MR system (Prisma, Siemens Healthcare, Erlangen, Germany) using a 64-channel head/neck receive RF coil with simultaneously PSG (PSG, electroencephalogram (EEG), electrooculography(EOG), electrocardiogram (ECG), respiration and 3D acceleration) recordings using an MR compatible system (Brain Products Inc., GmbH, Munich, Germany). After PSG calibration tests, baseline MRS scan and T1‑weighted MPRAGE anatomic scan, MR suite lights were turned off and subject was asked to sleep. A MRS time series data, with alternating on and off diffusion gradients during alternative TR durations, were acquired during different sleep stages for 136±36 minutes.
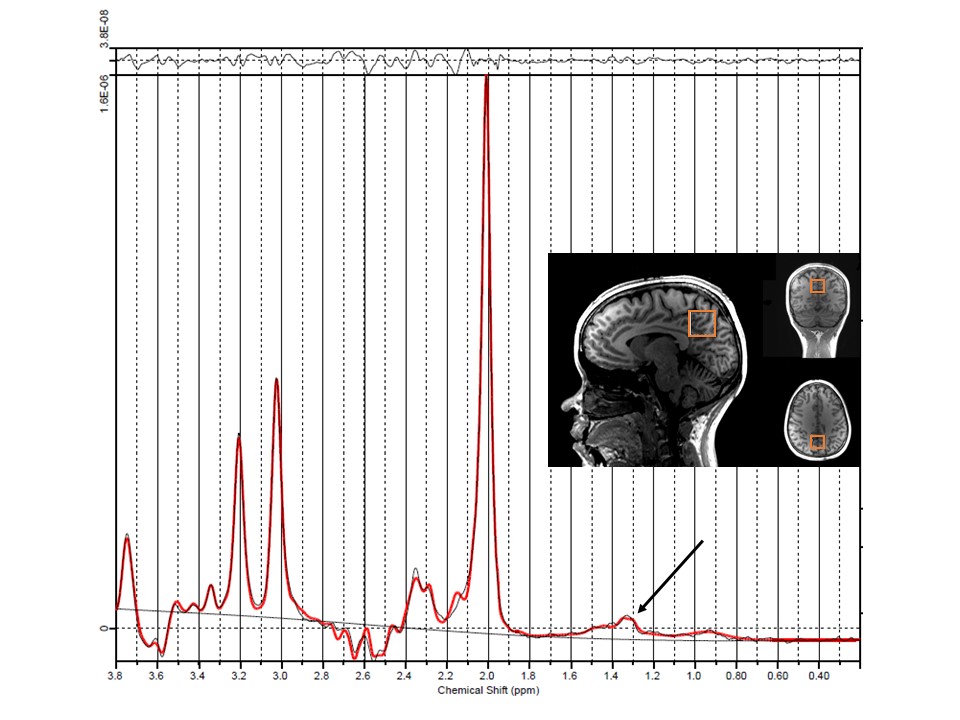
Data Analysis: Temporally registered PSG data was scored for each 30 s epoch and classified into 4 sleep stages6: Wake (W) and non-REM stages (N1, N2, N3) as shown in Figure 2. Spectra corresponding to Awake (W) and Sleep (N1+N2+N3) sleep stages were binned and averaged separately into diffusion weighted (S1) and non-diffusion weighted scans (S0). Individual spectral scans were phase corrected, zero-filled to 3072 points, Lorentzian line-broadened (2 Hz) and registered to NAA peak (python, jMRUI-5.17 and Matlab R2017b (The Mathworks, Natick, MA) softwares). Water peak was digitally suppressed using HLSVD Propack filter8 (jMRUI-5.1). Water suppressed spectra were fit using LCModel software9 (Figure 3). Apparent diffusion coefficient (ADC) was calculated for different metabolites NAA, creatine (Cr), choline (Ch) and lactate (Lac)) using the fitted metabolite signal amplitudes:
ADC = 1/b * ln(S0/S1)
Water signal was fitted as a single peak using AMARES routine in jMRUI-5.1 and ADC value was calculated using the above equation. Metabolite and water ADC values were compared in the two sleep stages using Student’s t-test (paired or unpaired) for reduction in metabolites.
Results
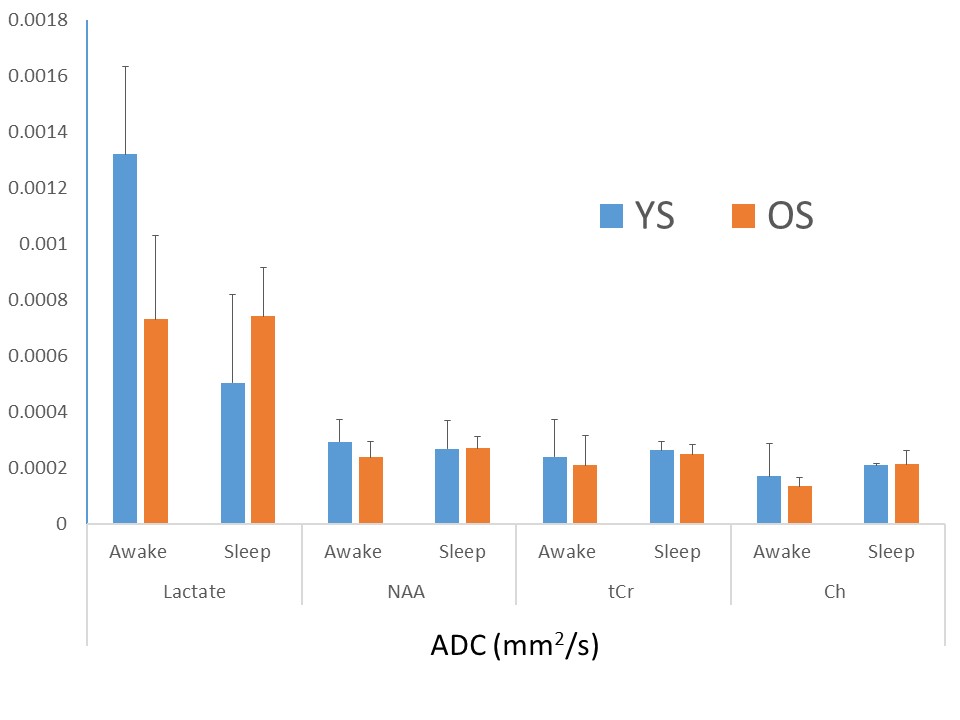
Spectra were fit adequately with signal to noise ratio (65±7 for spectra as determined from LCModel, mean± standard deviation) and discernible lactate peak at 1.33 ppm (Figure 3). Voxel volume was 20.0 ± 4 and 27.0 ± 0.0 mL for YS and OS, respectively. YS spend 40±19 and 96 ± 39 min in Awake and Sleep stages whereas OS spend 28 ± 4 and 80 ± 29 min, respectively (P ~= 0.4). OS spend marginally less time in N3 sleep stage (11.9 ± 6.8 min) compared to YS (23.3 ± 4.2 min, P = 0.09). Lac ADC values were reduced in deep sleep in YS by 62% (P<0.002) whereas there was no significant change in ADC values in OS (P=0.96). NAA, Cr, Ch and water had no significant change in their ADC values (2.9x10⁻⁴, 2.4x10⁻⁴, 1.7x10⁻⁴ and 1.8x10⁻³ mm2/s, respectively, in Awake stage in YS, Figure 4). Lac ADC values are marginally smaller in OS compared to YS (P=0.08).Discussion and Conclusions
Lactate ADC value are higher compared to other brain metabolites indicating an active transport mechanism (ANLS). Its decrease in deep sleep YS may be explained by increased clearance of Lac with increased interstitial fluid exchange activity or decreased astroglial activity or active transport (ANLS). This correlates well with our earlier study looking into decreased lactate concentration changes with sleep. In OS, there is almost no change in ADC values suggesting an altered metabolism or decreased increased interstitial fluid exchange component. Further studies are needed to distinguish influence of these possible mechanisms and bolster these results.Acknowledgements
Prof. Chris Kroenke’s feed-back on diffusion pulse sequence design is gratefully acknowledged.
Grants: Paul G. Allen Family Foundation
References
1. Pellerin, L and Magistretti, PJ. Glutamate uptake into astrocytes stimulates aerobic glycolysis: a mechanism coupling neuronal activity to glucose utilization. Proc. Natl. Acad. Sci. U. S. A. 1994;91:10625-10629.
2. Petit, JM and Magistretti, PJ. Regulation of neuron-astrocyte metabolic coupling across the sleep-wake cycle. Neuroscience. 2016;323:135-156.
3. Mangia S, Garreffa G, Bianchiardi M, Glove F, Di Salle F, Maraviglia B. The aerobic brain: lactate decrease at onset of neural activity. Neuroscience. 2003;118(1):7-10.
4. Iliff JJ, Wang M, Liao Y, Plogg BA, Peng W, Gundersen GA, Benveniste H, Vates GE, Deane R, Goldman SA, Nagelhus EA, Nedergaard M. A paravascular pathway facilitates CSF flow through the brain parenchyma and the clearance of interstitial solutes, including amyloid beta. Sci Transl Med 2012; 4:147ra111.
5. Yildiz S, Lim MM, Sammi MK, Powers K, Murchison C, Iliff JJ, Rooney WD. Sleep dependent changes of lactate concentration in human brain. 2019 (submitted).
6. American Academy of Sleep Medicine. AASM Manual for the Scoring of Sleep and Associated Events: Rules, Terminology and Technical Specifications. American Academy of Sleep Medicine; 2017.
7. Laudadio T, Mastronardi N, Vanhamme L, Van Hecke P and Van Huffel S. Improved Lanczos Algorithms for Blackbox MRS Data Quantitation. J Magn Reson. 2002;157:292-297.
8. Provencher S. Estimation of metabolite concentrations from localized in vivo proton NMR spectra. Magn Reson Med. 1993;30:672-679.
9.
Vanhamme L, van den
Boogaart A, Van Huffel S, Improved method for accurate and efficient
quantification of MRS data with use of prior knowledge. J Magn Reson. 1997;129:35-43.
Figures