0190
Age-dependent variation in CEST signal at low B1 may reflect decline of lipids in older brain tissue1Center for Magnetic Resonance and Optical Imaging, University of Pennsylvania, Philadelphia, PA, United States, 2Graduate Group in Biochemistry and Biophysics, University of Pennsylvania, Philadelphia, PA, United States
Synopsis
In investigating the problem of CEST correction methods for low saturation B1, we observed differences in the behavior of the CEST asymmetry signal as a function of age. We believe this incidental observation to be a manifestation of the low saturation power induced NOE reported in other literature. In this case, we hypothesize that the physiological phenomenon underlying the pattern we observe is a decrease in myelin or other lipids in the aging brain. Our T1 maps corroborate literature collected at lower field strength that T1 values increase with age; however, this appears to be an independent, if related, phenomenon.
Introduction
Recent work in our group has endeavored to develop improved methods for correcting chemical exchange saturation transfer (CEST) images for inhomogeneity in saturation B1 (1). Our group most commonly performs gluCEST, which is a high-power CEST modality for which optimal saturation B1 power > 3μT (1,2,3). However, because of the dielectric properties of the human head, in practice B1 throughout the field of view largely falls short of the intended strength, frequently reaching levels as low as 40% of the nominal power. In this regime, CEST asymmetry at 3.0 ppm no longer reflects glutamate and is actually of opposite sign ("negative"), a phenomenon attributed to NOE-like cross-relaxation with lipid aliphatic chains and other moieties centered at -3.5 ppm (4). Our analysis included measurement and fitting of this NOE-dominated regime, in which we observed clear differences between subjects of different ages. NOE at 7T has been used to examine glioma patients (5,6), but little has been reported about its use in other contexts. While the purpose of this data collection and analysis was not observation of the NOE effect per se, we believe that the age-dependent differences we observe in this signal are the first detection of brain lipid decline in aging populations by a magnetization transfer-based technique.Methods
All images were obtained on a Siemens 7.0T Magnetom (Siemens Healthcare, Erlangen, Germany) scanner outfitted with a single volume transmit/32 channel receive phased array head coil (Nova Medical, Wilmington, MA, USA). All volunteers used in gathering B1 calibration data were healthy subjects ages 24-69, who were scanned with informed consent under local internal review board (IRB) supervision. T1 map data was also collected from older subjects who were healthy controls in a clinical research protocol.B1 calibration data was collected with a single-slice CEST sequence based on gradient-recalled echo with the following parameters: TR/TE = 4.7/2.3 ms, 10 degree flip angle, 10 mm slice thickness, with .75 x .75 mm2 in plane resolution over a 160 x 160 mm2 field of view. Magnetization preparation was achieved using five 3.0µT RMS amplitude, 98 ms Hanning shaped pulses with 2 ms interpulse delay applied at offset frequencies {±1.8, 2.1, 2.4, 2.7, 3.0, 3.3, 3.6, 3.9, 4.2} relative to water. CEST-weighted images were corrected for the B0 field distribution using a WASSR acquisition (7). B1 maps were acquired as described in (8). T1 maps were generated by the Siemens product sequence MP2RAGE.
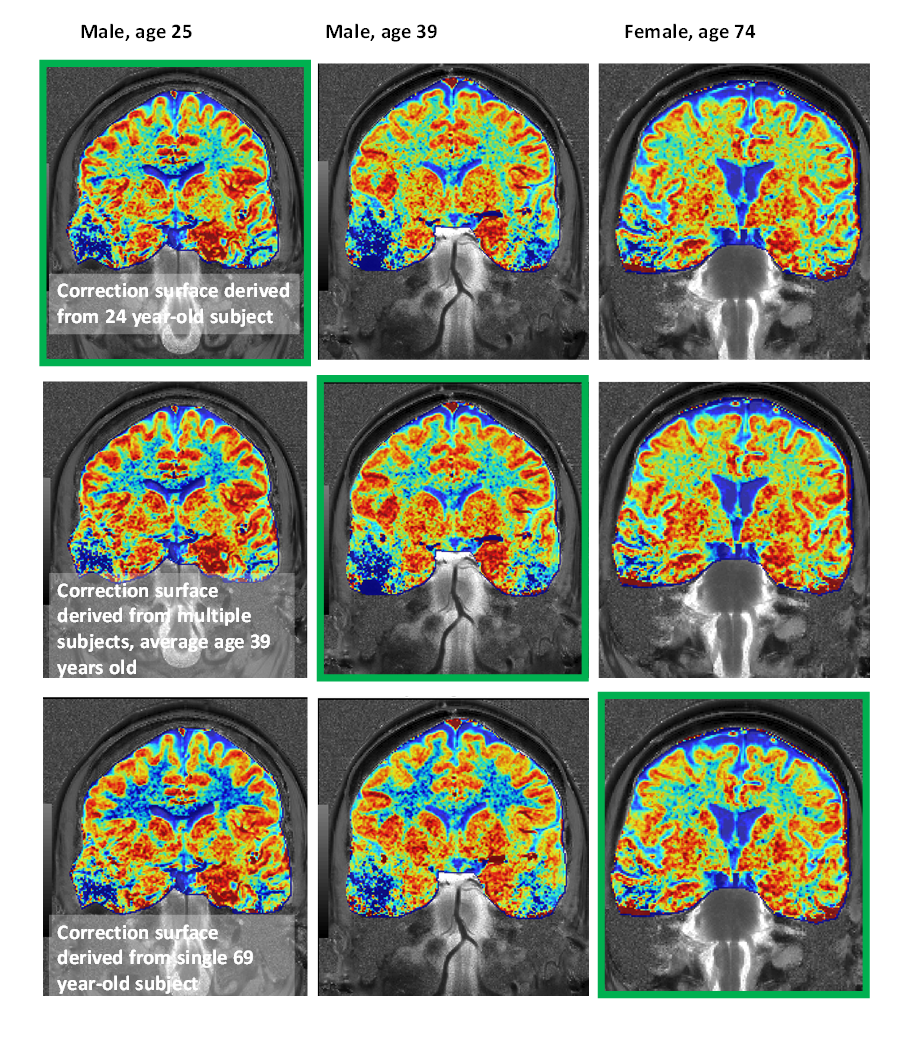
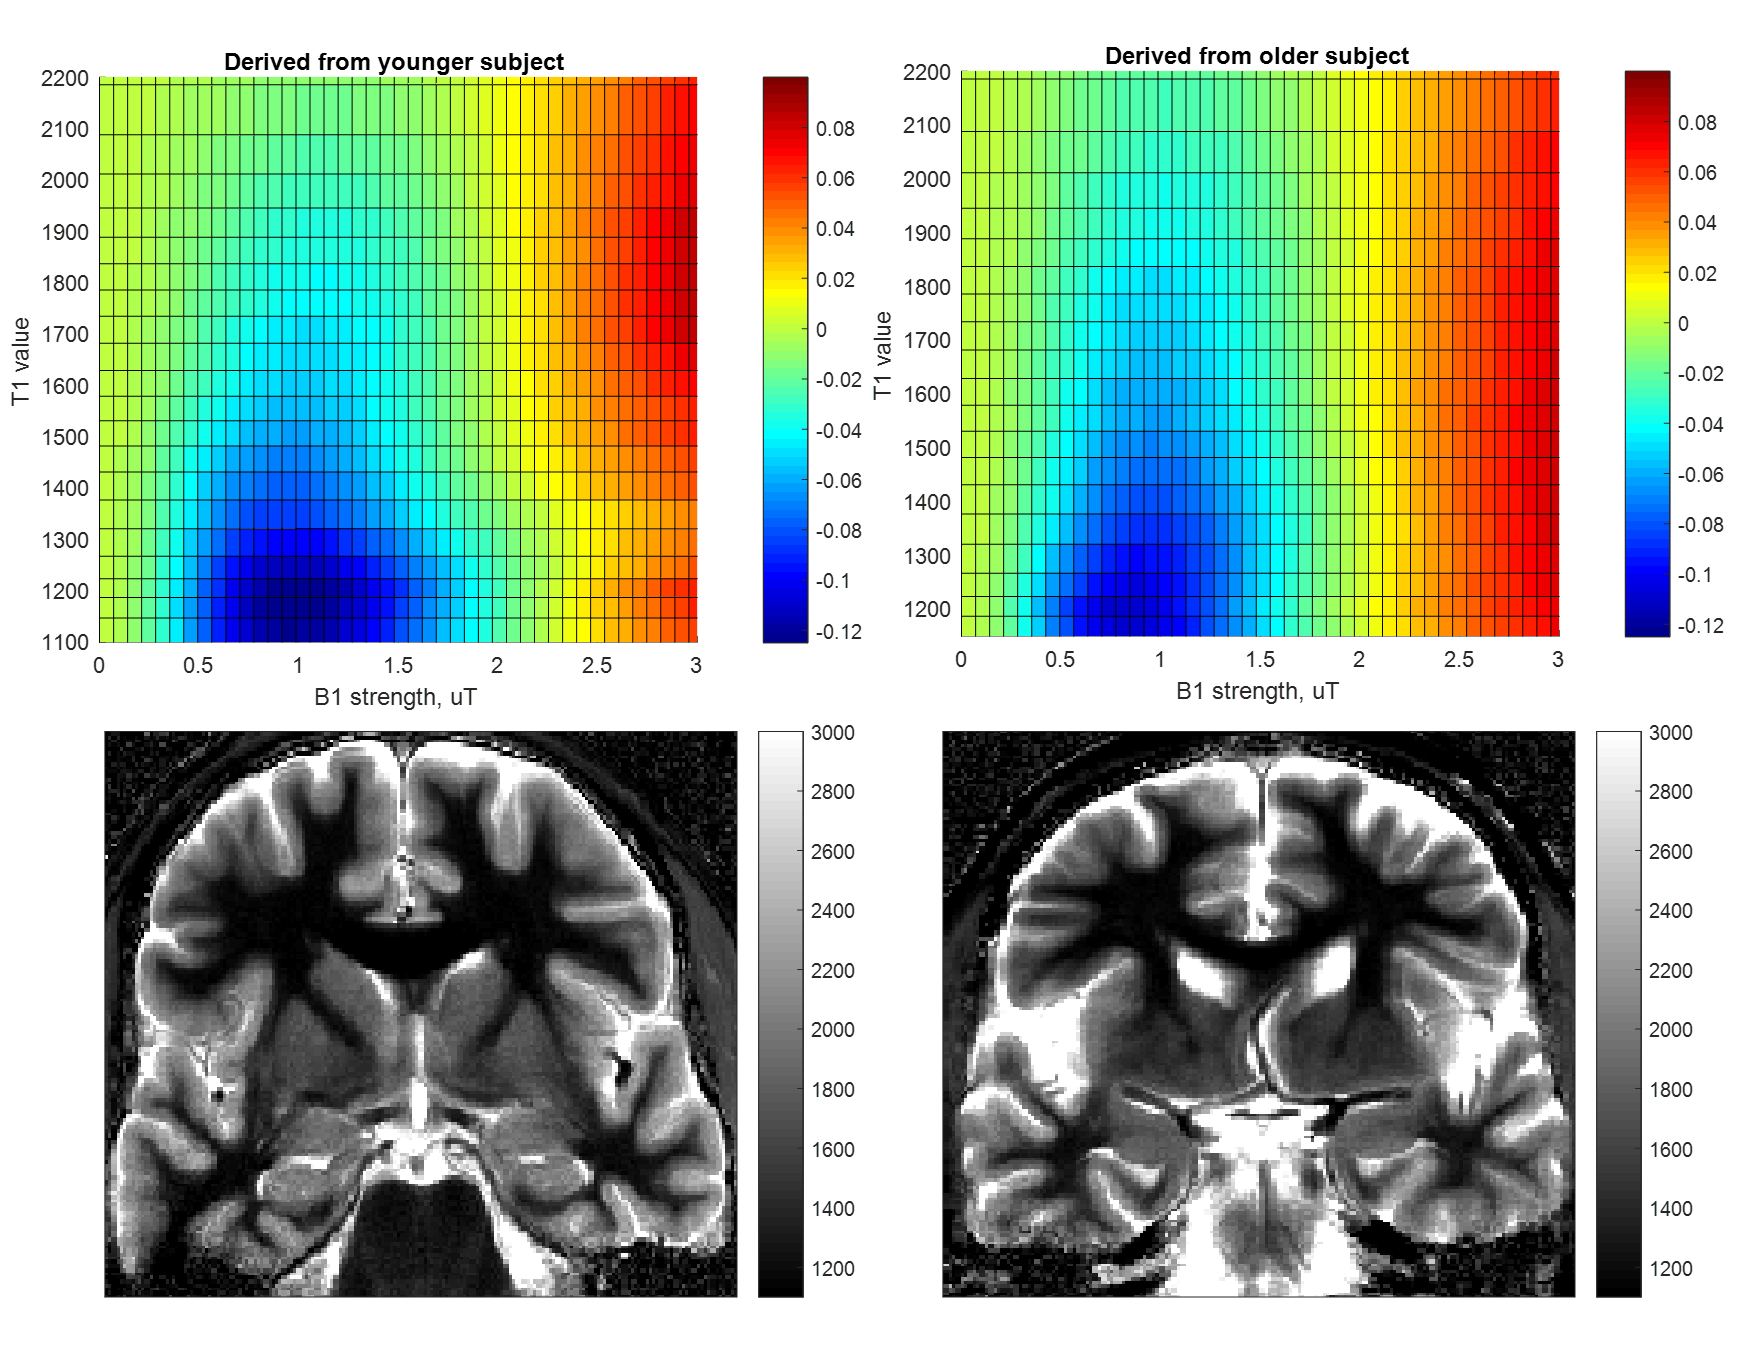
Fitting and analysis of B1 calibration data and resulting correction of gluCEST images shown in Figure 1 is as described in (1). Briefly, calibration data from positive and negative offset images were fit to the equation $$M_{z}(B_{1}) = 1 + \frac{A*B_1^2}{C*B_1^2 +1}-D*B_1^2$$ for each T1-binned mask. The surfaces shown in Figure 2 are generated by subtraction and normalization of the type of surfaces used in our correction method.
Results and Conclusions
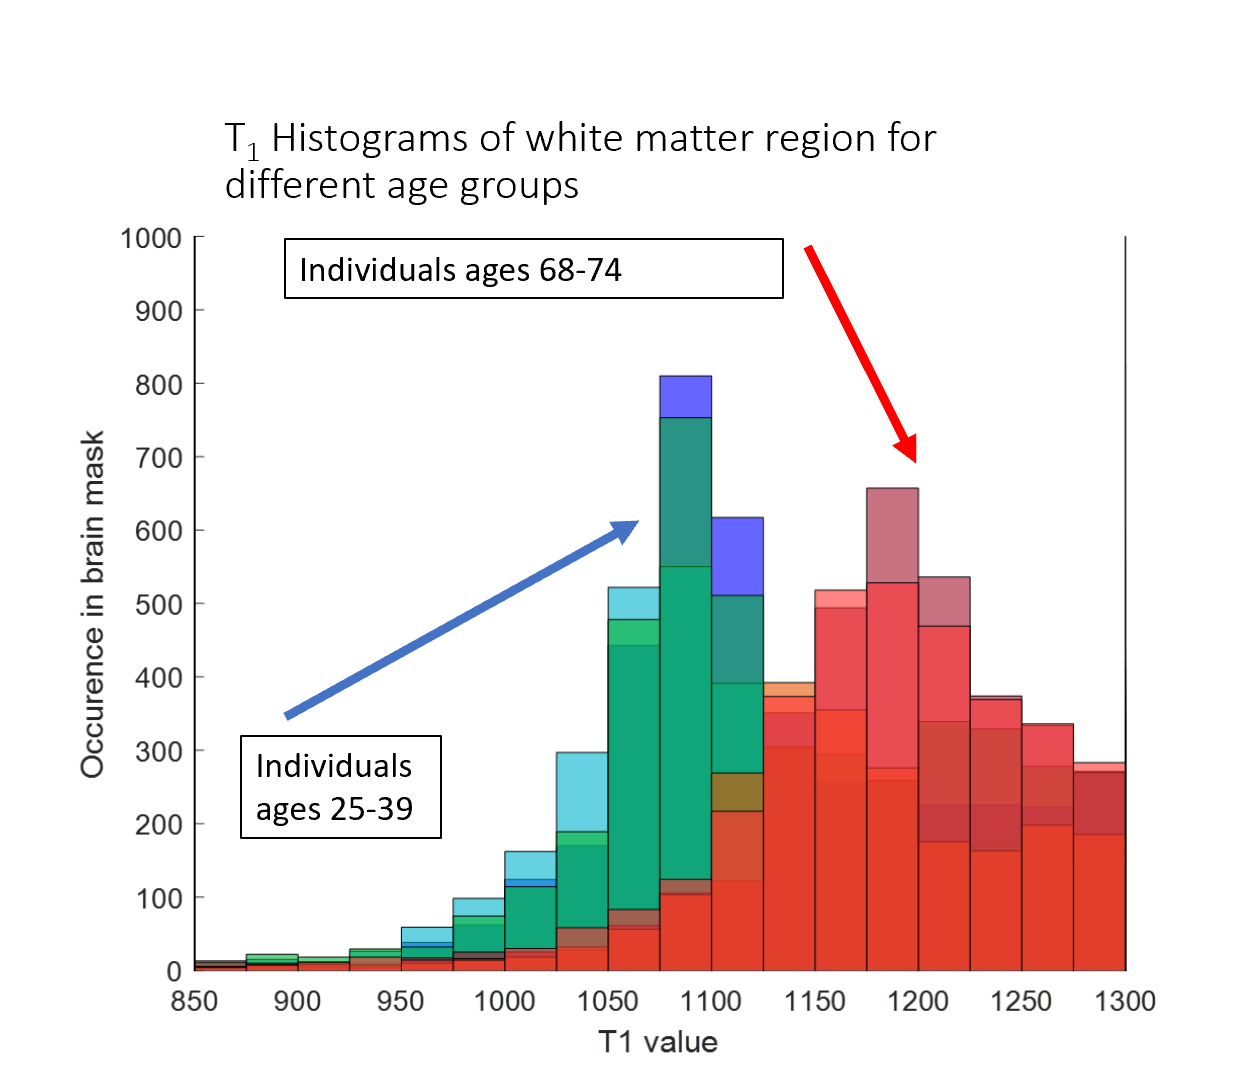
We originally observed that gluCEST images give more reasonable results when the correction applied roughly reflects the age of the subject (Figure 1). Upon investigation, it appeared that the reason for this is an age-dependent variability of the behavior of CEST contrast at lower B1 (at which glutamate contrast does not yet strongly contribute). This difference can be visualized in the heat map style plots in Figure 2. The top row of Figure 2 shows example CEST contrast surfaces (asymmetry at ±3.0ppm) derived from fits to data from one younger and one older subject. At low B1 (minimum at approximately 1μT), lower-T1 masks exhibit a strong "negative" signal, attributed to NOE contributions from lipid aliphatic chains. (It is also possible that this is an indirect cross-relaxation effect, mediated by a true proton-exchange with bound water which then cross-relaxes with lipid, rather than the bulk water doing so directly.) This “valley” is deeper in the white matter of younger subjects. Given the established role of lipid dynamics in aging (9, 10, 11, 12), we believe that this may reflect a higher concentration of lipids in younger brains.It will be noticed that the “T1 value” axis in Figure 2 begins at 1100ms for the younger subject, but at 1150ms for the older one. According to our measurements, pixels with T1 value < 1150ms are almost completely absent in subjects aged 60 and above (Figure 3). Increase in T1 value with aging has been documented in earlier literature (13,14), but does not appear to have been quantified yet at ultra-high field strength. At first, we supposed that the difference in CEST contrast at low B1 across different ages was simply a reflection of the shift in T1 values; i.e. the same family of curves could be used for all subjects for a given absolute T1. However, inspection of Figure 2 illustrates that this is not the case: even for a given T1 value, the dependence of the CEST signal on saturation B1 differs with age. This supports the notion that low-B1 NOE-origin contrast is reflecting a physico-chemical change distinct from that manifesting in the shift of T1 values. This signal, while detected incidentally in the present results, could in the future be measured explicitly as an indicator of brain health and aging progression.
Acknowledgements
The authors wish to acknowledge all volunteers who underwent scanning to contribute to the data for this project. Research at the CMROI is supported by a P-41 mechanism grant from the National Institute of Biomedical Imaging and Bioengineering.References
1) Cember et al [abstract, submitted]. New Post-Processing Correction for B1 Inhomogeneity Improves Results in 3D GluCEST Images. Proceedings of the Annual Meeting of the International Society for Magnetic Resonance in Medicine. Sydney, Australia, 2020.
2) Cember et al [abstract, submitted]. Volumetric (3D) glutamate CEST facilitated by mitigation of B1 inhomogeneity with dielectric padding. Proceedings of the Annual Meeting of the International Society for Magnetic Resonance in Medicine. Sydney, Australia, 2020.
3) Cai K. et al. Magnetic resonance imaging of glutamate. Nature Medicine 2012: 18
4) Liu, D. et al. Quantitative Characterization of Nuclear Overhauser Enhancement and Amide Proton Transfer Effects in the Human Brain at 7 Tesla. Magnetic Resonance in Medicine 2013: 70 (4).
5) Zaiss, M. et al. Relaxation-compensated CEST-MRI of the human brain at 7T: Unbiased insight into NOE and amide signal changes in human glioblastoma. NeuorImage 2015: 112.
6) Heo, H. et al. Whole-Brain Amide Proton Transfer (APT) and Nuclear Overhauser Enhancement (NOE) Imaging in Glioma Patients Using Low-Power Steady-State Pulsed Chemical Exchange Saturation Transfer (CEST) Imaging at 7T. J. Magn. Reson. Imaging 2016: 44
7) Kim, M. et al. Water saturation shift referencing (WASSR) for chemical exchange saturation transfer (CEST) experiments. Magnetic Resonance in Medicine 2009: 61(6)
8) Volz, S. et al. A fast B1-mapping method for the correction and normalization of magnetization transfer ratio maps at 3T. Neuorimage 2010: 49(4)
9) Wallin A. et al. Decreased myelin lipids in Alzheimer’s disease and vascular dementia. Acta Neurologica Scandinavica 1989: 80 (4).
10) Jove, M. et al. Lipids and lipoxidation in human brain aging. Mitochondrial ATP-synthase as a key lipoxidation target. Redox Biology 2019.
11) Klosinski L. et al. White Matter Lipids as Ketogenic Fuel Supply in Aging Female Brain: Implications for Alzheimer’s Disease. EBioMedicine 2015: 2 (12).
12) Naudi, A. et al. Lipidomics of Human Brain Aging and Alzheimer’s Disease Pathology. International review of Neurobiology 2015 : 122.
13) Cho, S. et al. Establishing Norms for Age-Related Changes in Proton T1 of Human Brain Tissue In Vivo. Magnetic Resonance Imaging 1997.
14) Munoz Maniega, S. et al. White matter hyperintensities and normal-appearing white matter integrity in the aging brain. Neurobiology of Aging, 2015: 36 (2).
Figures